Is Student Loan Forgiveness for the Marginalized?

Image may contain: text

I saw this floating around Facebook recently with the news of Elizabeth Warren’s student loan plan. For those unfamiliar with what Mayfield is referencing, here’s the entry from the HarperCollins Bible Dictionary:

As another Bible dictionary clarifies, “Though Leviticus 25 does not explicitly discuss debt cancellation, the return of an Israelite to his land plus the release of slaves implies the cancellation of debts that led to slavery or the loss of land.”

So does Warren’s plan benefit “the marginalized”?

According to Adam Looney at the Brookings Institution, Warren’s proposal is “regressive, expensive, and full of uncertainties…[T]he top 20 percent of households receive about 27 percent of all annual savings, and the top 40 percent about 66 percent. The bottom 20 percent of borrowers by income get only 4 percent of the savings. Borrowers with advanced degrees represent 27 percent of borrowers, but would claim 37 percent of the annual benefit.”

E Warren Distribution of benefit

He continues,

Debt relief for student loan borrowers, of course, only benefits those who have gone to college, and those who have gone to college generally fare much better in our economy than those who don’t. So any student-loan debt relief proposal needs first to confront a simple question: Why are those who went to college more deserving of aid than those who didn’t? More than 90 percent of children from the highest-income families have attended college by age 22 versus 35 percent from the lowest-income families. Workers with bachelor’s degrees earn about $500,000 more over the course of their careers than individuals with high school diplomas. That’s why about 50 percent of all student debt is owed by borrowers in the top quartile of the income distribution and only 10 percent owed by the bottom 25 percent. Indeed, the majority of all student debt is owed by borrowers with graduate degrees.

Drawing on 2016 data from the Federal Reserve’s Survey of Consumer Finances, Looney’s final analysis

shows that low-income borrowers save about $569 in annual payments under the proposal, compared to $900 in the top 10 percent and $2,653 in the 80th to 90th percentiles. Examining the distribution of benefits, top-quintile households receive about 27 percent of all annual savings, and the top 40 percent about 66 percent. The bottom 20 percent of borrowers by income get 4 percent of the savings…[W]hile households headed by individuals with advanced degrees represent only 27 percent of student borrowers, they would claim 37 percent of the annual savings. White-collar workers claim roughly half of all savings from the proposal. While the Survey of Consumer Finances does not publish detailed occupational classification data, the occupational group receiving the largest average (and total) amount of loan forgiveness is the category that includes lawyers, doctors, engineers, architects, managers, and executives.  Non-working borrowers are, by and large, already insured against having to make payments through income-based repayment or forbearances; most have already suspended their loan payments. While debt relief may improve their future finances or provide peace of mind, it doesn’t offer these borrowers much more relief than that available today.  

The Urban Institute’s analysis has similar findings (though their tone is more optimistic):

figure 2
figure 3

I’m not sure whether or not Warren’s plan is a good one (I’m skeptical, especially given some of the results abroad). But I’m not big on acting like college graduates in a rich country are the marginalized of society.

Does Good Management Produce More Equal Pay?

Nicholas Bloom–whose research on the economics of management I’ve relied on in my own work–and colleagues have an interesting article in Harvard Business Review:

For 2010 and 2015, the U.S. Census Bureau fielded the Management and Organizational Practices Survey (MOPS) in partnership with a research team of subject matter experts, including one of us (Nick), as well as Erik Brynjolfsson and John Van Reenen. The MOPS collects information on the use of management practices related to monitoring (collecting and analyzing data on how the business is performing), targets (setting tough, but achievable, short- and long-term goals), and incentives (rewarding high performers while training, reassigning, or dismissing low performers) at a representative sample of approximately 50,000 U.S. manufacturing plants per survey wave. We refer to practices that are more explicit, formal, frequent, or specific as “more structured practices.” From the MOPS and related data, researchers have demonstrated just how important the use of these structured management practices is for companies and even entire economies, since firms that implement more of these practices tend to perform better.  We wanted to know what effect these management practices have on workers.

We found that companies that reported more structured management practices according to the MOPS paid their employees more equally, as measured by the difference between pay for workers at the 90th (top) and 10th (bottom) percentiles within each firm.

The authors fully admit, “To be honest, it surprised us…If anything, we expected the opposite…We hypothesized that more structured management would lead to rewarding high-performers over others, therefore leading to a rise in inequality inside of the firm. As the chart above shows, the reality is exactly the reverse – and that remains true even after controlling for employment, capital usage, firm age, industry, state, and how educated the employees are.” They continue,

Our research finds that the negative correlation between structured management and inequality is driven by a strong negative correlation between the use of structured monitoring practices and inequality. By contrast, higher usage of structured incentives practices was positively correlated with inequality, albeit weakly. In other words, our finding seems to suggest that companies that collect and analyze specific and high-frequency data about their businesses tend to have a smaller gap between the earnings of workers at the top of the income distribution and the earnings of workers at the bottom of the distribution.

The authors offer several possible explanations:

Previous research shows that firms with more structured management practices are more profitable on average, and there’s long been evidence that when companies make extra profits they share some of them with workers. Perhaps companies with more structured practices allocate these profits such that less well-paid workers get more of the pie.

The relationship could also result from increased efficiency. Maybe firms with more structured practices have more efficient low-paid workers, as a response to training or monitoring practices, and their pay reflects that extra efficiency.

Finally, it could be that firms with more structured practices are more focused on specific tasks and rely more on outsourcing. More and more companies are outsourcing tasks like cleaning, catering, security, and transport. If outsourcing is more common for firms that use more structured practices, workers performing tasks outside of the companies’ core tasks would no longer be on those companies’ direct payrolls. If the jobs that are outsourced are lower-paying than the jobs that are held by employees, the companies’ pay data will become more equal.

Other research finds that paying employees higher wages

  • Motivates employees to work harder.
  • Attracts more capable and productive workers.
  • Lead to lower turnover
  • Enhance quality and customer service
  • Reduce disciplinary problems and absenteeism
  • Require fewer resources for monitoring
  • Reduces poor performance caused by financial anxiety

Looking forward to Bloom et al.’s published work.

Is Contract Enforcement Important for Firm Productivity?

Contract enforcement is a major player in measuring the ease of doing business in a country. A new working paper demonstrates the importance of enforceable contracts to firm productivity:

In Boehm and Oberfield (2018) we study the use of intermediate inputs (materials) by manufacturing plants in India and link the patterns we find to a major institutional failure: the long delays that petitioners face when trying to enforce contracts in a court of justice. India has long struggled with the sluggishness of its judicial system. Since the 1950’s, the Law Commission of India has repeatedly highlighted the enormous backlogs and suggested policies to alleviate the problem, but with little success. Some of these delays make international headlines, such as in 2010, when eight executives were convicted in the first instance for culpability in the 1984 Bhopal gas leak disaster. One of them had already passed away, and the other seven appealed the conviction (Financial Times 2010)

These delays are not only a social problem, but also an economic problem. When enforcement is weak, firms may choose to purchase from suppliers that they trust (relatives, or long-standing business partners), or avoid purchasing the inputs altogether such as by vertically integrating and making the components themselves, or by switching to a different production process. These decisions can be costly. Components that are tailored specifically to the buyer (‘relationship-specific’ intermediate inputs) are more prone to hold-up problems, and are therefore more dependent on formal court enforcement.

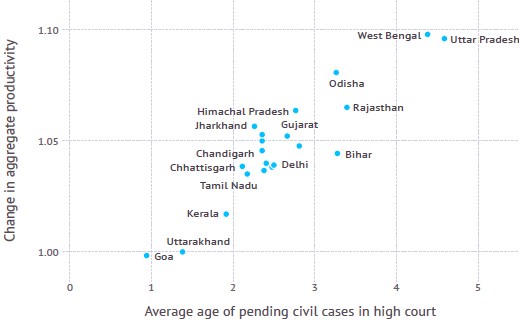
…Our results suggest that courts may be important in shaping aggregate productivity. For each state we ask how much aggregate productivity of the manufacturing sector would rise if court congestion were reduced to be in line with the least congested state. On average across states, the boost to productivity is roughly 5%, and the gains for the states with the most congested courts are roughly 10% (Figure 3).

Are Immigrants a Threat?

Image result for immigration

From a new working paper:

The empirical evidence comes down decidedly on the side of immigrants being less likely to commit crimes. A large body of empirical research concludes that immigrants are less likely than similar US natives to commit crimes, and the incarceration rate is lower among the foreign-born than among the native-born (see, for example, Butcher and Piehl 1998a, 1998b, 2007; Hagan and Palloni 1999; Rumbaut et al. 2006). Among men ages 18 to 39—prime ages for engaging in criminal behavior—the incarceration rate among immigrants is one-fourth the rate among US natives (National Academies of Sciences, Engineering, and Medicine 2015).

…There is some evidence that the lower propensity of immigrants to commit crimes does not carry over to immigrants’ children. The US-born children of immigrants—often called the “second generation”— appear to engage in criminal behavior at rates similar to other US natives (Bersani 2014a, 2014b). This 4 “downward assimilation” may be surprising, since the second generation tends to considerably outperform their immigrant parents in terms of education and labor-market outcomes and therefore might be expected to have even lower rates of criminal behavior (National Academies of Sciences, Engineering, and Medicine 2015). Instead, immigrants’ children are much like their peers in terms of criminal behavior. This evidence mirrors findings that the immigrant advantage over US natives in terms of health tends to not carry over to the second generation (e.g., Acevedo-Garcia et al. 2010).

Although immigrants are less likely to commit crimes than similar US natives, they are disproportionately male and relatively young—characteristics associated with crime. Does this difference in demographic composition mean that the average immigrant is more likely than the average US native to commit crimes? Studies comparing immigrants’ and US natives’ criminal behavior and incarceration rates tend to focus on relatively young men, leaving the broader question unanswered. However, indirect evidence is available from looking at the relationship between immigration and crime rates. If the average immigrant is more likely than the average US native to commit crimes, areas with more immigrants should have higher crime rates than areas with fewer immigrants. The evidence here is clear: crime rates are no higher, and are perhaps lower, in areas with more immigrants. An extensive body of research examines how changes in the foreign-born share of the population affect changes in crime rates. Focusing on changes allows researchers to control for unobservable differences across areas. The finding of either a null relationship or a small negative relationship holds in raw comparisons, in studies that control for other variables that could underlie the results from raw comparisons, and in studies that use instrumental variables to identify immigrant inflows that are independent of factors that also affect crime rates, such as underlying economic conditions (see, for example, Butcher and Piehl 1998b; Lee, Martinez, and Rosenfeld 2001; Reid et al. 2005; Graif and Sampson 2009; Ousey and Kubrin 2009; Stowell et al. 2009; Wadsworth 2010; MacDonald, Hipp, and Gill 2013; Adelman et al. 2017). The lack of a positive relationship is generally robust to using different measures of immigration, looking at different types of crimes, and examining different geographic levels.2 Further, the lack of a positive relationship suggests that immigration does not cause US natives to commit more crimes. This might occur if immigration worsens natives’ labor market opportunities, for example.

The few studies that examine crime among unauthorized immigrants have findings that are consistent with the broader pattern among immigrants—namely, unauthorized immigrants are less likely to commit crimes than similar US natives (apart from immigration-related offenses).4 Likewise, studies that examine the link between the estimated number of unauthorized immigrants as a share of an area’s population and crime rates in that area typically find evidence of null or negative effects (pg. 3-5).

Comparatively, the effects of border control on crime is mixed. The authors conclude,

A crucial fact seems to have been forgotten by some policy makers as they have ramped up immigration enforcement over the last two decades: immigrants are less likely to commit crimes than similar US natives. This is not to say that immigrants never commit crimes. But the evidence is clear that they are not more likely to do so than US natives. The comprehensive 2015 National Academies of Sciences, Engineering, and Medicine report on immigration integration concludes that the finding that immigrants are less likely to commit crimes than US natives “seems to apply to all racial and ethnic groups of immigrants, as well as applying over different decades and across varying historical contexts” (328). Unauthorized immigrants may be slightly more likely than legal immigrants to commit crimes, but they are still less likely than their US-born peers to do so. Further, areas with more immigrants tend to have lower rates of violent and property crimes. In the face of such evidence, policies aimed at reducing the number of immigrants, including unauthorized immigrants, seem unlikely to reduce crime and increase public safety (pg. 11).

Does Female Autonomy Lead to Long-Term Economic Growth?

From a new study:

A number of development economists have found higher gender inequality to be associated with slower development. Amartya Sen (1990) estimated a large number of ‘missing women’, which resulted in skewed sex ratios, and argued that this has been one of history’s crucial development hurdles. Stephan Klasen, with various co-authors, used macroeconomic regressions to show that gender inequality has usually been associated with lower GDP growth in developing countries during the last few decades (Klasen and Lamanna 2009, Gruen and Klasen 2008). This resulted in development policies targeted specifically at women. In 2005, for example, UN Secretary General Kofi Annan stated that gender equality is a prerequisite for eliminating poverty, reducing infant mortality, and reaching universal education (UN 2005). In recent periods, however, a number of doubts have been made public by development economists. Esther Duflo (2012) suggested that there is no automatic effect of gender equality on poverty reduction, citing a number of studies. The causal direction from poverty to gender inequality might be at least as strong as in the opposite direction, according to this view.

…In a new study, we directly assess the growth effects of female autonomy in a dynamic historical context (Baten and de Pleijt 2018). Given the obviously crucial role of endogeneity issues in this debate, we carefully consider the causal nature of the relationship. More specifically, we exploit relatively exogenous variation of (migration-adjusted) lactose tolerance and pasture suitability as instrumental variables for female autonomy. The idea is that high lactose tolerance increased the demand for dairy farming, whereas similarly, a high share of land suitable for pasture farming allowed more supply. In dairy farming, women traditionally had a strong role, which allowed them to participate substantially in income generation during the late medieval and early modern period (Voigtländer and Voth 2013). In contrast, female participation was limited in grain farming, as it requires substantial upper-body strength (Alesina et al. 2013). Hence, the genetic factor of lactose tolerance and pasture suitability influences long-term differences in gender-specific agricultural specialisation. In instrumental variable regressions, we show that the relationship between female autonomy and human capital is likely to be causal (and also address additional econometric issues, such as the exclusion restriction, using Oster ratios, etc.). 

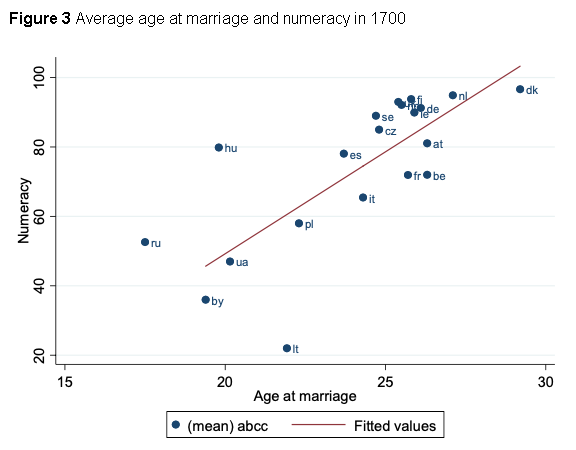
Age-heaping-based numeracy estimates reflect a crucial component of human capital formation. Recent evidence documents that numerical skills are the ones that matter most for economic growth. Hanushek and Woessmann (2012) argued that maths and science skills were crucial for economic success in the 20th century. They observed that these kinds of skills outperform simple measures of school enrolment in explaining economic development. Hence, in the new study we focus on math-related indicators of basic numeracy. We use two different datasets: first, we use a panel dataset of European countries from 1500 to 1850, which covers a long time horizon; second we study 268 regions in Europe, stretching from the Ural mountains in the east to Spain in the southwest and the UK in the northwest. 

Average age at marriage is used as a proxy for female autonomy. Low age at marriage is usually associated with low female autonomy. Age at marriage is highly correlated with other indicators of female autonomy, such as the share of female household heads or the share of couples in which the wife was older than the husband. Age at marriage is particularly interesting because of the microeconomic channel that runs from labour experience to an increase in women’s human capital. After marriage, women typically dropped out of the labour market, and switched to work in the household economy (Diebolt and Perrin 2013). Consequently, after early marriage women provided less teaching and self-learning encouragement to their children, including numeracy and other skills. Early-married women sometimes also valued these skills less because they did not ‘belong to their sphere’, i.e. these skills did not allow identification (Baten et al. 2017).

What do they find?

Figure 3 depicts a strong and positive relationship between average age at marriage and numeracy for the two half centuries following 1700 and 1800. Most countries are close to the regression line. Denmark, the Netherlands, Germany, Sweden, and other countries had high values of female autonomy and numeracy – interestingly, many of the countries of the Second Industrial Revolution of the late 19th century, rather than the UK, the first industrial nation. In contrast, Russia, Poland, Slovakia, Italy, Spain, and Ireland had low values in both periods.

In our regression analyses, we include a large number of control variables, such as religion, serfdom, international trade, and political institutions. We find that the relationship between female autonomy and numeracy is very robust.

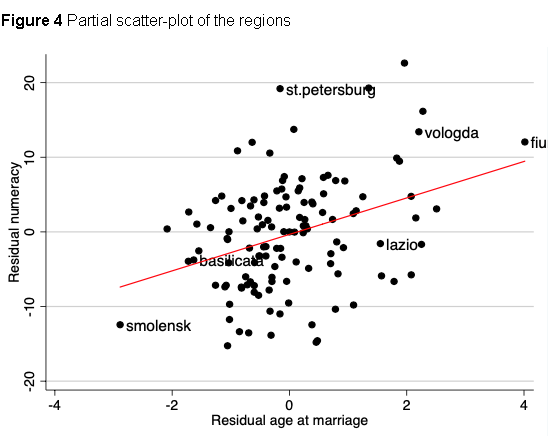
We also study the relationship between female autonomy and human capital formation at the regional level in the 19th century. Numeracy and age at marriage (after controlling for country-fixed effects and other control variables) yield an upward sloping regression line (Figure 4). 

…In sum, the empirical results suggest that economies with more female autonomy became (or remained) superstars in economic development. The female part of the population needed to contribute to overall human capital formation and prosperity, otherwise the competition with other economies was lost. Institutions that excluded women from developing human capital – such as being married early, and hence, often dropping out of independent, skill-demanding economic activities – prevented many economies from being successful in human history.


What Are the Effects of Economic Freedom at the State Level?

A brand new paper from the Mission Foods Texas-Mexico Center at SMU:

In this paper, we examine the relationship between institutional quality and bilateral trade patterns between Mexican states and U.S. states. We are contributing to the small, but growing, literature which uses gravity models to examine economic exchange at the subnational level (see Havranek and Irsova 2017 for a recent review of this literature). We are the first to explicitly incorporate institutional quality into a model of trade between the U.S. states and Mexican states, and the first to examine these sorts of relationships between the U.S. and Mexican states more generally. Poor institutions can be viewed as a cost for potential trading partners, and economic theory tells us that when an action becomes more costly, less of that action will be undertaken. Conversely, when an action becomes less costly, more of that action will be undertaken. We find that states with better institutional environments as measured by the Economic Freedom of North America index do, indeed, realize higher levels of trade. We also contribute to the literature examining trade border effects (Hillberry and Hummels 2002; Chen 2004; Head and Ries 2001) by examining the impact the border has on trade between the U.S. states and Mexican states. Finally, we use our dataset to examine the relationship between trade volume and three measures of economic prosperity (pg. 6).

The authors lay out their key findings and policy recommendations:

Economic institutions matter.

Minimum Wage & Low-Skilled Workers: More Evidence

Image result for minimum wage

Ready for yet another post on the minimum wage? From a recent paper in the Journal of Public Economics:

Our empirical analysis uses the fact that the 2007 through 2009 increases in the federal minimum wage were differentially binding across states. We base our “bound” designation on whether a state’s January 2008 minimum wage was below $6.55, rendering it bound by the entirety of the July 2009 increase. In the states we describe as “unbound,” the effective minimum wage rose, on average, by $1.42 between 2006 and 2012. In the states we describe as “bound,” the effective minimum wage rose, on average, by $2.04. Of the long-run differential, $0.58 took effect on July 24, 2009.

We use monthly, individual-level panel data from the 2008 panel of the Survey of Income and Program Participation (SIPP) to implement a combination of difference-in-differences and triple difference research designs. Because we use longitudinal employment records with data on wage rates, our implementation of these research designs has two key advantages. First, we are able to pinpoint “target” groups more intensely affected by minimum wage increases than the analysis groups in many studies. Second, we are able to pinpoint workers who were not directly affected yet, as evidenced by their wage rates, were only moderately more skilled than the “target” workers. We incorporate this second group of workers into our analysis as a “within-state control” group. That is, we use this group to construct a set of counterfactuals that proxy for otherwise unobserved shocks to the low-skilled labor market (pg. 53).

What do they find?:

  • “We find that increases in the minimum wage significantly reduced the employment of low-skilled workers. By the second year following the $7.25 minimum wage’s implementation, we estimate that targeted individuals’ employment rates had fallen by 6.6 percentage points (9%) more in bound states than in unbound states. The implied elasticity of our target group’s employment with respect to the minimum wage is −1, which is large within the context of the existing literature” (pg. 54).
  • The average monthly incomes of low-skilled individuals decreased. “Relative to low-skilled workers in unbound states, targeted individuals’ average monthly incomes fell by $90 over the first year and by an additional $50 over the following 2 years. While surprising at first glance, we show that these estimates can be straightforwardly explained through our estimated effects on employment, the likelihood of working without pay, and subsequent lost wage growth associated with lost experience. We estimate, for example, that targeted workers experienced a 5 percentage point decline in their medium-run probability of reaching earnings greater than $1500 per month” (pg. 54).

The researchers conclude,

We use data from the SIPP to investigate the effects of the 2007 to 2009 increases in the federal minimum wage on the employment and income trajectories of low-skilled workers. We estimate that the minimum wage increases enacted during the Great Recession had negative effects on affected individuals’ employment, income, and income growth. The SIPP data suggest that this period’s minimum wage increases reduced aggregate employment rates by at least half of a percentage point in states that were fully bound by the federal minimum wage’s rise from $5.15 to $7.25 (pg. 67).

Stuff I Say at School – Part VI: Economic Freedom & Corruption

This is part of the Stuff I Say at School series.

The Assignment

Response to a group’s summary of Jakob Svensson’s “Eight Questions About Corruption.”

The Stuff I Said

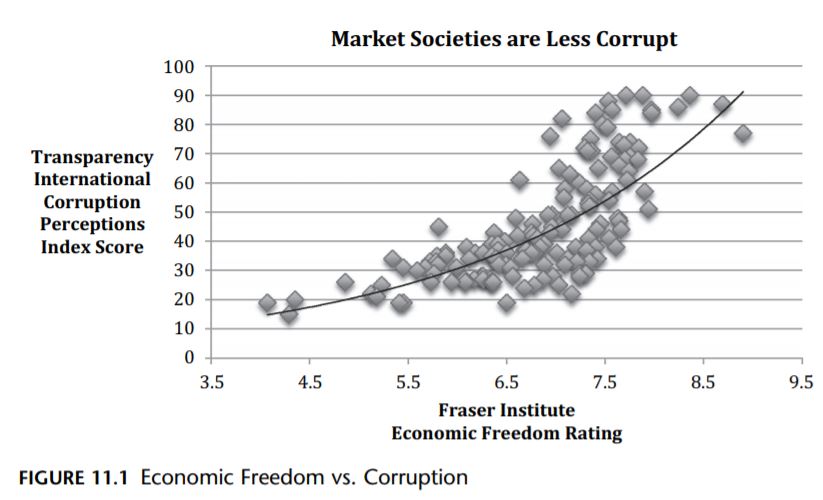
The Fraser Institute’s Economic Freedom of the World (EFW) Index, published in its annual Economic Freedom of the World reports, defines economic freedom based on five major areas: (1) size of the central government, (2) legal system and the security of property rights, (3) stability of the currency, (4) freedom to trade internationally, and (5) regulation of labour, credit, and business. According to its 2018 report (which looks at data from 2016), countries with more economic freedom have substantially higher per-capita incomes, greater economic growth, and lower rates of poverty. Drawing on the EFW Index, Georgetown political philosophers Jason Brennan and Peter Jaworski point to a strong positive correlation between a country’s degree of economic freedom and its lack of public sector corruption.

Granted, a lack of corruption could very well give rise to market reforms and increased economic freedom instead of the other way around. However, recent research on China’s anti-corruption reforms suggests that markets may actually pave the way for anti-corruption reforms. Summarizing the implications of this research, Lin et al. explain,

Reducing corruption creates more value where market reforms are already more fully implemented. If officials, rather than markets, allocate resources, bribes can be essential to grease bureaucratic gears to get anything done. Thus, non-[state owned enterprises’] stocks actually decline in China’s least liberalised provinces – e.g. Tibet and Tsinghai – on news of reduced expected corruption. These very real costs of reducing corruption can stymie reforms, and may explain why anticorruption reforms often have little traction in low-income countries where markets also work poorly. China has shown the world something interesting: prior market reforms clear away the defensible part of opposition to anticorruption reforms.Once market forces are functioning, bribe-soliciting officials become a nuisance rather than tools for getting things done. Eliminating pests is more popular than taking tools away … A virtuous cycle ensues – persistent anticorruption efforts encourage market-oriented behaviour, which makes anticorruption reforms more effective, which further encourages market oriented behaviour.

Interesting enough, there is some evidence that suggests that more government hands in the pies increases corruption. For example, a 2017 study found that larger municipality councils in Sweden result in more corruption problems. A 2009 study found that more government tiers and more public employees lead to more bribery. Finally, a 2015 study showed that high levels of regulation are associated with higher levels of corruption (likely because of regulatory capture).

Do Most Americans Really Want What They Say They Want?

I hear a lot about how “most Americans” are in favor of “Policy XYZ.” The problem is that the social science shows that most Americans don’t know what they’re talking about. Do opinions change with more information or when costs are introduced? Two surveys from the Cato Institute seem to answer this in the affirmative.

The first is on federal paid leave. Seventy-four percent of the 1,700 Americans surveyed “a new federal government program to provide 12 weeks of paid leave to new parents or to people to deal with their own or a family member’s serious medical condition…Support slips and consensus fractures for a federal paid leave program, however, after costs are considered.” A 20 percentage point drop in support occurs when a $200 price tag is attached. Less than half are willing to pay $450 more in taxes for the program. When other potential costs are introduced (e.g., smaller future raises, reduction in other benefits, women less likely to be promoted, cut funding to other government programs), the majority of Americans find themselves opposing the program.

Less than half of men would be willing to pay even $200 more, while 55% of women would still be willing to pay $450 more. Support for the program drops across all political parties as costs are introduced, with 60% of Democrats still willing to fork over $1,200 a year to implement it (but only 22% of Republicans and 45% of Independents). “In sum,” writes Cato researcher Emily Ekins, “Democrats have a much higher tolerance threshold for taxes than the average American.”

Another survey looked at support for the Affordable Care Act’s pre-existing condition regulation. Out of the 2,498 Americans questioned, 65% support this aspect of the ACA. However, when costs are introduced, support drops. Furthermore, wealthier Americans are more willing to entertain trade-offs than lower-income ones.

Thomas Sowell has written, “There are no solutions; there are only trade-offs.” What “most Americans” want depends on whether or not trade-offs are kept in the dark.