More on Trump’s Trade War

I’ve touched on one of these papers before, but NBER Digest has a nice rundown of recent work on Trump’s trade war. One study finds

that the costs of the new tariff structure were largely passed through as increases in U.S. prices, affecting domestic consumers and producers who buy imported goods rather than foreign exporters. The researchers estimate that the tariffs reduced real incomes by about $1.4 billion per month. Due to reduced foreign competition, domestic producer prices also increased. The prices of manufactured goods rose by one percentage point relative to a no-trade-war scenario. The reduction in real incomes represents the welfare cost of higher consumer prices, less the government revenue collected by the tariffs and the additional income of domestic producers who were able to sell their products at higher prices.

This could end up being “especially costly for multinational companies that have made substantial sunk-cost investments in supply chains in other countries, for example by relying on facilities in China or other impacted countries. The study estimates that around $165 billion worth of trade has been rerouted to avoid them.”

Another study

estimate[s] that the new tariff regime reduced U.S. imports by 32 percent, and that retaliatory tariffs from other countries resulted in an 11 percent decline of U.S. exports. They use these responses to estimate import demand and export supply elasticities, and then apply these estimates to calibrate a general equilibrium model of the U.S. economy with detailed input-output linkages. They estimate that higher prices facing U.S. consumers and firms who purchased imported goods generated a welfare loss of $68.8 billion, which was substantially offset by the income gains to U.S. producers who were able to charge higher prices ($61 billion). The researchers estimate the resulting real income decline at about $7.8 billion per year, a value broadly comparable to the net income decline estimated in the previous study. 

What’s more, “The average real wage of workers in tradeable sectors declined by 0.7 percentage points, with a standard deviation of 0.4 percentage points across counties, with workers in the Midwest suffering more than those in other regions.” The protectionist policies also appear to be (of course) political. It turns out that “the U.S. tariffs protected industries that tended to employ workers in the most politically competitive counties. Foreign governments imposed retaliatory tariffs in sectors based in more Republican-leaning counties. The researchers estimate that counties with at least an 85 percent Republican vote share bore losses over 50 percent greater than counties in which the Republican vote share was less than 15 percent.”

Surprise, surprise.

Does Religion Lead to Good Sex?

Drawing on a new IFS study, David French writes in the National Review,

How many happy, sexually vibrant religiousmarried couples have you seen on popular television shows or movies — even in this era of fragmented, targeted entertainment? Now, compare that number (which is very, very close to zero) with the number of times you’ve seen liberation from religion portrayed as the key to sexual fulfillment.

How many times, amid the celebrations of sexuality on college campuses, do you hear the speakers at the various “sex weeks” say something like, “If you really want to improve your odds of enjoying a sexually satisfying life with a faithful partner, you might want to check out church”? Or how many wonkish progressives — the very people most likely to share charts and graphs about the effects of public policies or to pass around the latest social science about race, gender, and gender identity — will dwell on charts such as these, from the invaluable Institute for Family Studies:


He continues:

The global data reflected the U.S. reality. Highly religious couples “enjoy higher-quality relationships and more sexual satisfaction” compared with mixed or entirely secular couples. Moreover, in the global study, religion has an increasingly positive influence on fertility. Religious couples had “0.27 more children than those who never, or practically never, attend.”

Sadly, however, religious practice was “not protective against domestic violence.” There was no statistically significant difference in risk between secular and religious couples.

The IFS study doesn’t just explode progressive cultural stereotypes of unhappy, sexless religious prudes. Conservatives often think of feminists (especially secular feminists) as angry and joyless. But the study indicates otherwise. There was a “J-Curve in overall relationship quality for women.” It turns out that women in “shared secular, progressive relationships enjoy comparatively high levels of relationship quality.” They were surpassed only by “women in highly religious relationships, especially traditionalists.”

Less sex may also be contributing to less happiness. “IFS senior fellow Bradford Wilcox and IFS research fellow Lyman Stone followed Julian’s work by examining whether the sex recession was related to the measurable decline of happiness in America’s young adults. They concluded that “changes in sexual frequency can account for about one-third of the decline in happiness since 2012 and almost 100 percent of the decline in happiness since 2014.”” In short, the sexual revolution has brought about

its own brand of unhappiness, including — ironically enough — sexlessness…Sexual liberation has all too often brought neither sex nor liberation, and thanks to the work of the IFS, we can respond to felt need with real data. Are you seeking love in this life? The church doors are always open, and while matchmaking isn’t its purpose, the connection to a holy God carries with it connection to his flawed people, and in those connections you can find profound joy.

Stuff I Say at School – Part XIII: Political Ignorance and Policy Preferences

This is part of the Stuff I Say at School series.

The Assignment

A critical literature review of political ignorance among the public. This section briefly (though not exhaustively) shows how political knowledge affects political preferences and, therefore, potential policy outcomes.

The Stuff I Said

Somin writes, “Ignorance of the structure of government suggests that voters often not only cannot choose between specific competing policy programs but also cannot easily assign credit and blame for policy outcomes to the right officeholders.” As discussed earlier, Lupia is skeptical of the common measurements of political knowledge, arguing that the ability to recall particulars on a survey is not necessary to achieve “high-value social outcomes.” However, this is an empirical question. The summary of Caplan’s work in a previous section has already shown that economic information and education changes one’s views about economic issues. Summarizing the work of Martin Gilens and Scott Althaus, Brennan demonstrates that political knowledge influences policy preferences. As noted above, high-income is strongly correlated with high degrees of political knowledge. Compared to wealthier Democrats, low-income Democrats “more strongly approved of invading Iraq in 2003. They more strongly favored the Patriot Act, invasions of civil liberty torture, protectionism, and restricting abortion rights and access to birth control. They are less tolerant of homosexuals and more opposed to gay rights.” When demographic factors like race, income, and gender are controlled for, high-information voters “favor overall less government intervention and control of the economy…They are more in favor of free trade and less in favor of protectionism. They are more pro-choice. They favor using tax increases to offset the deficit and debt. They favor less punitive and harsh measures on crime, and are less hawkish on military policy, although they favor other forms of intervention. They are more accepting of affirmative action. They are less supportive of prayer in public schools. They are more supportive of market solutions to health care problems. They are less moralistic in law; they don’t want government to impose morality on the population.”

Relying on a 2017 survey, Oxford economist Max Roser finds “a connection between our perception of the past and our hope for the future.” The numbers suggest “that the degree of optimism about the future differs hugely by the level of people’s knowledge about global development. Those that were most pessimistic about the future tended to have the least basic knowledge on how the world has changed.”

At first blush, this may seem unrelated to policy. However, recent evidence suggests that declinism—a negative view of the state and evolution of society—and nostalgia for a supposedly better past are predictive of populist support.

Even though the data suggest more knowledgeable citizens are more likely to vote, there is also evidence that “more knowledgeable citizens are far more likely to falsely report voting than less knowledgeable ones…People who are knowledgeable and interested in politics but still choose not to vote are more likely to feel guilty for doing so, and therefore less willing to admit their nonvoting to the pollsters. As a result, the voting population is probably significantly closer in knowledge level to the general public than might be supposed.”

While all policy decisions ultimately rely on value judgments (which go beyond the blunt empirics), the evidence in this section suggests that degrees of political knowledge do influence policy preferences. If one is concerned about policy outcomes, one should also be concerned about voter knowledge.

Stuff I Say at School – Part XII: The ‘Why’ of Political Ignorance

This is part of the Stuff I Say at School series.

The Assignment

A critical literature review of political ignorance among the public. This section summarizes the scholarly explanations for the lack of political knowledge among the average citizen.

The Stuff I Said

Image result for the ethics of voting

Though political ignorance is rampant among American citizens, scholars are quick to distinguish between ignorance and stupidity. Despite rising educational attainment and IQ scores, political knowledge among the general public has remained largely stagnant since the 1930s. In fact, Somin determines (in agreement with previous economic theories of democracy) that most political ignorance is rational. Political knowledge is costly in time and effort with little payoff in terms of political influence. At best, an American voter has a 1-in-10 million chance of changing the outcome of a presidential election. This optimistic number occurs only within a few swing states and only if the voter votes for one of the candidates in the two major parties. On average, however, the chance is 1-in-60 million. Numbers improve when it comes to U.S. Congressional elections (1-in-89,000) and state legislator elections (1-in-15,000), but the probability of changing the outcome still remains insanely low. Brennan argues that, from a strictly mathematical standpoint, the disutility of merely driving to the polls (i.e., the probability and cost of getting into an auto accident) is higher than the utility of the vote cast upon arrival. Given these hard data, political ignorance appears to be a rational trade-off. As Somin puts it, “Even a 100 percent altruistic person—someone who always chooses to prioritize the welfare of others over his own whenever the two conflict—would not rationally devote much of his time to acquiring political information for the sake of casting an informed vote. No matter how great the benefits to others of a “correct” electoral outcome, the altruist’s ballot has almost no chance of bringing it about; in a large electorate the change that his vote will be decisive is vanishingly small.”

Caplan’s explanation for voter ignorance extends beyond rational ignorance to what he calls rational irrationality: “Since delusional political beliefs are free, the voter consumes until he reaches his “satiation point,” believing whatever makes him feel best. When a person puts on his voting hat, he does not have to give up practical efficacy in exchange for self-image, because he has no practical efficacy to give up in the first place.” Not only does the acquisition of political knowledge provide a low return on investment, but irrationality can provide self-satisfaction at virtually no cost. This makes the choice to be seemingly irrational when it comes to politics understandable and arguably—if paradoxically—rational.

Image result for the case against education

Caplan elsewhere provides another likely explanation for voter ignorance: poor information retention. Drawing on literature in educational psychology, Caplan finds the “transfer of learning” in our educational systems to be less than impressive. Most students are unable to retain or apply their newfound methodological reasoning outside of the classroom and can usually only do so within the classroom after being instructed to apply a particular principle to their problem-solving. “Telling subjects to use a principle is not transfer,” says psychologist Douglas Detterman. “It is following instructions.” This insight complements the rational ignorance theory by demonstrating the difficult and costly nature of true education. This lack of transfer in learning shows up in various surveys of American adults who typically received public K-12 education:

The American Revolution Center tested 1,001 adult Americans’ knowledge of the American Revolution. Eighty-three percent earned failing grades. The Intercollegiate Studies Institute tested over 2,500 adult Americans’ knowledge of American government and American history. Seventy-one percent earned failing grades. Newsweek magazine gave 1,000 Americans the U.S. Citizenship Test. Thirty-eight percent scored too low to become citizens of their own country. On the 2000 American National Election Study, the typical person got 48% of the factual questions right; you would expect 28% by guessing…How many American adults know the Bill of Rights is part of the Constitution? The American Revolution Center reports a dismal 57%, but the truth is far worse. Since there were only four response options, you would expect roughly 25% of the ignorant to guess the right answer by chance…Not knowing the three branches of government isn’t like not knowing Hamlet; it’s like not knowing the letter “h.” If you don’t know that the Civil War came after the Declaration of Independence, you don’t understand American history. If you don’t know which parties control the House and the Senate, you don’t understand American politics.

Ian Anson of the University of Maryland introduces a more disturbing angle on the persistence of voter ignorance. In a 2018 study, Anson points to what is known as the Dunning-Kruger effect: “[a] widely cited phenomenon in social psychology [that] holds that individuals with low levels of competence will judge themselves to be more competent than they really are, while those with high levels of competence will underestimate their excellence.” This overestimation of one’s abilities and/or knowledge “affect[s] the ability of low achievers to overcome their incompetence because they are unaware that they lag behind others until their objective performance is measured and reported to them.” After surveying two groups (a total of 2,606 American adults) on political knowledge, Anson had participants evaluate their performance after priming them with partisan cues. The results showed that the worst performers (i.e., the most politically ignorant) were more likely to overestimate their performance. What’s worse, this overconfidence was exacerbated by partisanship. “This result is normatively worrying from the perspective of citizens’ ability to self-correct,” writes Anson, “as it may be that rationally ignorant Americans are especially confident that they are better informed than many of their (partisan) peers. The rationally ignorant fail to overcome their ignorance not just because they face steep costs and lack incentives to improve, but because they are unaware that they are relatively ignorant. They become increasingly hardened to the possibility that they are uninformed when partisan identities are activated, a commonplace feature of most contemporary political discussion.” Anson’s findings are bolstered by a recent study, which found that (1) “people choose to hear from those who are politically like-minded on topics that have nothing to do with politics…in preference to those with greater expertise on the topic but have different political views,” (2) “all else being equal, people are more influenced by politically like-minded others on nonpolitical issues,” and (3) “people are biased to believe that others who share their political opinions are better at tasks that have nothing to do with politics, even when they have all information they need to make an accurate assessment about who is the expert in the room.” This partisan selection process lowers the quality of the obtained information, further inflaming voter tendency toward ignorance and misinformation. Most scholars adhere to a theory of rational ignorance among voters: due to the poor incentives provided by a democratic system, most citizens determine that the costs of political knowledge (including the difficulty of making it stick) outweigh its benefits. Furthermore, the poorly informed suffer from “the double burden of incompetence” due to ignorance of their own ignorance, making change unlikely.

Stuff I Say at School – Part XI: The Extent of Political Ignorance

This is part of the Stuff I Say at School series.

The Assignment

A critical literature review of political ignorance among the public. This section specifically explores the academic literature on the extent of political ignorance, demonstrating that Americans know very little when it comes to politics and policy.

The Stuff I Said

What makes this particular skit humorous is how much it reflects reality. According to political scientists Christopher Achens and Larry Bartels, there is a “folk theory” of democracy that is widespread in American culture. This theory paints average citizens as engaged, well-informed participants in the political process, deliberating policies and selecting leaders who represent their well-reasoned preferences. “Unfortunately,” write Achens and Bartels, “while the folk theory of democracy has flourished as an ideal, its credibility has been severely undercut by a growing body of scientific evidence…That evidence demonstrates that the great majority of citizens pay little attention to politics.”

Image result for michael delli carpini and scott keeter

Michael Delli Carpini and Scott Keeter have defined political knowledge as “the range of factual information about politics that is stored in long-term memory.” Most of the surveys on which claims about political knowledge are based consist of recall questions, which “are designed to measure whether or not a person has selected declarative memory.” Drawing on Carpini and Keeter’s work, Achens and Bartels display the ignorance of the typical American on these kinds of questions. For example, in 1952, “only 44% of Americans could name at least one branch of government. In 1972, only 22% knew something about Watergate. In 1985, only 59% knew whether their own state’s governor was a Democrat or a Republican. In 1986, only 49% knew which one nation in the world had used nuclear weapons.” Recent survey evidence continues to support these findings. A 2018 poll found that 67% of Americans cannot name all three branches of government. Another poll found that a sizeable minority (39%) of Americans think or are not sure if low GDP is better for the country than high GDP. The Woodrow Wilson Foundation recently found that only 1-in-3 Americans can pass the U.S. Citizenship Test, with less than half the population of all but one state (Vermont) being able to pass it. A 2014 Barna survey found that 84% of Americans are unaware that extreme poverty worldwide has decreased by more than half in the past three decades. Sixty-seven percent said they thought global poverty was actually increasing during that time. Similarly, a 2016 study found that only 8% of Americans believe extreme global poverty has decreased in the last 20 years. (A 2017 study placed the percentage slightly higher at fifteen.) The late statistician Hans Rosling often tested his audience’s knowledge of the state of the world. Overall, he found that only 5% of Americans could answer a multiple-choice question about global poverty correctly: worse than chimpanzees picking at random. This ignorance not only extends to basic facts about government, politics, and the economy, but to party makeup as well. A 2018 study found that “Republicans, Democrats, and independents, all overestimate the share of party-stereotypical groups in both the major parties.” For example, respondents thought 39.3% of Democrats belonged to a labor union (actual: 10.5%), 38.2% of Republicans earned over $250,000 a year (actual: 2.2%), and 31.7% of Democrats were gay, lesbian, or bisexual (actual: 6.3%).

Image result for against democracy

Georgetown political philosopher Jason Brennan divides the spread of political knowledge into four quartiles: “the top 25 percent of voters are well informed, the next 25 percent are badly informed, the next 25 percent are know-nothings, and bottom 25 percent are systematically misinformed.” According to data from the 1992 American National Election Studies, “93.4 percent of people in the top quartile, but only 13.1 percent of people in the bottom quartile, know that Republicans tend to be more conservative than Democrats. Among people in the lowest knowledge quartile, only 12.2 percent and 9.7 percent knew which party controlled the House of Representatives and Senate, respectively. The bottom 25 percent of citizens does worse than a coin flip when it comes to political knowledge—they are systematically in error.” When it comes to the demographics of these quartiles, political knowledge within the U.S.

is strongly positively correlated with having a college degree, but negatively correlated with having a high school diploma or less. It is positively correlated with being in the top half of income earners, but negatively correlated with being in the bottom half. It is strongly positively correlated with being in the top quarter of income earners, and strongly negatively correlated with being in the bottom quarter. It is positively correlated with living in the western United States, and negatively correlated with living in the South. Political knowledge is positively correlated with being or leaning Republican, but negatively correlated with being a Democrat or leaning independent. It is positively correlated with being between the ages of thirty-five and fifty-four, but negatively correlated with other ages. It is negatively correlated with being black, and strongly negatively correlated with being female.

Image result for democracy and political ignorance

Legal scholar Ilya Somin’s work scours both the academic literature as well as a sweeping array of public surveys, including (but not limited to) the Annenberg Public Policy Center, Kaiser Health Tracking Poll, Pew Research Center, Bloomberg, Public Policy Research Institute, Reason-Rupe, and American National Election Studies. Voter ignorance is not merely in regards to “specific policy issues but about the basic structure of government and how it operates.” He concludes, “Extensive evidence suggests that most Americans have little political knowledge. That ignorance covers knowledge of specific issues, knowledge of political leaders and parties, and knowledge of political institutions. The evidence extends to many of the crucial issues at stake in recent elections from 2000 to 2014. Moreover, much of the widespread ignorance relate to fairly basic issues about the politicians, parties, issues, and the structure of politics.”

Image result for myth of the rational voter

Relying on the 1996 Survey of Americans and Economists on the Economy (SAEE), GMU economist Bryan Caplan compares (1) the average belief of the general public on economic issues, (2) the average belief of Ph.D. economists, and (3) the estimated belief of a category Caplan labels the Enlightened Public. This latter category is the result of Caplan testing for both “self-serving” and “ideological” bias among economists by controlling for family income, job security, race, gender, age, and income growth. The Enlightened Public essentially are the answers to the questions “What would the average person believe if he had a Ph.D. in economics?” or “What would Ph.D. economists believe if their finances and political ideology matched those of the average person?” Caplan discovers that the answers of economists/Enlightened Public differ greatly from the general public on most economic issues. For example, the general public is far more concerned about the supposed negative economic effects of taxes, foreign aid, immigration, business tax breaks, the number of people on welfare, affirmative action, business profits, executive compensation, technology in the workplace, job outsourcing, and corporate downsizing. Caplan’s controls and comparisons indicate that (1) economic information and education changes one’s views about economic issues and (2) the general public is lacking in these qualifications. This gap between economists and the general public is further confirmed by a 2013 study by Paola Sapienza and Luigi Zingales. Drawing on the Economic Expert Panel (EEP) and Financial Trust Index (FTI)—both from the University of Chicago—the researchers find that, “[o]n average, the percentage of agreement with a statement differs 35 percentage points between the two groups.”

Image result for democracy for realists

Despite the strong consensus on the typical American’s political ignorance, Arthur Lupia of the University of Michigan is skeptical of the explanatory power of these survey data. He argues that in many cases, it is “not demonstrate[d] that recalling the items on [the] survey is a necessary condition for achieving high-value social outcomes” and, therefore, not a good standard for measuring relevant political knowledge. He also questions the legitimacy of the American National Election Studies, showing that obviously correct answers were sometimes marked as incorrect due to an overly-rigid grading system. Finally, he notes that “decades of surveys and experiments provide evidence that “don’t know” responses are mixtures of several factors. Ignorance is one such factor. Low motivation, personality, and gender also affect responses.” However, Achens and Bartels point out that “insufficient motivation is endemic to mass politics, not an artifact of opinion surveys[.]” Furthermore, they hold Lupia’s feet to the fire for the vagueness of statements like “high-quality decisions” or “high-value social outcomes.” Uninformed voters are supposedly capable of these things, yet Lupia provides no concrete examples. Brennan also argues that public polls actually overstate how much Americans really know about politics and policy. The first reason is because these polls “usually take the form of a multiple-choice test. When many citizens do not know the answer to a question, they guess. Some of them get lucky, and the surveys mark them as knowledgeable.” These polls “count a citizen as knowledgeable if they know that we spend more on social security than defense, but they typically don’t check if they know how much more we spend.” Finally, these questions are about “easily verifiable facts…While most voting Americans cannot answer such questions, these questions do not require specialized social scientific knowledge.” Unfortunately, greater question complexity is associated with greater ignorance. According to Carpini and Keeter, “as the amount of detail requested increases and as less visible institutions or processes are asked about, the percentage of the public able to correctly answer questions declines.”

In sum, the scholarly consensus appears to recognize that the average American citizen knows very little about the major players, institutions, and processes of their government. What’s more, there is a significant gap between expert views on policy-related issues and that of the average American.

Who Bears the Cost of the Minimum Wage?

Image result for minimum wage

From a forthcoming article in the American Economic Review (quoting from the draft version) on Hungarian minimum wage hikes:

Most firms responded to the minimum wage by raising wages instead of destroying jobs. Our estimates imply that out of 290 thousand minimum wage workers in Hungary, around 30 thousand (0.076% of aggregate employment) lost their job, while the remaining 260 thousand workers experienced a 60% increase in their wages. As a result, firms employing minimum wage workers experienced a large increase in their total labor cost that was mainly absorbed by higher output prices and higher total revenue. We also estimated that firms substituted labor with capital and their profits fell slightly. These results suggest that the incidence of the minimum wage fell mainly on consumers. Given the relatively small effect on employment, our results also suggest that minimum wages can redistribute income from consumers to low-wage workers without large efficiency losses. Our findings also indicate that the optimal level of the minimum wage is likely to vary across industries,cities and countries. In countries where low-wage jobs are concentrated in the local service sector (such as Germany or the U.S.) raising the minimum wage is likely to cause limited disemployment effects or efficiency losses. Moreover, in cities where mainly rich consumers enjoy the services provided by low wage workers this redistribution will be from rich to poor. The heterogenous responses across industries also underline the advantages of sector-specific minimum wage polices used in some European countries such as Italy or Austria. For instance, setting a higher minimum wage in the non-tradable sector than in the tradable sector can push up wages relatively more where it will generate more modest disemployment effects (pg. 23-24).

Passing the costs on to consumers fits with previous evidence. This also makes evident that the kind of industry (e.g., tradable vs. non-tradable) also matters when it comes to positive/negative effects of the minimum wage.

Is Student Loan Forgiveness for the Marginalized?

Image may contain: text

I saw this floating around Facebook recently with the news of Elizabeth Warren’s student loan plan. For those unfamiliar with what Mayfield is referencing, here’s the entry from the HarperCollins Bible Dictionary:

As another Bible dictionary clarifies, “Though Leviticus 25 does not explicitly discuss debt cancellation, the return of an Israelite to his land plus the release of slaves implies the cancellation of debts that led to slavery or the loss of land.”

So does Warren’s plan benefit “the marginalized”?

According to Adam Looney at the Brookings Institution, Warren’s proposal is “regressive, expensive, and full of uncertainties…[T]he top 20 percent of households receive about 27 percent of all annual savings, and the top 40 percent about 66 percent. The bottom 20 percent of borrowers by income get only 4 percent of the savings. Borrowers with advanced degrees represent 27 percent of borrowers, but would claim 37 percent of the annual benefit.”

E Warren Distribution of benefit

He continues,

Debt relief for student loan borrowers, of course, only benefits those who have gone to college, and those who have gone to college generally fare much better in our economy than those who don’t. So any student-loan debt relief proposal needs first to confront a simple question: Why are those who went to college more deserving of aid than those who didn’t? More than 90 percent of children from the highest-income families have attended college by age 22 versus 35 percent from the lowest-income families. Workers with bachelor’s degrees earn about $500,000 more over the course of their careers than individuals with high school diplomas. That’s why about 50 percent of all student debt is owed by borrowers in the top quartile of the income distribution and only 10 percent owed by the bottom 25 percent. Indeed, the majority of all student debt is owed by borrowers with graduate degrees.

Drawing on 2016 data from the Federal Reserve’s Survey of Consumer Finances, Looney’s final analysis

shows that low-income borrowers save about $569 in annual payments under the proposal, compared to $900 in the top 10 percent and $2,653 in the 80th to 90th percentiles. Examining the distribution of benefits, top-quintile households receive about 27 percent of all annual savings, and the top 40 percent about 66 percent. The bottom 20 percent of borrowers by income get 4 percent of the savings…[W]hile households headed by individuals with advanced degrees represent only 27 percent of student borrowers, they would claim 37 percent of the annual savings. White-collar workers claim roughly half of all savings from the proposal. While the Survey of Consumer Finances does not publish detailed occupational classification data, the occupational group receiving the largest average (and total) amount of loan forgiveness is the category that includes lawyers, doctors, engineers, architects, managers, and executives.  Non-working borrowers are, by and large, already insured against having to make payments through income-based repayment or forbearances; most have already suspended their loan payments. While debt relief may improve their future finances or provide peace of mind, it doesn’t offer these borrowers much more relief than that available today.  

The Urban Institute’s analysis has similar findings (though their tone is more optimistic):

figure 2
figure 3

I’m not sure whether or not Warren’s plan is a good one (I’m skeptical, especially given some of the results abroad). But I’m not big on acting like college graduates in a rich country are the marginalized of society.

How and Why to Rate Books and Things

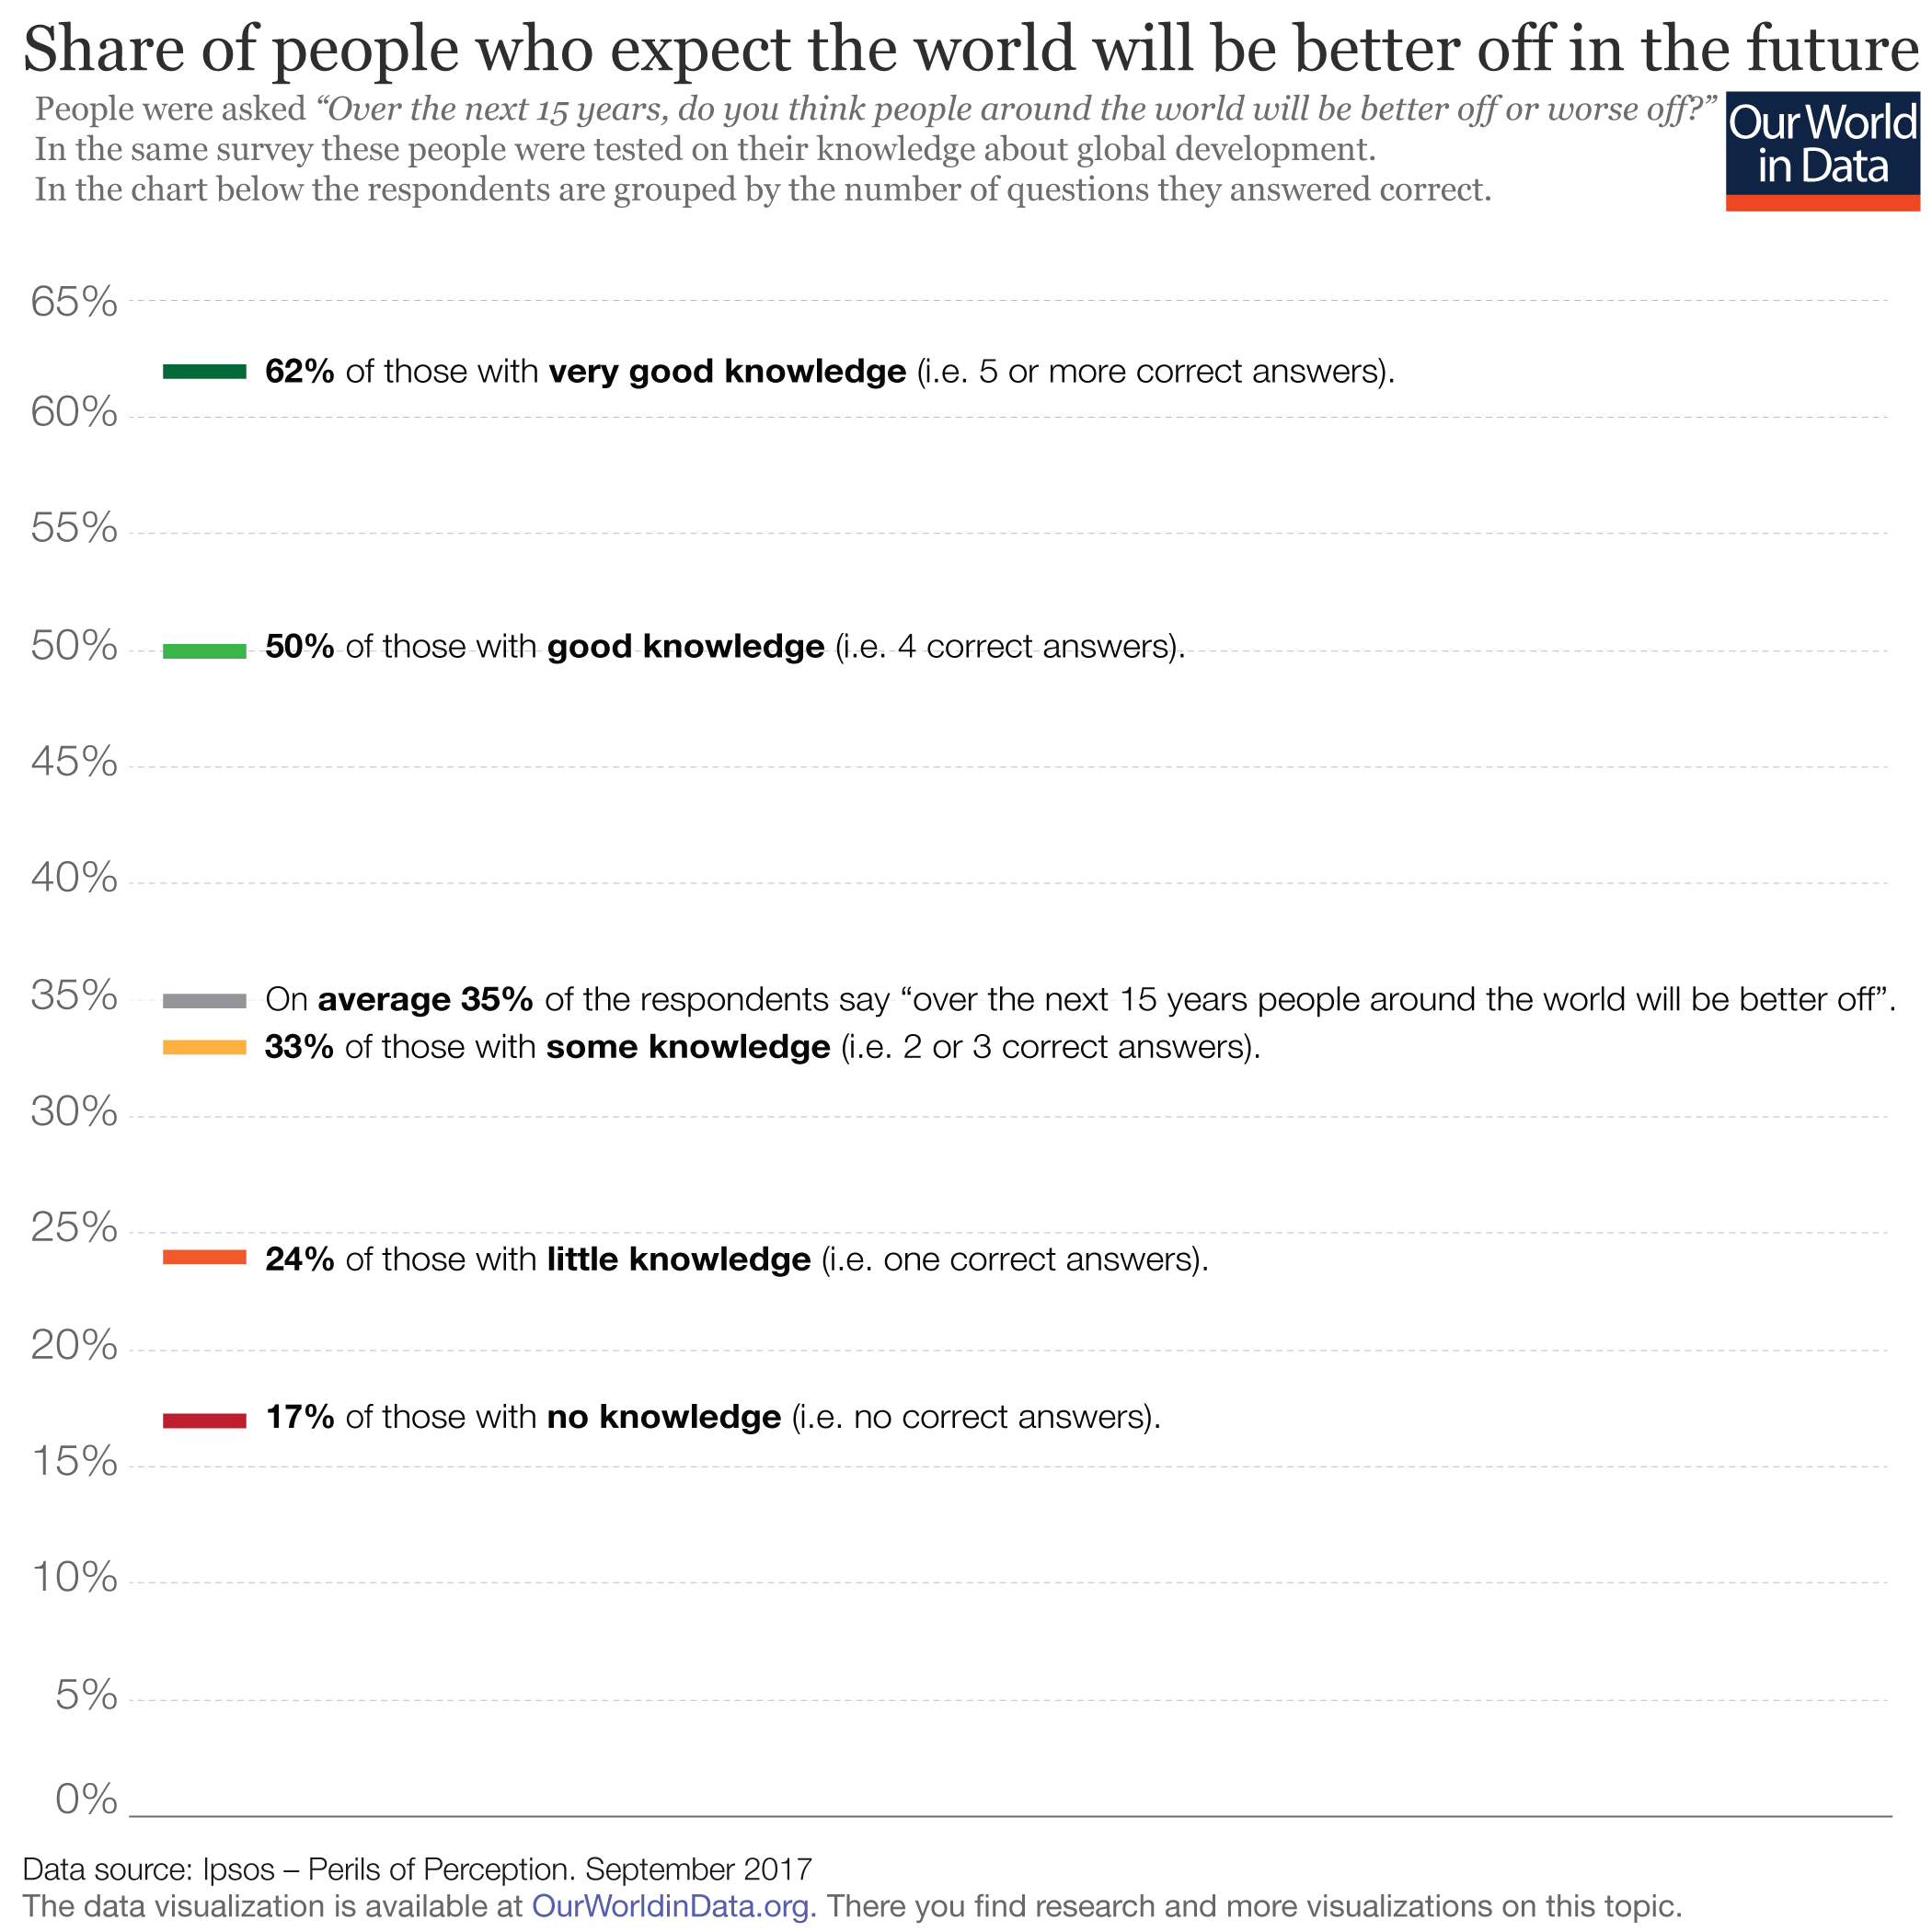
Here’s the image that inspired this post:


Now, there’s an awful lot of political catnip in that post, but I’m actually going to ignore it. So, if you want to hate on Captain Marvel or defend Captain Marvel: this is not the post for you. I want to talk about an apolitical disagreement I have with this perspective.

The underlying idea of this argument is that you should rate a movie based on how good or bad it is in some objective, cosmic sense. Or at least based on something other than how you felt about the movie. In this particular case, you should rate the movie based on some political ideal or in such a way as to promote the common good. Or something. No, you shouldn’t. ALl of these approaches are bad ideas.

That's not how this works

The correct way to rate a movie–or a book, or a restaurant, etc.–is to just give the rating that best reflects how much joy it brought you. That’s it!

Let’s see if I can convince you.

To begin with, I’m not saying that such a thing as objective quality doesn’t exist. I think it probably does. No one can really tell where subjective taste ends and objective quality begins, but I’m pretty sure that “chocolate or vanilla” is a matter of purely personal preference but “gives you food poisoning or does not” is a matter of objective quality.

So I’m not trying to tell you that you should use your subjective reactions because that’s all there is to go on. I think it’s quite possible to watch a movie and think to yourself, “This wasn’t for me because I don’t like period romances (personal taste), but I can recognize that the script, directing, and acting were all excellent (objective quality) so I’m going to give it 5-stars.”

It’s possible. A lot of people even think there’s some ethical obligation to do just that. As though personal preferences and biases were always something to hide and be ashamed of. None of that is true.

The superficial reason I think it’s a bad idea has to do with what I think ratings are for. The purpose of a rating–and by a rating I mean a single, numeric score that you give to a movie or a book, like 8 out of 10 or 5 stars–is to help other people find works that they will enjoy and avoid works that they won’t enjoy. Or, because you can do this, to help people specifically look for works that will challenge them and that they might not like, and maybe pass up a book that will be too familiar. You can do all kinds of things with ratings. But only if the ratings are simple and honest. Only if the ratings encode good data.

The ideal scenario is a bunch of people leaving simple, numeric ratings for a bunch of works. This isn’t Utopia, it’s Goodreads. (Or any of a number of similar sites.) What you can then do is load up your list of works that you’ve liked / disliked / not cared about and find other people out there who have similar tastes. They’ve liked a lot of the books you’ve liked, they’ve disliked a lot of the books you’ve disliked, and they’ve felt meh about a lot of the books you’ve felt meh about. Now, if this person has read a book you haven’t read and they gave it 5-stars: BAM! You’re quite possibly found your next great read.

You can do this manually yourself. In fact, it’s what all of us instinctively do when we start talking to people about movies. We compare notes. If we have a lot in common, we ask that person for recommendation. It’s what we do in face-to-face interactions. When we use big data sets and machine learning algorithms to automate the process, we call them recommender systems. (What I’m describing is the collaborative filtering approach as opposed to content-based filtering, which also has it’s place.)

This matters a lot to me for the simple reason that I don’t like much of what I read. So, it’s kind of a topic that’s near and dear to my heart. 5-star books are rare for me. Most of what I read is probably 3-stars. A lot of it is 1-star or 2-star. In a sea of entertainment, I’m thirsty. I don’t have any show that I enjoy watching right now. I’m reading a few really solid series, but they come out at a rate of 1 or 2 books a year, and I read more like 120 books a year. The promise of really deep collaborative filtering is really appealing if it means I can find is valuable.

But if you try to be a good citizen and rate books based on what you think they’re objective quality is, the whole system breaks down.

Imagine a bunch of sci-fi fans and a bunch of mystery fans that each read a mix of both genres. The sci-fi fans enjoy the sci-fi books better (and the mystery fans enjoy the mystery books more), but they try to be objective in their ratings. The result of this is that the two groups disappear from the data. You can no longer go in and find the group that aligns with your interests and then weight their recommendations more heavily. Instead of having a clear population that gives high marks to the sci-fi stuff and high-marks to the mystery stuff, you just have one, amorphous group that gives high (or maybe medium) marks to everything.

How is this helpful? It is not. Not as much as it could be, anyway.

In theoretical terms, you have to understand that your subjective reaction to a work is complex. It incorporates the objective quality of the work, your subjective taste, and then an entire universe of random chance. Maybe you were angry going into the theater, and so the comedy didn’t work for you the way it would normally have worked. Maybe you just found out you got a raise, and everything was ten times funnier than it might otherwise have been. This is statistical noise, but it’s unbiased noise. This means that it basically goes away if you have a high enough sample.

On the other hand, if you try to fish out the objective components of a work from the stew of subjective and circumstantial components, you’re almost guaranteed to get it wrong. You don’t know yourself very well. You don’t know for yourself where you objective assessment ends and your subjective taste begins. You don’t know for yourself what unconscious factors were at play when you read that book at that time of your life. You can’t disentangle the objective from the subjective, and if you try you’re just going to end up introducing error into the equation that is biased. (In the Captain Marvel example above, you’re explicitly introducing political assessments into your judgment of the movie. That’s silly, regardless of whether your politics make you inclined to like it or hate it.)

What does this all mean? It means that it’s not important to rate things objectively (you can’t, and you’ll just mess it up), but it is helpful to rate thing frequently. The more people we have rating things in a way that can be sorted and organized, the more use everyone can get from those ratings. In this sense, ratings have positive externalities.

Now, some caveats:

Ratings vs. Reviews

A rating (in my terminology, I don’t claim this is the Absolute True Definition) is a single, numeric score. A review is a mini-essay where you get to explain your rating. The review is the place where you should try to disentangle the objective from the subjective. You’ll still fail, of course, but (1) it won’t dirty the data and (2) your failure to be objective can still be interesting and even illuminating. Reviews–the poor man’s version of criticism–is a different beast and it plays by different rules.

So: don’t think hard about your ratings. Just give a number and move on.

Do think hard about your reviews (if you have time!) Make them thoughtful and introspective and personal.

Misuse of the Data

There is a peril to everyone giving simplistic ratings, which is that publishers (movie studios, book publishers, whatever) will be tempted to try and reverse-engineer guaranteed money makers.

Yeah, that’s a problem, but it’s not like they’re not doing that anyway. The reason that movie studios keep making sequels, reboots, and remakes is that they are already over-relying on ratings. But they don’t rely on Goodreads or Rotten Tomatoes. They rely on money.

This is imperfect, too, given the different timing of digital vs. physical media channels, etc. but the point is that adding your honest ratings to Goodreads isn’t going to make traditional publishing any more likely to try and republish last years cult hit. They’re doing to do that anyway, and they already have better data (for their purposes) than you can give them.

Ratings vs. Journalism

My advice applies to entertainment. I’m not saying that you should just rate everything without worrying about objectivity. This should go without saying but, just in case, I said it.

You shouldn’t apply this reasoning to journalism because one vital function of journalism for society is to provide a common pool of facts that everyone can then debate about. One reason our society is so sadly warped and full of hatred is that we’ve lost that kind of journalism.

Of it’s probably impossible to be perfectly objective. The term is meaningless. Human beings do not passively receive input from our senses. Every aspect of learning–from decoding sounds into speech to the way vision works–is an active endeavor that depends on biases and assumptions.

When we say we want journalists to be objective, what we really mean is that (1) we want them to stick to objectively verifiable facts (or at least not do violence to them) and (2) we would like them to embody, insofar as possible, the common biases of the society they’re reporting to. There was a time when we, as Americans, knew that we had certain values in common. I believe that for the most part we still do. We’re suckers for underdogs, we value individualism, we revere hard work, and we are optimistic and energetic. A journalistic establishment that embraces those values is probably one that will serve us well (although I haven’t thought about it that hard, and it still has to follow rule #1 about getting the facts right). That’s bias, but it’s a bias that is positive: a bias towards truth, justice, and the American way.

What we can’t afford, but we unfortunately have to live with, is journalism that takes sides within the boundaries of our society.

Strategic Voting

There are some places other than entertainment where this logic does hold, however, and one of them is voting. One of the problems of American voting is that we go with majority-take-all voting, which is like the horse-and-buggy era of voting technology. Majority-take-all voting is probably much worse for us than a 2-party system, because it encourages strategic voting.

Just like rating Captain Marvel higher or lower because your politics make you want it to succeed or fail, strategic voting is where you vote for the candidate that you think can win rather than the candidate that you actually like the most.

There are alternatives that (mostly) eliminate this problem, the most well-known of which is instant-runoff voting. Instead of voting for just one candidate, you rank the candidates in the order that you prefer them. This means that you can vote for your favorite candidate first even if he or she is a longshot. If they don’t win, no problem. Your vote isn’t thrown away. In essence, it’s automatically moved to your second-favorite candidate. You don’t actually need to have multiple run-off elections. You just vote once with your full list of preferences and then it’s as if you were having a bunch of runoffs.

There are other important reasons why I think it’s better to vote for simple, subjective evaluations of the state of the country instead of trying to figure out who has the best policy choices, but I’ll leave that discussion for another day.

Limitations

The idea of simple, subjective ratings is not a cure-all. As I noted above, it’s not appropriate for all scenarios (like journalism). It’s also not infinitely powerful. The more people you have and the more things they rate (especially when lots of diverse people are rating the same thing), the better. If you have 1,000 people, maybe you can detect who likes what genre. If you have 10,000 people, maybe you can also detect sub-genres. If you have 100,000 people, maybe you can detect sub-genres and other characteristics, like literary style.

But no matter how many people you have, you’re never going to be able to pick up every possible relevant factor in the data because there are too many and we don’t even know what they are. And, even if you could, that still wouldn’t make predictions perfect because people are weird. Our tastes aren’t just a list of items (spaceships: yes, dragons: no). They are interactive. You might really like spaceships in the context of gritty action movies and hate spaceships in your romance movies. And you might be the only person with that tick. (OK, that tick would probably be pretty common, but you can think of others that are less so.)

This is a feature, not a bug. If it were possible to build a perfect recommendation it would also be possible to build (at least in theory) an algorithm to generate optimal content. I can’t think of anything more hideous or dystopian. At least, not as far as artistic content goes.

I’d like a better set of data because I know that there are an awful lot of books out there right now that I would love to read. And I can’t find them. I’d like better guidance.

But I wouldn’t ever want to turn over my reading entirely to a prediction algorithm, no matter how good it is. Or at least, not a deterministic one. I prefer my search algorithms to have some randomness built in, like simulated annealing.

I’d say about 1/3rd of what I read is fiction I expect to like, about 1/3rd is non-fiction I expect to like, and 1/3rd is random stuff. That random stuff is so important. It helps me find stuff that no prediction algorithm could ever help me find.

It also helps the system over all, because it means I’m not trapped in a little clique with other people who are all reading the same books. Reading outside your comfort zone–and rating them–is a way to build bridges between fandom.

So, yeah. This approach is limited. And that’s OK. The solution is to periodically shake things up a bit. So those are my rules: read a lot, rate everything you read as simply and subjectively as you can, and make sure that you’re reading some random stuff every now and then to keep yourself out of a rut and to build bridges to people with different tastes then your own.

Is Contract Enforcement Important for Firm Productivity?

Contract enforcement is a major player in measuring the ease of doing business in a country. A new working paper demonstrates the importance of enforceable contracts to firm productivity:

In Boehm and Oberfield (2018) we study the use of intermediate inputs (materials) by manufacturing plants in India and link the patterns we find to a major institutional failure: the long delays that petitioners face when trying to enforce contracts in a court of justice. India has long struggled with the sluggishness of its judicial system. Since the 1950’s, the Law Commission of India has repeatedly highlighted the enormous backlogs and suggested policies to alleviate the problem, but with little success. Some of these delays make international headlines, such as in 2010, when eight executives were convicted in the first instance for culpability in the 1984 Bhopal gas leak disaster. One of them had already passed away, and the other seven appealed the conviction (Financial Times 2010)

These delays are not only a social problem, but also an economic problem. When enforcement is weak, firms may choose to purchase from suppliers that they trust (relatives, or long-standing business partners), or avoid purchasing the inputs altogether such as by vertically integrating and making the components themselves, or by switching to a different production process. These decisions can be costly. Components that are tailored specifically to the buyer (‘relationship-specific’ intermediate inputs) are more prone to hold-up problems, and are therefore more dependent on formal court enforcement.

…Our results suggest that courts may be important in shaping aggregate productivity. For each state we ask how much aggregate productivity of the manufacturing sector would rise if court congestion were reduced to be in line with the least congested state. On average across states, the boost to productivity is roughly 5%, and the gains for the states with the most congested courts are roughly 10% (Figure 3).

Are Immigrants a Threat?

Image result for immigration

From a new working paper:

The empirical evidence comes down decidedly on the side of immigrants being less likely to commit crimes. A large body of empirical research concludes that immigrants are less likely than similar US natives to commit crimes, and the incarceration rate is lower among the foreign-born than among the native-born (see, for example, Butcher and Piehl 1998a, 1998b, 2007; Hagan and Palloni 1999; Rumbaut et al. 2006). Among men ages 18 to 39—prime ages for engaging in criminal behavior—the incarceration rate among immigrants is one-fourth the rate among US natives (National Academies of Sciences, Engineering, and Medicine 2015).

…There is some evidence that the lower propensity of immigrants to commit crimes does not carry over to immigrants’ children. The US-born children of immigrants—often called the “second generation”— appear to engage in criminal behavior at rates similar to other US natives (Bersani 2014a, 2014b). This 4 “downward assimilation” may be surprising, since the second generation tends to considerably outperform their immigrant parents in terms of education and labor-market outcomes and therefore might be expected to have even lower rates of criminal behavior (National Academies of Sciences, Engineering, and Medicine 2015). Instead, immigrants’ children are much like their peers in terms of criminal behavior. This evidence mirrors findings that the immigrant advantage over US natives in terms of health tends to not carry over to the second generation (e.g., Acevedo-Garcia et al. 2010).

Although immigrants are less likely to commit crimes than similar US natives, they are disproportionately male and relatively young—characteristics associated with crime. Does this difference in demographic composition mean that the average immigrant is more likely than the average US native to commit crimes? Studies comparing immigrants’ and US natives’ criminal behavior and incarceration rates tend to focus on relatively young men, leaving the broader question unanswered. However, indirect evidence is available from looking at the relationship between immigration and crime rates. If the average immigrant is more likely than the average US native to commit crimes, areas with more immigrants should have higher crime rates than areas with fewer immigrants. The evidence here is clear: crime rates are no higher, and are perhaps lower, in areas with more immigrants. An extensive body of research examines how changes in the foreign-born share of the population affect changes in crime rates. Focusing on changes allows researchers to control for unobservable differences across areas. The finding of either a null relationship or a small negative relationship holds in raw comparisons, in studies that control for other variables that could underlie the results from raw comparisons, and in studies that use instrumental variables to identify immigrant inflows that are independent of factors that also affect crime rates, such as underlying economic conditions (see, for example, Butcher and Piehl 1998b; Lee, Martinez, and Rosenfeld 2001; Reid et al. 2005; Graif and Sampson 2009; Ousey and Kubrin 2009; Stowell et al. 2009; Wadsworth 2010; MacDonald, Hipp, and Gill 2013; Adelman et al. 2017). The lack of a positive relationship is generally robust to using different measures of immigration, looking at different types of crimes, and examining different geographic levels.2 Further, the lack of a positive relationship suggests that immigration does not cause US natives to commit more crimes. This might occur if immigration worsens natives’ labor market opportunities, for example.

The few studies that examine crime among unauthorized immigrants have findings that are consistent with the broader pattern among immigrants—namely, unauthorized immigrants are less likely to commit crimes than similar US natives (apart from immigration-related offenses).4 Likewise, studies that examine the link between the estimated number of unauthorized immigrants as a share of an area’s population and crime rates in that area typically find evidence of null or negative effects (pg. 3-5).

Comparatively, the effects of border control on crime is mixed. The authors conclude,

A crucial fact seems to have been forgotten by some policy makers as they have ramped up immigration enforcement over the last two decades: immigrants are less likely to commit crimes than similar US natives. This is not to say that immigrants never commit crimes. But the evidence is clear that they are not more likely to do so than US natives. The comprehensive 2015 National Academies of Sciences, Engineering, and Medicine report on immigration integration concludes that the finding that immigrants are less likely to commit crimes than US natives “seems to apply to all racial and ethnic groups of immigrants, as well as applying over different decades and across varying historical contexts” (328). Unauthorized immigrants may be slightly more likely than legal immigrants to commit crimes, but they are still less likely than their US-born peers to do so. Further, areas with more immigrants tend to have lower rates of violent and property crimes. In the face of such evidence, policies aimed at reducing the number of immigrants, including unauthorized immigrants, seem unlikely to reduce crime and increase public safety (pg. 11).