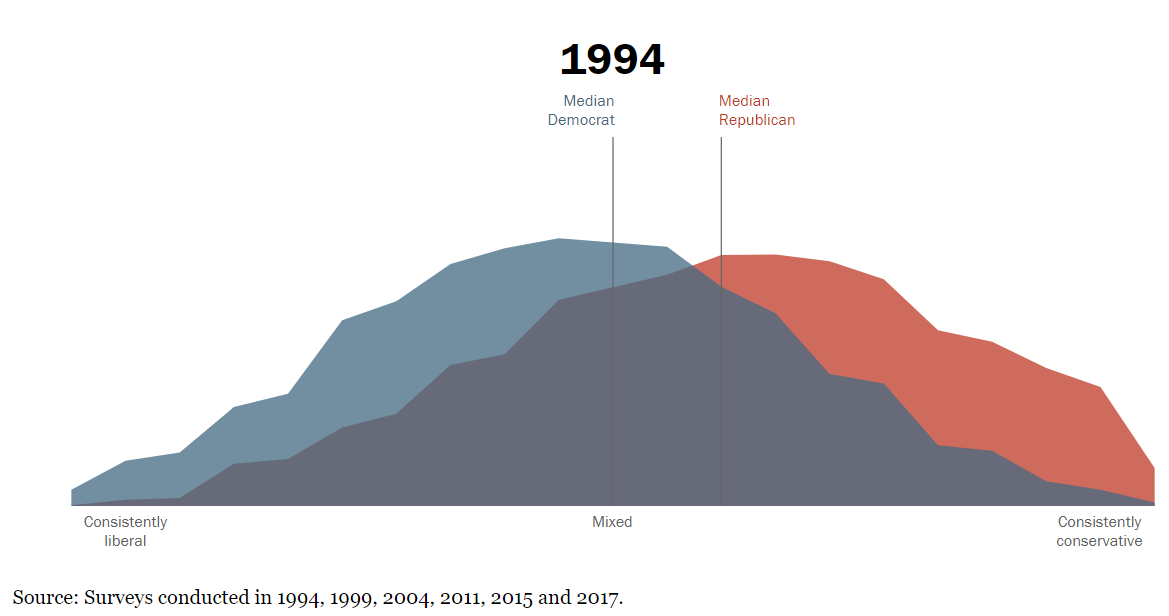
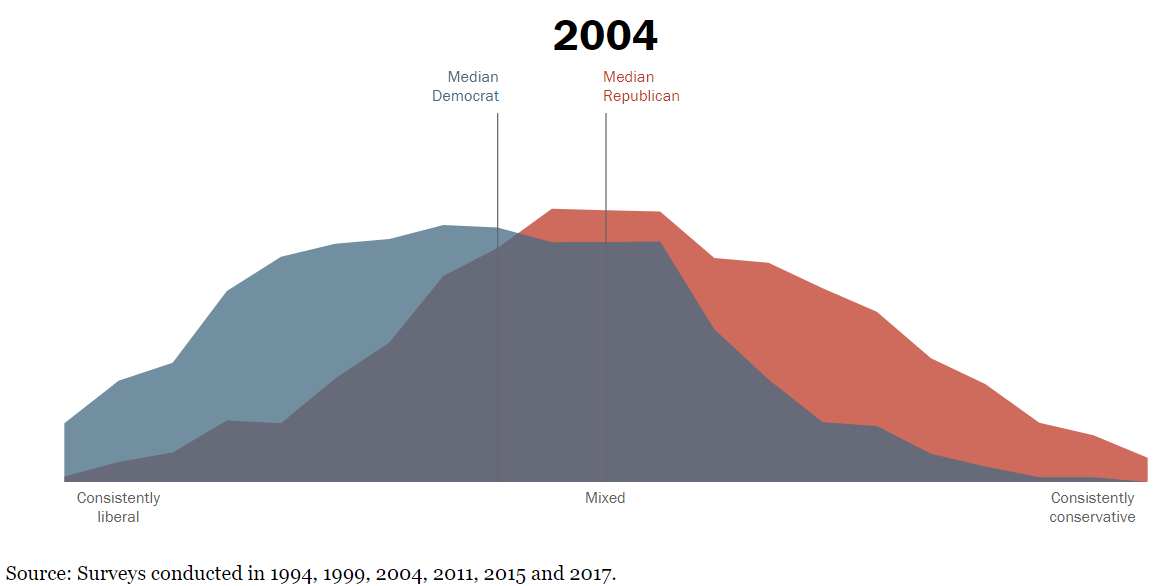
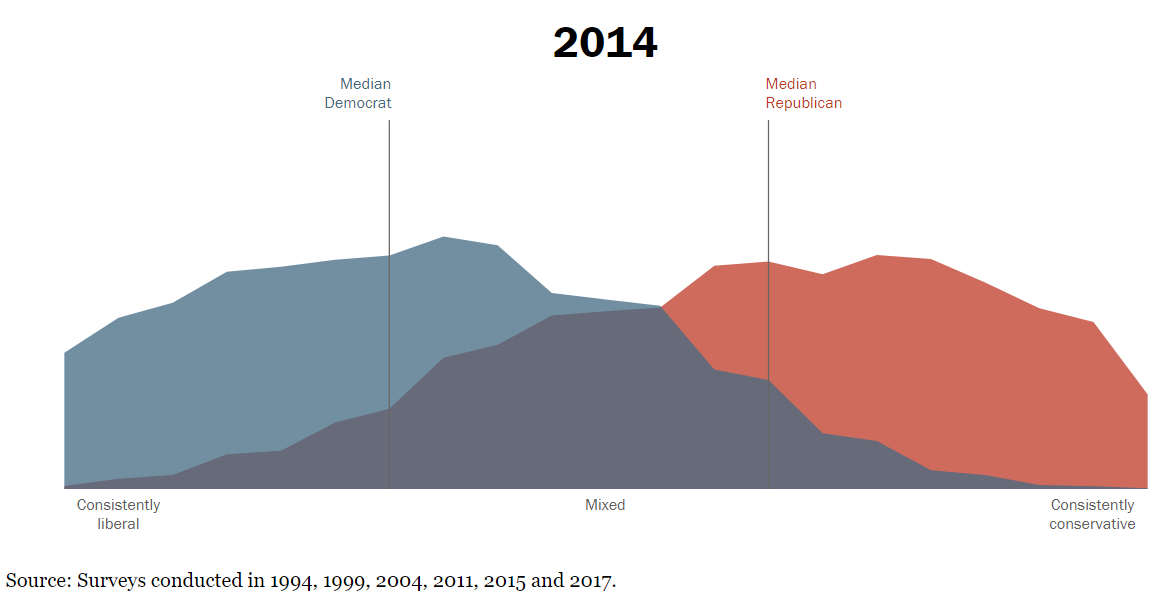
According to Pew Research Center’s surveys, here is how the general public divided along partisan lines in 1994, 2004, 2014, and 2017.

The FB page Unbiased America has a post animating the changes with this summary image:

And with the following description (in part):
A common criticism from both parties has been that the other has become radicalized. Listen to just about any campaign speech and you’ll hear the time-tested demagoguery about how the opposition party is no longer moderate, but instead espouses views from the extreme. So I decided to see whether that’s actually the case.
The Pew Research Center does a poll asking Americans about their beliefs on a variety of issues. When plotted on a graph and then animated to show how ideologies have shifted over time, an eye-opening picture emerges. Since 1994, Republicans are only about 8% more conservative in their beliefs. Democrats, meanwhile, are fully 60% more liberal, with the median Democrat now closer to the far left than the center.
It wasn’t always this way. In 1994, the median Democrat was a centrist, holding views that were 50% traditionally liberal, and 50% traditionally conservative. The median Republican was only about 10% more conservative than the median Democrat.
Since that time, Republicans shifted left, and were the centrist party in 2004, before drifting back to the right. Today they are just slightly more conservative than in 1994.
Democrats, meanwhile, continue to move left, with the biggest surge coming between 2011 and 2017.
It’s interesting to see how everyone seemed to move left from 1994-2004, followed by the Democrats running in that direction and the Republicans walking it back. I wonder if the party with the President in office tends to shift less while the opposition party tends to react. It would be nice to have more timepoints to see (1996, 2000, 2008, 2012). Even if that were the case, though, it doesn’t look like the shifts cancel each other out as the Oval Office goes from one party to another; instead it looks as if the public is getting more polarized over time.
And as a quick aside, I’m not clear on why the Source info includes a survey from 2015 but the data is labeled 2014 instead.
Wow, this brings up so many more questions than answers… How do they identify those two groups? How do they determine what beliefs are where on the spectrum? Where are the independents? What would previous years have looked like? Etc. etc…