Stuff I Say at School – Part VII: The Importance of Institutions

This is part of the Stuff I Say at School series.

Summary & Commentary on Week’s Readings

Acemoglu et al argue that inefficient institutions persist for a number of major reasons. First, the lack of third-party enforcement of commitments prevents elites from relinquishing their monopoly on political power. Furthermore, the beneficiaries of the economic status quo are usually unwilling to risk their economic welfare through competition. This leads them to promote protectionism and further engage in rent-seeking activities. Institutions that encourage these kinds of activities fail to grow. We see this kind of conflict manifest in various areas of the economy, from labor and financial markets to regulations in pricing. The more institutions concentrate political power in the hands of the few, the more incentives are warped and distort paths to economic growth.

Image result for why nations fail

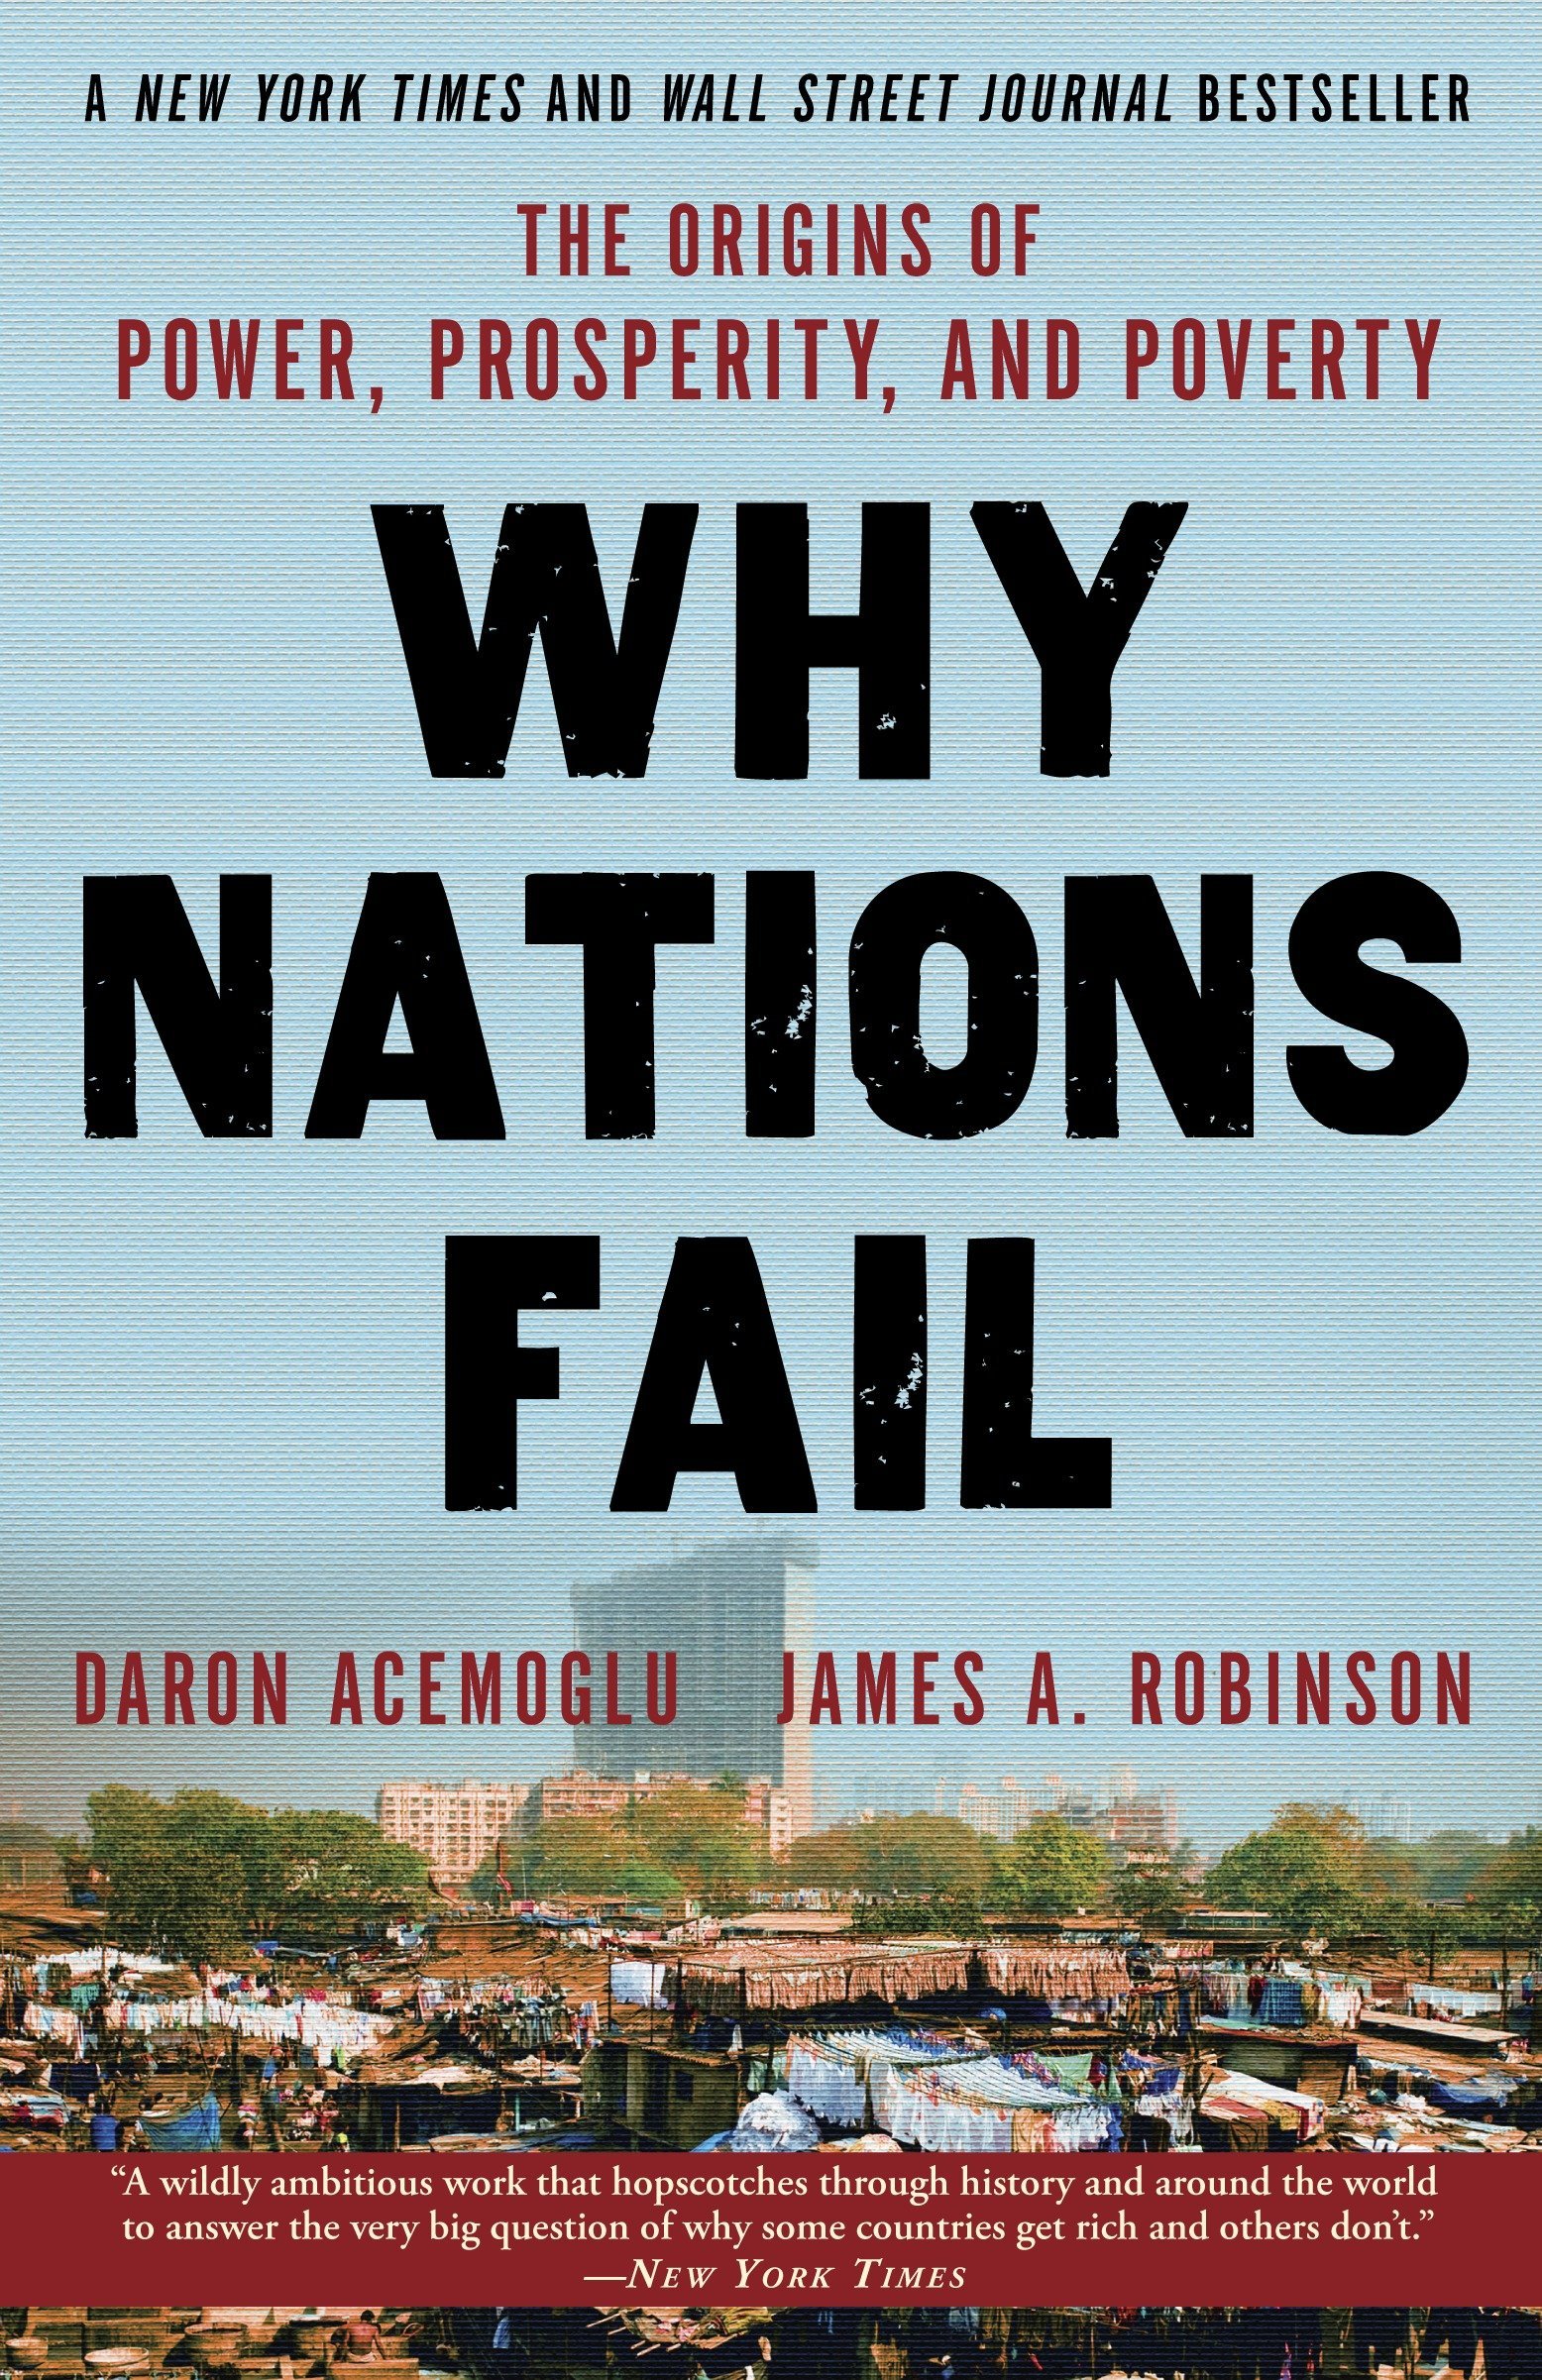
In their book Why Nations Fail: The Origins of Power, Prosperity, and Poverty, Daron Acemoglu and James Robinson distinguish between inclusive and extractive institutions, with the former creating the conditions for prosperity. “Inclusive economic institutions,” they write,

…are those that allow and encourage participants by the great mass of people in economic activities that make best use of their talents and skills and that enable individuals to make the choices they wish. To be inclusive, economic institutions must feature secure private property, an unbiased system of law, and a provision of public services that provides a level playing field in which people can exchange and contract; it also must permit the entry of new business and allow people to choose their careers…Inclusive economic institutions foster economic activity, productivity growth, and economic prosperity (pg. 74-75).

On the other hand, extractive economic institutions lack these properties and instead “extract incomes and wealth from one subset of society to benefit a different subset,” empowering the few at the expense of the many (pg. 76).

The importance of getting institutions right is highlighted by Rodrik and Subramanian’s study. Three theoretical culprits have been blamed for the vast income inequality between countries: (1) geography, (2) integration (globalization, international trade), and (3) institutions. Regression analyses indicate that institutions trump all other explanations. This is also shown from the outset of Acemoglu and Robinson’s Why Nations Fail, in their story of Nogales, Arizona (United States of America) and Nogales, Sonora, (Mexico). Acemoglu and Robinson lay out their archetype story of two towns with the same essential culture, geography, and relative free trade (NAFTA), in most ways they are the same place. The only reason they are two towns is an institutional barrier between two separate countries. Yet one is rich and one is poor because of institutions. The direct effects of geography are weak at best, while there were no direct effects from integration. However, there were indirect effects of integration: institutions have significant, positive effects on integration, while integration has a positive impact on institutions. This, in some sense, creates a virtuous, growth-enhancing cycle. Rodrik and Subramanian point out that the institutional factors emphasized the most have largely been market-oriented (e.g., property rights, enforceable contracts). Yet, factors such as regulation, financial stabilization, and social insurance also matter in getting institutions right.

The interaction between political and economic institutions is an important insight. For example, even though most research finds that seemingly liberal political institutions like democracy have no direct impact on economic growth, more recent evidence from Acemoglu and colleagues suggests that they may in fact contribute to growth. What’s more, the evidence strongly suggests that economic openness—particularly international trade—contributes to growth. A 2010 study used data from 131 developed and developing countries and found that reductions in trade protections led to higher levels of income per capita. A World Bank study found that between 1950 and 1998, “countries that liberalized their trade regimes experienced average annual growth rates that were about 1.5 percentage points higher than before liberalization. Postliberalization investment rates rose 1.5-2.0 percentage points, confirming past findings that liberalization fosters growth in part through its effect on physical capital accumulation…Trade-centered reforms thus have significant effects on economic growth within countries” (pg. 212). A 2016 IMF paper found that trade liberalization boosts productivity through increased competition and greater variety and quality of inputs. All this suggests that Sachs and Warner were correct when they found “that open policies together with other correlated policies were sufficient for growth in excess of 2 percent during 1970-89” (pg. 45; fn. 61). Their findings also suggest “that property rights, freedom, and safety from violence are additional determinants of growth” (pg. 50). Acemoglu and Robinson in a 2005 paper found “robust evidence that property rights institutions have a major influence on long-run economic growth, investment, and financial development, while contracting institutions appear to affect the form of financial intermediation but have a more limited impact on growth, investment, and the total amount of credit in the economy” (pg. 988).

In short, inclusive institutions are necessary to fully reap the benefits of an open economy.

Is Student Loan Forgiveness for the Marginalized?

Image may contain: text

I saw this floating around Facebook recently with the news of Elizabeth Warren’s student loan plan. For those unfamiliar with what Mayfield is referencing, here’s the entry from the HarperCollins Bible Dictionary:

As another Bible dictionary clarifies, “Though Leviticus 25 does not explicitly discuss debt cancellation, the return of an Israelite to his land plus the release of slaves implies the cancellation of debts that led to slavery or the loss of land.”

So does Warren’s plan benefit “the marginalized”?

According to Adam Looney at the Brookings Institution, Warren’s proposal is “regressive, expensive, and full of uncertainties…[T]he top 20 percent of households receive about 27 percent of all annual savings, and the top 40 percent about 66 percent. The bottom 20 percent of borrowers by income get only 4 percent of the savings. Borrowers with advanced degrees represent 27 percent of borrowers, but would claim 37 percent of the annual benefit.”

E Warren Distribution of benefit

He continues,

Debt relief for student loan borrowers, of course, only benefits those who have gone to college, and those who have gone to college generally fare much better in our economy than those who don’t. So any student-loan debt relief proposal needs first to confront a simple question: Why are those who went to college more deserving of aid than those who didn’t? More than 90 percent of children from the highest-income families have attended college by age 22 versus 35 percent from the lowest-income families. Workers with bachelor’s degrees earn about $500,000 more over the course of their careers than individuals with high school diplomas. That’s why about 50 percent of all student debt is owed by borrowers in the top quartile of the income distribution and only 10 percent owed by the bottom 25 percent. Indeed, the majority of all student debt is owed by borrowers with graduate degrees.

Drawing on 2016 data from the Federal Reserve’s Survey of Consumer Finances, Looney’s final analysis

shows that low-income borrowers save about $569 in annual payments under the proposal, compared to $900 in the top 10 percent and $2,653 in the 80th to 90th percentiles. Examining the distribution of benefits, top-quintile households receive about 27 percent of all annual savings, and the top 40 percent about 66 percent. The bottom 20 percent of borrowers by income get 4 percent of the savings…[W]hile households headed by individuals with advanced degrees represent only 27 percent of student borrowers, they would claim 37 percent of the annual savings. White-collar workers claim roughly half of all savings from the proposal. While the Survey of Consumer Finances does not publish detailed occupational classification data, the occupational group receiving the largest average (and total) amount of loan forgiveness is the category that includes lawyers, doctors, engineers, architects, managers, and executives.  Non-working borrowers are, by and large, already insured against having to make payments through income-based repayment or forbearances; most have already suspended their loan payments. While debt relief may improve their future finances or provide peace of mind, it doesn’t offer these borrowers much more relief than that available today.  

The Urban Institute’s analysis has similar findings (though their tone is more optimistic):

figure 2
figure 3

I’m not sure whether or not Warren’s plan is a good one (I’m skeptical, especially given some of the results abroad). But I’m not big on acting like college graduates in a rich country are the marginalized of society.

Does Good Management Produce More Equal Pay?

Nicholas Bloom–whose research on the economics of management I’ve relied on in my own work–and colleagues have an interesting article in Harvard Business Review:

For 2010 and 2015, the U.S. Census Bureau fielded the Management and Organizational Practices Survey (MOPS) in partnership with a research team of subject matter experts, including one of us (Nick), as well as Erik Brynjolfsson and John Van Reenen. The MOPS collects information on the use of management practices related to monitoring (collecting and analyzing data on how the business is performing), targets (setting tough, but achievable, short- and long-term goals), and incentives (rewarding high performers while training, reassigning, or dismissing low performers) at a representative sample of approximately 50,000 U.S. manufacturing plants per survey wave. We refer to practices that are more explicit, formal, frequent, or specific as “more structured practices.” From the MOPS and related data, researchers have demonstrated just how important the use of these structured management practices is for companies and even entire economies, since firms that implement more of these practices tend to perform better.  We wanted to know what effect these management practices have on workers.

We found that companies that reported more structured management practices according to the MOPS paid their employees more equally, as measured by the difference between pay for workers at the 90th (top) and 10th (bottom) percentiles within each firm.

The authors fully admit, “To be honest, it surprised us…If anything, we expected the opposite…We hypothesized that more structured management would lead to rewarding high-performers over others, therefore leading to a rise in inequality inside of the firm. As the chart above shows, the reality is exactly the reverse – and that remains true even after controlling for employment, capital usage, firm age, industry, state, and how educated the employees are.” They continue,

Our research finds that the negative correlation between structured management and inequality is driven by a strong negative correlation between the use of structured monitoring practices and inequality. By contrast, higher usage of structured incentives practices was positively correlated with inequality, albeit weakly. In other words, our finding seems to suggest that companies that collect and analyze specific and high-frequency data about their businesses tend to have a smaller gap between the earnings of workers at the top of the income distribution and the earnings of workers at the bottom of the distribution.

The authors offer several possible explanations:

Previous research shows that firms with more structured management practices are more profitable on average, and there’s long been evidence that when companies make extra profits they share some of them with workers. Perhaps companies with more structured practices allocate these profits such that less well-paid workers get more of the pie.

The relationship could also result from increased efficiency. Maybe firms with more structured practices have more efficient low-paid workers, as a response to training or monitoring practices, and their pay reflects that extra efficiency.

Finally, it could be that firms with more structured practices are more focused on specific tasks and rely more on outsourcing. More and more companies are outsourcing tasks like cleaning, catering, security, and transport. If outsourcing is more common for firms that use more structured practices, workers performing tasks outside of the companies’ core tasks would no longer be on those companies’ direct payrolls. If the jobs that are outsourced are lower-paying than the jobs that are held by employees, the companies’ pay data will become more equal.

Other research finds that paying employees higher wages

  • Motivates employees to work harder.
  • Attracts more capable and productive workers.
  • Lead to lower turnover
  • Enhance quality and customer service
  • Reduce disciplinary problems and absenteeism
  • Require fewer resources for monitoring
  • Reduces poor performance caused by financial anxiety

Looking forward to Bloom et al.’s published work.

How and Why to Rate Books and Things

Here’s the image that inspired this post:


Now, there’s an awful lot of political catnip in that post, but I’m actually going to ignore it. So, if you want to hate on Captain Marvel or defend Captain Marvel: this is not the post for you. I want to talk about an apolitical disagreement I have with this perspective.

The underlying idea of this argument is that you should rate a movie based on how good or bad it is in some objective, cosmic sense. Or at least based on something other than how you felt about the movie. In this particular case, you should rate the movie based on some political ideal or in such a way as to promote the common good. Or something. No, you shouldn’t. ALl of these approaches are bad ideas.

That's not how this works

The correct way to rate a movie–or a book, or a restaurant, etc.–is to just give the rating that best reflects how much joy it brought you. That’s it!

Let’s see if I can convince you.

To begin with, I’m not saying that such a thing as objective quality doesn’t exist. I think it probably does. No one can really tell where subjective taste ends and objective quality begins, but I’m pretty sure that “chocolate or vanilla” is a matter of purely personal preference but “gives you food poisoning or does not” is a matter of objective quality.

So I’m not trying to tell you that you should use your subjective reactions because that’s all there is to go on. I think it’s quite possible to watch a movie and think to yourself, “This wasn’t for me because I don’t like period romances (personal taste), but I can recognize that the script, directing, and acting were all excellent (objective quality) so I’m going to give it 5-stars.”

It’s possible. A lot of people even think there’s some ethical obligation to do just that. As though personal preferences and biases were always something to hide and be ashamed of. None of that is true.

The superficial reason I think it’s a bad idea has to do with what I think ratings are for. The purpose of a rating–and by a rating I mean a single, numeric score that you give to a movie or a book, like 8 out of 10 or 5 stars–is to help other people find works that they will enjoy and avoid works that they won’t enjoy. Or, because you can do this, to help people specifically look for works that will challenge them and that they might not like, and maybe pass up a book that will be too familiar. You can do all kinds of things with ratings. But only if the ratings are simple and honest. Only if the ratings encode good data.

The ideal scenario is a bunch of people leaving simple, numeric ratings for a bunch of works. This isn’t Utopia, it’s Goodreads. (Or any of a number of similar sites.) What you can then do is load up your list of works that you’ve liked / disliked / not cared about and find other people out there who have similar tastes. They’ve liked a lot of the books you’ve liked, they’ve disliked a lot of the books you’ve disliked, and they’ve felt meh about a lot of the books you’ve felt meh about. Now, if this person has read a book you haven’t read and they gave it 5-stars: BAM! You’re quite possibly found your next great read.

You can do this manually yourself. In fact, it’s what all of us instinctively do when we start talking to people about movies. We compare notes. If we have a lot in common, we ask that person for recommendation. It’s what we do in face-to-face interactions. When we use big data sets and machine learning algorithms to automate the process, we call them recommender systems. (What I’m describing is the collaborative filtering approach as opposed to content-based filtering, which also has it’s place.)

This matters a lot to me for the simple reason that I don’t like much of what I read. So, it’s kind of a topic that’s near and dear to my heart. 5-star books are rare for me. Most of what I read is probably 3-stars. A lot of it is 1-star or 2-star. In a sea of entertainment, I’m thirsty. I don’t have any show that I enjoy watching right now. I’m reading a few really solid series, but they come out at a rate of 1 or 2 books a year, and I read more like 120 books a year. The promise of really deep collaborative filtering is really appealing if it means I can find is valuable.

But if you try to be a good citizen and rate books based on what you think they’re objective quality is, the whole system breaks down.

Imagine a bunch of sci-fi fans and a bunch of mystery fans that each read a mix of both genres. The sci-fi fans enjoy the sci-fi books better (and the mystery fans enjoy the mystery books more), but they try to be objective in their ratings. The result of this is that the two groups disappear from the data. You can no longer go in and find the group that aligns with your interests and then weight their recommendations more heavily. Instead of having a clear population that gives high marks to the sci-fi stuff and high-marks to the mystery stuff, you just have one, amorphous group that gives high (or maybe medium) marks to everything.

How is this helpful? It is not. Not as much as it could be, anyway.

In theoretical terms, you have to understand that your subjective reaction to a work is complex. It incorporates the objective quality of the work, your subjective taste, and then an entire universe of random chance. Maybe you were angry going into the theater, and so the comedy didn’t work for you the way it would normally have worked. Maybe you just found out you got a raise, and everything was ten times funnier than it might otherwise have been. This is statistical noise, but it’s unbiased noise. This means that it basically goes away if you have a high enough sample.

On the other hand, if you try to fish out the objective components of a work from the stew of subjective and circumstantial components, you’re almost guaranteed to get it wrong. You don’t know yourself very well. You don’t know for yourself where you objective assessment ends and your subjective taste begins. You don’t know for yourself what unconscious factors were at play when you read that book at that time of your life. You can’t disentangle the objective from the subjective, and if you try you’re just going to end up introducing error into the equation that is biased. (In the Captain Marvel example above, you’re explicitly introducing political assessments into your judgment of the movie. That’s silly, regardless of whether your politics make you inclined to like it or hate it.)

What does this all mean? It means that it’s not important to rate things objectively (you can’t, and you’ll just mess it up), but it is helpful to rate thing frequently. The more people we have rating things in a way that can be sorted and organized, the more use everyone can get from those ratings. In this sense, ratings have positive externalities.

Now, some caveats:

Ratings vs. Reviews

A rating (in my terminology, I don’t claim this is the Absolute True Definition) is a single, numeric score. A review is a mini-essay where you get to explain your rating. The review is the place where you should try to disentangle the objective from the subjective. You’ll still fail, of course, but (1) it won’t dirty the data and (2) your failure to be objective can still be interesting and even illuminating. Reviews–the poor man’s version of criticism–is a different beast and it plays by different rules.

So: don’t think hard about your ratings. Just give a number and move on.

Do think hard about your reviews (if you have time!) Make them thoughtful and introspective and personal.

Misuse of the Data

There is a peril to everyone giving simplistic ratings, which is that publishers (movie studios, book publishers, whatever) will be tempted to try and reverse-engineer guaranteed money makers.

Yeah, that’s a problem, but it’s not like they’re not doing that anyway. The reason that movie studios keep making sequels, reboots, and remakes is that they are already over-relying on ratings. But they don’t rely on Goodreads or Rotten Tomatoes. They rely on money.

This is imperfect, too, given the different timing of digital vs. physical media channels, etc. but the point is that adding your honest ratings to Goodreads isn’t going to make traditional publishing any more likely to try and republish last years cult hit. They’re doing to do that anyway, and they already have better data (for their purposes) than you can give them.

Ratings vs. Journalism

My advice applies to entertainment. I’m not saying that you should just rate everything without worrying about objectivity. This should go without saying but, just in case, I said it.

You shouldn’t apply this reasoning to journalism because one vital function of journalism for society is to provide a common pool of facts that everyone can then debate about. One reason our society is so sadly warped and full of hatred is that we’ve lost that kind of journalism.

Of it’s probably impossible to be perfectly objective. The term is meaningless. Human beings do not passively receive input from our senses. Every aspect of learning–from decoding sounds into speech to the way vision works–is an active endeavor that depends on biases and assumptions.

When we say we want journalists to be objective, what we really mean is that (1) we want them to stick to objectively verifiable facts (or at least not do violence to them) and (2) we would like them to embody, insofar as possible, the common biases of the society they’re reporting to. There was a time when we, as Americans, knew that we had certain values in common. I believe that for the most part we still do. We’re suckers for underdogs, we value individualism, we revere hard work, and we are optimistic and energetic. A journalistic establishment that embraces those values is probably one that will serve us well (although I haven’t thought about it that hard, and it still has to follow rule #1 about getting the facts right). That’s bias, but it’s a bias that is positive: a bias towards truth, justice, and the American way.

What we can’t afford, but we unfortunately have to live with, is journalism that takes sides within the boundaries of our society.

Strategic Voting

There are some places other than entertainment where this logic does hold, however, and one of them is voting. One of the problems of American voting is that we go with majority-take-all voting, which is like the horse-and-buggy era of voting technology. Majority-take-all voting is probably much worse for us than a 2-party system, because it encourages strategic voting.

Just like rating Captain Marvel higher or lower because your politics make you want it to succeed or fail, strategic voting is where you vote for the candidate that you think can win rather than the candidate that you actually like the most.

There are alternatives that (mostly) eliminate this problem, the most well-known of which is instant-runoff voting. Instead of voting for just one candidate, you rank the candidates in the order that you prefer them. This means that you can vote for your favorite candidate first even if he or she is a longshot. If they don’t win, no problem. Your vote isn’t thrown away. In essence, it’s automatically moved to your second-favorite candidate. You don’t actually need to have multiple run-off elections. You just vote once with your full list of preferences and then it’s as if you were having a bunch of runoffs.

There are other important reasons why I think it’s better to vote for simple, subjective evaluations of the state of the country instead of trying to figure out who has the best policy choices, but I’ll leave that discussion for another day.

Limitations

The idea of simple, subjective ratings is not a cure-all. As I noted above, it’s not appropriate for all scenarios (like journalism). It’s also not infinitely powerful. The more people you have and the more things they rate (especially when lots of diverse people are rating the same thing), the better. If you have 1,000 people, maybe you can detect who likes what genre. If you have 10,000 people, maybe you can also detect sub-genres. If you have 100,000 people, maybe you can detect sub-genres and other characteristics, like literary style.

But no matter how many people you have, you’re never going to be able to pick up every possible relevant factor in the data because there are too many and we don’t even know what they are. And, even if you could, that still wouldn’t make predictions perfect because people are weird. Our tastes aren’t just a list of items (spaceships: yes, dragons: no). They are interactive. You might really like spaceships in the context of gritty action movies and hate spaceships in your romance movies. And you might be the only person with that tick. (OK, that tick would probably be pretty common, but you can think of others that are less so.)

This is a feature, not a bug. If it were possible to build a perfect recommendation it would also be possible to build (at least in theory) an algorithm to generate optimal content. I can’t think of anything more hideous or dystopian. At least, not as far as artistic content goes.

I’d like a better set of data because I know that there are an awful lot of books out there right now that I would love to read. And I can’t find them. I’d like better guidance.

But I wouldn’t ever want to turn over my reading entirely to a prediction algorithm, no matter how good it is. Or at least, not a deterministic one. I prefer my search algorithms to have some randomness built in, like simulated annealing.

I’d say about 1/3rd of what I read is fiction I expect to like, about 1/3rd is non-fiction I expect to like, and 1/3rd is random stuff. That random stuff is so important. It helps me find stuff that no prediction algorithm could ever help me find.

It also helps the system over all, because it means I’m not trapped in a little clique with other people who are all reading the same books. Reading outside your comfort zone–and rating them–is a way to build bridges between fandom.

So, yeah. This approach is limited. And that’s OK. The solution is to periodically shake things up a bit. So those are my rules: read a lot, rate everything you read as simply and subjectively as you can, and make sure that you’re reading some random stuff every now and then to keep yourself out of a rut and to build bridges to people with different tastes then your own.
Is Contract Enforcement Important for Firm Productivity?

Contract enforcement is a major player in measuring the ease of doing business in a country. A new working paper demonstrates the importance of enforceable contracts to firm productivity:

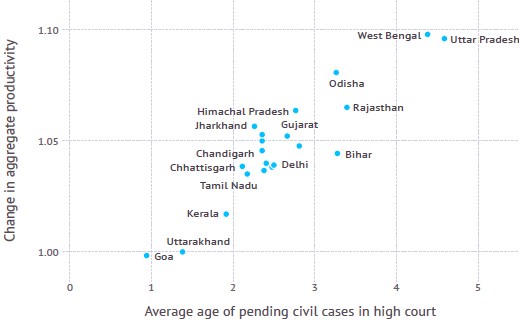
In Boehm and Oberfield (2018) we study the use of intermediate inputs (materials) by manufacturing plants in India and link the patterns we find to a major institutional failure: the long delays that petitioners face when trying to enforce contracts in a court of justice. India has long struggled with the sluggishness of its judicial system. Since the 1950’s, the Law Commission of India has repeatedly highlighted the enormous backlogs and suggested policies to alleviate the problem, but with little success. Some of these delays make international headlines, such as in 2010, when eight executives were convicted in the first instance for culpability in the 1984 Bhopal gas leak disaster. One of them had already passed away, and the other seven appealed the conviction (Financial Times 2010)

These delays are not only a social problem, but also an economic problem. When enforcement is weak, firms may choose to purchase from suppliers that they trust (relatives, or long-standing business partners), or avoid purchasing the inputs altogether such as by vertically integrating and making the components themselves, or by switching to a different production process. These decisions can be costly. Components that are tailored specifically to the buyer (‘relationship-specific’ intermediate inputs) are more prone to hold-up problems, and are therefore more dependent on formal court enforcement.

…Our results suggest that courts may be important in shaping aggregate productivity. For each state we ask how much aggregate productivity of the manufacturing sector would rise if court congestion were reduced to be in line with the least congested state. On average across states, the boost to productivity is roughly 5%, and the gains for the states with the most congested courts are roughly 10% (Figure 3).

Are Immigrants a Threat?

Image result for immigration

From a new working paper:

The empirical evidence comes down decidedly on the side of immigrants being less likely to commit crimes. A large body of empirical research concludes that immigrants are less likely than similar US natives to commit crimes, and the incarceration rate is lower among the foreign-born than among the native-born (see, for example, Butcher and Piehl 1998a, 1998b, 2007; Hagan and Palloni 1999; Rumbaut et al. 2006). Among men ages 18 to 39—prime ages for engaging in criminal behavior—the incarceration rate among immigrants is one-fourth the rate among US natives (National Academies of Sciences, Engineering, and Medicine 2015).

…There is some evidence that the lower propensity of immigrants to commit crimes does not carry over to immigrants’ children. The US-born children of immigrants—often called the “second generation”— appear to engage in criminal behavior at rates similar to other US natives (Bersani 2014a, 2014b). This 4 “downward assimilation” may be surprising, since the second generation tends to considerably outperform their immigrant parents in terms of education and labor-market outcomes and therefore might be expected to have even lower rates of criminal behavior (National Academies of Sciences, Engineering, and Medicine 2015). Instead, immigrants’ children are much like their peers in terms of criminal behavior. This evidence mirrors findings that the immigrant advantage over US natives in terms of health tends to not carry over to the second generation (e.g., Acevedo-Garcia et al. 2010).

Although immigrants are less likely to commit crimes than similar US natives, they are disproportionately male and relatively young—characteristics associated with crime. Does this difference in demographic composition mean that the average immigrant is more likely than the average US native to commit crimes? Studies comparing immigrants’ and US natives’ criminal behavior and incarceration rates tend to focus on relatively young men, leaving the broader question unanswered. However, indirect evidence is available from looking at the relationship between immigration and crime rates. If the average immigrant is more likely than the average US native to commit crimes, areas with more immigrants should have higher crime rates than areas with fewer immigrants. The evidence here is clear: crime rates are no higher, and are perhaps lower, in areas with more immigrants. An extensive body of research examines how changes in the foreign-born share of the population affect changes in crime rates. Focusing on changes allows researchers to control for unobservable differences across areas. The finding of either a null relationship or a small negative relationship holds in raw comparisons, in studies that control for other variables that could underlie the results from raw comparisons, and in studies that use instrumental variables to identify immigrant inflows that are independent of factors that also affect crime rates, such as underlying economic conditions (see, for example, Butcher and Piehl 1998b; Lee, Martinez, and Rosenfeld 2001; Reid et al. 2005; Graif and Sampson 2009; Ousey and Kubrin 2009; Stowell et al. 2009; Wadsworth 2010; MacDonald, Hipp, and Gill 2013; Adelman et al. 2017). The lack of a positive relationship is generally robust to using different measures of immigration, looking at different types of crimes, and examining different geographic levels.2 Further, the lack of a positive relationship suggests that immigration does not cause US natives to commit more crimes. This might occur if immigration worsens natives’ labor market opportunities, for example.

The few studies that examine crime among unauthorized immigrants have findings that are consistent with the broader pattern among immigrants—namely, unauthorized immigrants are less likely to commit crimes than similar US natives (apart from immigration-related offenses).4 Likewise, studies that examine the link between the estimated number of unauthorized immigrants as a share of an area’s population and crime rates in that area typically find evidence of null or negative effects (pg. 3-5).

Comparatively, the effects of border control on crime is mixed. The authors conclude,

A crucial fact seems to have been forgotten by some policy makers as they have ramped up immigration enforcement over the last two decades: immigrants are less likely to commit crimes than similar US natives. This is not to say that immigrants never commit crimes. But the evidence is clear that they are not more likely to do so than US natives. The comprehensive 2015 National Academies of Sciences, Engineering, and Medicine report on immigration integration concludes that the finding that immigrants are less likely to commit crimes than US natives “seems to apply to all racial and ethnic groups of immigrants, as well as applying over different decades and across varying historical contexts” (328). Unauthorized immigrants may be slightly more likely than legal immigrants to commit crimes, but they are still less likely than their US-born peers to do so. Further, areas with more immigrants tend to have lower rates of violent and property crimes. In the face of such evidence, policies aimed at reducing the number of immigrants, including unauthorized immigrants, seem unlikely to reduce crime and increase public safety (pg. 11).

Does Female Autonomy Lead to Long-Term Economic Growth?

From a new study:

A number of development economists have found higher gender inequality to be associated with slower development. Amartya Sen (1990) estimated a large number of ‘missing women’, which resulted in skewed sex ratios, and argued that this has been one of history’s crucial development hurdles. Stephan Klasen, with various co-authors, used macroeconomic regressions to show that gender inequality has usually been associated with lower GDP growth in developing countries during the last few decades (Klasen and Lamanna 2009, Gruen and Klasen 2008). This resulted in development policies targeted specifically at women. In 2005, for example, UN Secretary General Kofi Annan stated that gender equality is a prerequisite for eliminating poverty, reducing infant mortality, and reaching universal education (UN 2005). In recent periods, however, a number of doubts have been made public by development economists. Esther Duflo (2012) suggested that there is no automatic effect of gender equality on poverty reduction, citing a number of studies. The causal direction from poverty to gender inequality might be at least as strong as in the opposite direction, according to this view.

…In a new study, we directly assess the growth effects of female autonomy in a dynamic historical context (Baten and de Pleijt 2018). Given the obviously crucial role of endogeneity issues in this debate, we carefully consider the causal nature of the relationship. More specifically, we exploit relatively exogenous variation of (migration-adjusted) lactose tolerance and pasture suitability as instrumental variables for female autonomy. The idea is that high lactose tolerance increased the demand for dairy farming, whereas similarly, a high share of land suitable for pasture farming allowed more supply. In dairy farming, women traditionally had a strong role, which allowed them to participate substantially in income generation during the late medieval and early modern period (Voigtländer and Voth 2013). In contrast, female participation was limited in grain farming, as it requires substantial upper-body strength (Alesina et al. 2013). Hence, the genetic factor of lactose tolerance and pasture suitability influences long-term differences in gender-specific agricultural specialisation. In instrumental variable regressions, we show that the relationship between female autonomy and human capital is likely to be causal (and also address additional econometric issues, such as the exclusion restriction, using Oster ratios, etc.). 

Age-heaping-based numeracy estimates reflect a crucial component of human capital formation. Recent evidence documents that numerical skills are the ones that matter most for economic growth. Hanushek and Woessmann (2012) argued that maths and science skills were crucial for economic success in the 20th century. They observed that these kinds of skills outperform simple measures of school enrolment in explaining economic development. Hence, in the new study we focus on math-related indicators of basic numeracy. We use two different datasets: first, we use a panel dataset of European countries from 1500 to 1850, which covers a long time horizon; second we study 268 regions in Europe, stretching from the Ural mountains in the east to Spain in the southwest and the UK in the northwest. 

Average age at marriage is used as a proxy for female autonomy. Low age at marriage is usually associated with low female autonomy. Age at marriage is highly correlated with other indicators of female autonomy, such as the share of female household heads or the share of couples in which the wife was older than the husband. Age at marriage is particularly interesting because of the microeconomic channel that runs from labour experience to an increase in women’s human capital. After marriage, women typically dropped out of the labour market, and switched to work in the household economy (Diebolt and Perrin 2013). Consequently, after early marriage women provided less teaching and self-learning encouragement to their children, including numeracy and other skills. Early-married women sometimes also valued these skills less because they did not ‘belong to their sphere’, i.e. these skills did not allow identification (Baten et al. 2017).

What do they find?

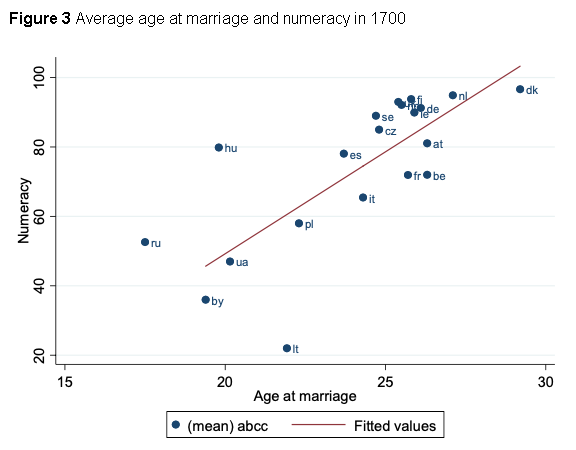
Figure 3 depicts a strong and positive relationship between average age at marriage and numeracy for the two half centuries following 1700 and 1800. Most countries are close to the regression line. Denmark, the Netherlands, Germany, Sweden, and other countries had high values of female autonomy and numeracy – interestingly, many of the countries of the Second Industrial Revolution of the late 19th century, rather than the UK, the first industrial nation. In contrast, Russia, Poland, Slovakia, Italy, Spain, and Ireland had low values in both periods.

In our regression analyses, we include a large number of control variables, such as religion, serfdom, international trade, and political institutions. We find that the relationship between female autonomy and numeracy is very robust.

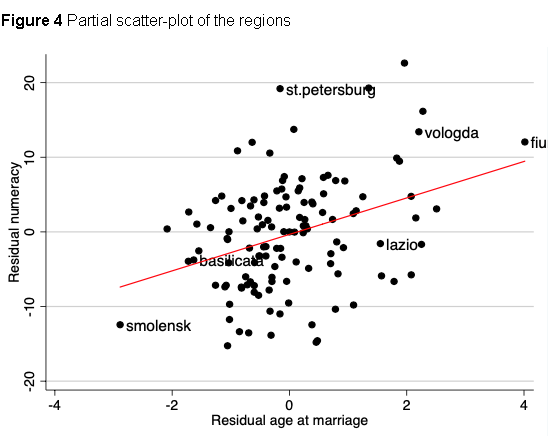
We also study the relationship between female autonomy and human capital formation at the regional level in the 19th century. Numeracy and age at marriage (after controlling for country-fixed effects and other control variables) yield an upward sloping regression line (Figure 4). 

…In sum, the empirical results suggest that economies with more female autonomy became (or remained) superstars in economic development. The female part of the population needed to contribute to overall human capital formation and prosperity, otherwise the competition with other economies was lost. Institutions that excluded women from developing human capital – such as being married early, and hence, often dropping out of independent, skill-demanding economic activities – prevented many economies from being successful in human history.