Last year, Senator Mike Lee launched The Social Capital Project, described as “a multi-year research effort that will investigate the evolving nature, quality, and importance of our associational life. “Associational life” is our shorthand for the web of social relationships through which we pursue joint endeavors—namely, our families, our communities, our workplaces, and our religious congregations. These institutions are critical to forming our character and capacities, providing us with meaning and purpose, and for addressing the many challenges we face.” The initiative has released several reports, whose findings I will highlight below:
- What We Do Together: The State of Associational Life in America
- Between 1975 and 2011, the share of three- and four-year-olds cared for by a parent during the day declined from 80 percent to somewhere between 24 and 48 percent. But parents are spending no less time with their children overall.
- Between 1973 and 2016, the percentage of Americans age 18-64 who lived with a relative declined from 92 percent to 79 percent. The decline was driven by a dramatic 21-point drop in the percentage who were living with a spouse, from 71 percent to 50 percent.
- In 1970, there were 76.5 marriages per 1,000 unmarried women aged 15 and older. As of 2015, that rate had declined by more than half to 32 per thousand.
- In 1970, 56 percent of American families included at least one child, but by 2016 just 42 percent did. The average family with children had 2.3 children in 1970 but just 1.9 in 2016. Among all families—with or without children—the average number of children per family has dropped from 1.3 to 0.8.
- Between 1970 and 2016, the share of children being raised by a single parent (or by neither parent) rose from 15 percent to 31 percent.
- Between 1970 and 2015, births to single mothers rose from 11 percent of all births to 40 percent.
- In the early 1970s, nearly seven in ten adults in America were still members of a church or synagogue. While fewer Americans attended religious service regularly, 50 to 57 percent did so at least once per month. Today, just 55 percent of adults are members of a church or synagogue, while just 42 to 44 percent attend religious service at least monthly.
- In the early 1970s, 98 percent of adults had been raised in a religion, and just 5 percent reported no religious preference. Today, however, the share of adults who report having been raised in a religion is down to 91 percent, and 18 to 22 percent of adults report no religious preference.
- In 1973, two-thirds of adults had “quite a lot” or “a great deal” of confidence in “the church or organized religion,” and in another survey the same year, 36 percent reported “a great deal” of confidence in organized religion. By 2016, those numbers had fallen to 41 percent and 20 percent, respectively.
- Between 1974 and 2016, the percent of adults who said they spend a social evening with a neighbor at least several times a week fell from 30 percent to 19 percent.
- Between 1970 and the early 2010s, the share of families in large metropolitan areas who lived in middle-income neighborhoods declined from 65 percent to 40 percent. Over that same time period the share of families living in poor neighborhoods rose from 19 percent to 30 percent, and those living in affluent neighborhoods rose from 17 percent to 30 percent.
- Between 1972 and 2016, the share of adults who thought most people could be trusted declined from 46 percent to 31 percent. Between 1974 and 2016, the number of Americans expressing a great deal or fair amount of trust in the judgement of the American people “under our democratic system about the issues facing our country” fell from 83 percent to 56 percent.
- Between 1974 and 2015, the share of adults that did any volunteering who reported volunteering for at least 100 hours increased from 28 percent to 34 percent.
- Between 1972 and 2012, the share of the voting-age population that was registered to vote fell from 72 percent to 65 percent, and the trend was similar for the nonpresidential election years of 1974 and 2014. Correspondingly, between 1972 and 2012, voting rates fell from 63 percent to 57 percent (and fell from 1974 to 2014).
- Between 1972 and 2008, the share of people saying they follow “what’s going on in government and public affairs” declined from 36 percent to 26 percent.
- Between 1972 and 2012, the share of Americans who tried to persuade someone else to vote a particular way increased from 32 percent to 40 percent.
- Between the mid-1970s and 2012, the average amount of time Americans between the ages of 25 and 54 spent with their coworkers outside the workplace fell from about two-and-a-half hours to just under one hour.
- The share of workers living and working in different counties was 26 percent in 1970 and 27 percent in the second half of the 2000s, and commuting time has risen only modestly since 1980.
- Between the mid-1970s and 2012, among 25- to 54-year-olds, time at work rose 4 percent. The story was very different for men and women though. Hours at work rose 27 percent among women. Among men, hours at work fell by 9 percent between the mid-1970s and 2012.
- Work has become rarer, in particular, among men with less education. From the mid-1970s to 2012, hours at work fell by just 2 percent among men with a college degree or an advanced degree, compared with 14 percent among those with no more than a high school education.
- Between 1995 and 2015, workers in “alternative work arrangements” (e.g., temp jobs, independent contracting, etc.) grew from 9 percent to 16 percent of the workforce.
- Since 2004, median job tenure has been higher than its 1973 level, indicating that workers are staying in their jobs longer than in the past.
- Between 1970 and 2015, union membership declined from about 27 percent to 11 percent of all wage and salary workers.
- Love, Marriage, and the Baby Carriage: The Rise in Unwed Childbearing
- Nonmarital sexual activity has risen substantially since the mid-twentieth century. The share of teen-age women who are sexually active, for example, is 2.5 times higher today than in the early 1960s. Increasing use of reliable contraception has mitigated the effect on unwed childbearing. Over the same period, the share of women having used contraception the first time they had sex outside marriage more than doubled. But while marital pregnancy rates have fallen in half as a result of the contraceptive revolution, because of higher rates of sexual activity, improper contraceptive use, and the increasing acceptability of unwed childbearing, nonmarital pregnancy rates are over one-third higher than in the early 1960s.
- As for abortion, pregnant women—married or single—are less likely to obtain an abortion than they were before the Roe v. Wade decision. That decline also reflects the declining stigma around unwed childbearing and a drop in unintended pregnancy. Since at least the early 1980s, a rising share of births from nonmarital pregnancies are from pregnancies that were intentional; today, half of births from nonmarital pregnancies are intended.
- Three times as many births today are from unwed pregnancies than in the early 1960s, and only 9 percent of these pregnancies are followed by a shotgun marriage—down from 43 percent in the early 1960s.
- We trace these trends to the rising affluence of the mid-twentieth century, when a greater prioritization of nonmaterial needs (especially among women, who saw greatly expanded opportunities) met a rising ability to fulfill them. The effect of affluence was felt in the discovery of penicillin (which dramatically reduced the incidence of syphilis); the introduction of the pill (which expanded women’s opportunities by allowing them to control their fertility); the development and increasing affordability of labor-saving home appliances, processed food, and paid child care (which gave women the opportunity to work longer hours outside the home, raising the opportunity cost of childbearing); and the nation’s expansion of a safety net for single mothers (facilitating childbearing without marriage among more disadvantaged women). Rising affluence is an undeniably beneficial development that we should not want to reverse, but it has also led to less stable family circumstances for an increasing number of children.
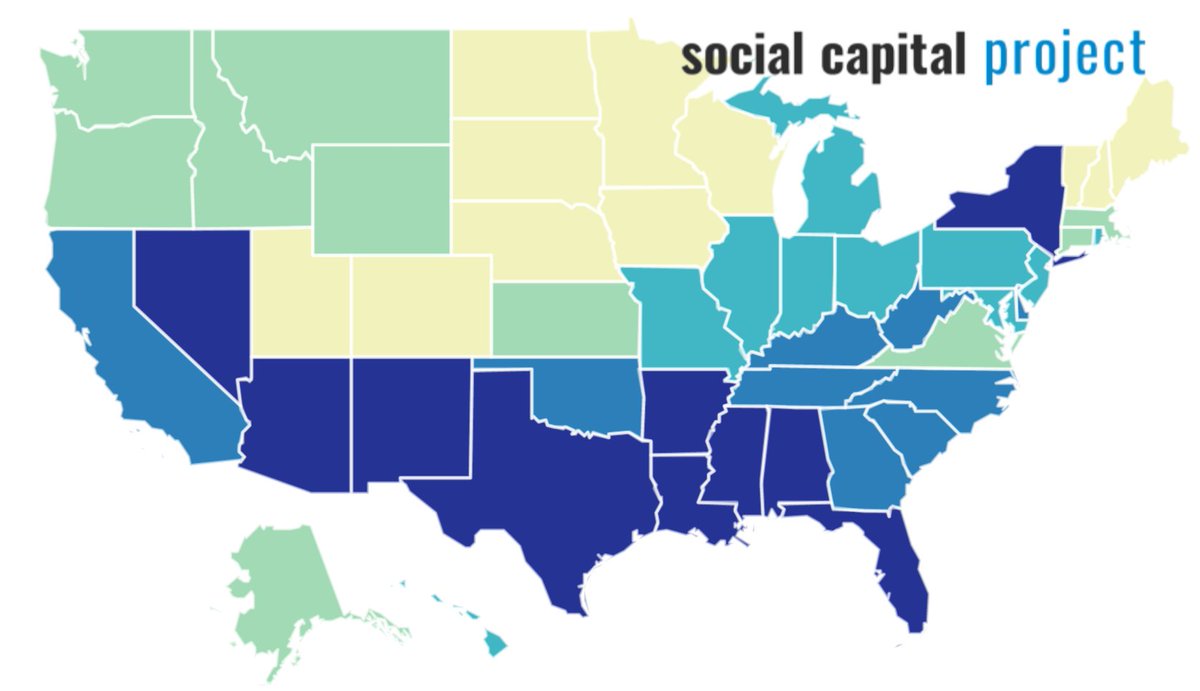
- The Geography of Social Capital in America
- The top fifth of states, in terms of social capital scores, are home to just nine percent of Americans, while 29 percent live in bottom-fifth states.
- We have social capital scores for 2,992 of 3,142 counties, containing 99.7 percent of the American population. Just eight percent of Americans live in the top fifth of these counties, while 39 percent of the population lives in the bottom fifth of counties. Nearly six in ten (59 percent) of Americans live in the bottom two fifths of counties, compared with 24 percent living in the top two fifths.
- The 12 states with the highest social capital scores are distributed across two continuous blocs: nine states running from Utah, through Wyoming and Colorado, across the Dakotas and Nebraska, and over to Iowa, Minnesota, and Wisconsin; and the three Northern New England states of Maine, New Hampshire, and Vermont. These states tend to rank highly across all seven subindices as well. Utah has the highest social capital score, followed by Minnesota and Wisconsin.
- Of the 11 states with the lowest levels of social capital, ten of them fall within a contiguous bloc of states running from Nevada, across the Southwest and South over to Georgia and Florida. New York is the only state in the bottom 11 that is outside this group. Louisiana has the lowest social capital score, followed by Nevada, Arizona, and New Mexico.
- Of the nine states ranked just above this bottom group, seven border and extend the southern bloc, filling out most of the rest of the South. The 17 southern states in the bottom 20 are home to 45 percent of Americans and 74 percent of Americans in bottom-fifth counties. Six in ten (59 percent) of people in the 17 states live in bottom-fifth counties. Only 17 of 1,338 counties in these states are in the top fifth.
- Our indices are not dominated by any single subindex, and our state and county indices appear to be approximating social capital in the same general way.
- Among the component variables underlying the state index, the strongest associations with the index itself across states were for the volunteer rate (0.86), heavy television watching by children (-0.81), the share of adults who made charitable contributions (0.80), the share with emotional and social support (0.80), heavy usage of electronics among children (-0.77), the share of adults that are married (0.75), the share of children living with a single parent (-0.72), and the share of births that were to unwed mothers (-0.71).
- At the county level, the highest correlates of social capital were violent crime (-0.73), the share of children with a single parent (-0.71), the share of adults currently married (0.69), voting rates (0.59), and nonprofits plus congregations (0.57).
- Despite the outsized role that religious communities have played in social capital investment, indicators of religious adherence and commitment were generally weakly (or even negatively) correlated with our social capital scores, both at the state and county levels. This may suggest that social capital organized around religion may be displaced by secular sources of social capital, that the availability of resources provided by secular social capital weakens religious commitment, or that people in distressed places turn to religious communities for the support that is missing in other parts of their lives. This question is a subject for future Social Capital Project research.
- Our social capital indices correlate strongly with earlier social capital indices across states and counties, and with other indices such as the Family Prosperity Institute’s Family Prosperity Index, Opportunity Nation’s Opportunity Index, and the Economic Innovation Group’s Distressed Communities Index.
- We show the correlations of our indices and subindices with 59 state-level and 50 county-level benchmarks reflecting a range of economic, social, demographic, educational, health, and other outcomes.
- Our index is a clear improvement on the Penn State index, based on this benchmarking, but remarkably, Robert Putnam’s state index from Bowling Alone, published nearly two decades ago, has slightly higher benchmark correlations than ours. Because our index captures the health of family life, and because it is based on up-to-date and freely available data (including at the county level), we still prefer it to the Putnam measure. The fact that the correlation between the two state-level indices is 0.81 reassuringly suggests that very different approaches to social capital measurement capture the same essential construct.
Check them out.