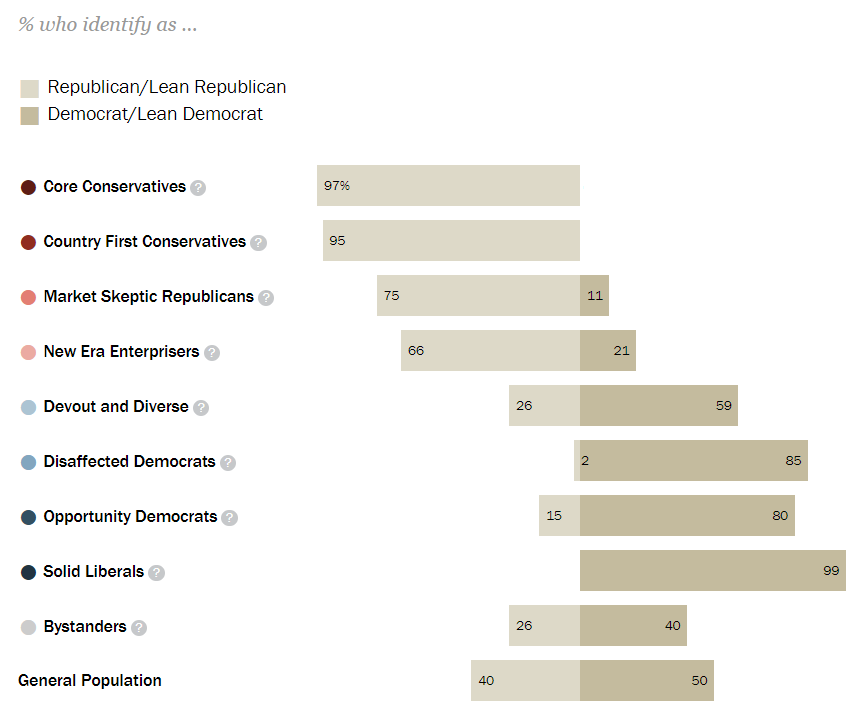
Pew Research published this report last fall, but it surfaced in my newsfeed yesterday when they asked followers to take the Political Typology quiz. Pew categorizes the Right and Left as follows:
Right:
- Core Conservatives: In many ways the most traditional group of Republicans. Overwhelmingly support smaller government and lower corporate taxes, and a majority think U.S. involvement in the global economy is a good thing.
- Country-First Conservatives: Older and less educated than other GOP-leaning typology groups. Unhappy with the nation’s course, highly critical of immigrants and wary of U.S. involvement abroad.
- Market Skeptic Republicans: Stand out from other Republican-oriented groups in their negative views of the economic system. Skeptical of banks and financial institutions, and support raising taxes on corporations.
- New Era Enterprisers: Optimistic about state of the nation and its future. Younger and somewhat less overwhelmingly white than other GOP typology groups. Most say U.S. involvement in the global economy is a good thing and that immigrants strengthen the nation.
Left:
- Solid Liberals: Largest group in the Democratic coalition. Highly educated and largely white. Express liberal attitudes on virtually every issue. Say the nation should be active in world affairs.
- Opportunity Democrats: Less affluent, less liberal and less politically engaged than Solid Liberals, though the two groups agree on many major issues. Believe most people can get ahead if they work hard.
- Disaffected Democrats: Majority-minority group and highly financially stressed. Have positive feelings about the Democratic Party and its leaders, but are highly cynical about politics, government and how things are going in U.S.
- Devout and Diverse: Majority nonwhite, highly financially stressed, religiously observant and older than other Democratic-leaning groups. The most politically mixed typology group, with about a quarter leaning Republican. Take somewhat more conservative views than other Democratic-leaning groups on a number of issues.
And then somewhere in the middle are the Bystanders: A relatively young, less educated group that pays little or no attention to politics.
Here Pew visually represents each groups’ demographics and views on specific issues.
A few notes, in no order:
- Most of the Right is fine with homosexuality, but the County First Conservatives strongly disagree.
- The Right is pretty divided on whether immigrants burden the US.
- The Left is pretty divided on whether government regulation of business is necessary to protect the public.
- The Left is also divided on whether it’s necessary to believe in God to be moral and have good values.
- Disaffected Democrats are confusing. They have “very positive feelings toward the Democratic Party and its leading figures” but are cynical about politics and government. They support “activist government and the social safety net” but also think government is “wasteful and inefficient.”
- Solid Liberals are the whitest group on the Left, at 73%. That’s still less than most of the groups on the Right (85%, 83%, 77%, and 63%), but not by as much as I would have expected.
- In fact in general the actual demographics of both sides are not as different as stereotypes suggest. [ref]All the following are weighted averages. I calculated the % each group makes up of the Left or Right using the numbers in this image. I then multiplied the relevant metric by the group’s percent of the Left or Right (e.g. 22% of Disaffected Democrats are college graduates and they make up 27% of the Left, so 6% of the Left are Disaffected Democrats with college degrees).[/ref]
- 35% of the Left and 25% of the Right are college grads. The biggest driver of that difference is Solid Liberals, with 57% having college degrees. The most educated group on the Right are Core Conservatives at 33%. Outside of those groups, 17% of the Left and 15% of the Right are college grads.
- On average the Right is only 5.2 years older than the Left.
- 37% of the Right and 32% of the Left make $75k or more per year. Those numbers include 49% of Core Conservatives and 48% of Solid Liberals. [ref]I do wonder if this distinction gets starker if we break the wealth down more (for example, if Pew had examined how many people make more than $150k per year or $1M per year, etc.)[/ref]
There’s a whole lot more detail in Pew’s Report here if you want to check it out. (Scroll to the bottom to see there are least 14 pages of the report.)
