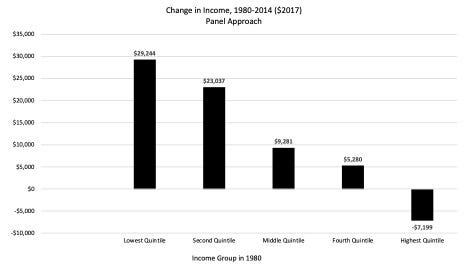
Economist Russ Roberts gives us some insights:
Studies that use panel data — data that is generated from following the same people over time — consistently find that the largest gains over time accrue to the poorest workers and that the richest workers get very little of the gains. This is true in survey data. It is true in data gathered from tax returns.[ref]More panel data can be found in a 2007 Treasury Department report, a 1995 Dallas Fed report, and a 1992 Treasury Department report.[/ref]
Here are some of the studies that find a very different picture of the impact of the American economy on the economic well-being of the poor, middle, and the rich.
This first study, from the Pew Charitable Trusts, conducted by Leonard Lopoo and Thomas DeLeire uses the Panel Study of Income Dynamics (PSID) and compares the family incomes of children to the income of their parents. Parents income is taken from a series of years in the 1960s. Children’s income is taken from a series of years in the early 2000s. As shown in Figure 1, 84% earned more than their parents, corrected for inflation. But 93% of the children in the poorest households, the bottom 20% surpassed their parents. Only 70% of those raised in the top quintile exceeded their parent’s income.
Chetty et al find a similar pattern. In an otherwise gloomy assessment of American progress, they find that 70% of children born in 1980 into the bottom decile exceed their parents’ income in 2014. For those born in the top 10%, only 33% exceed their parents’ income.
The poor may find it easier to do better than their parents. But how much better off do they end up? Julia Isaacs’s study for the Pew Charitable Trusts finds that children raised in the poorest families made the largest gains as adults relative to children born into richer families.
In short, “the children from the poorest families added more to their income than children from the richest families. That reality isn’t consistent with the standard pessimistic story that only the richest Americans have benefited from economic growth over the last 30–40 years.” Another “study looks at people who were 35–40 in 1987 and then looks at how they were doing 20 years later, when they are 55–60. The median income of the people in the top 20% in 1987 ended up 5% lower twenty years later. The people in the middle 20% ended up with median income that was 27% higher. And if you started in the bottom 20%, your income doubled. If you were in the top 1% in 1987, 20 years later, median income was 29% lower.” A recent study found that when you follow quintiles, “[o]nly the people at the top gain much of anything between 1980 and 2014.” However, when you follow people, the same study finds that “the biggest gains go to the poorest people. The richest people in 1980 actually ended up poorer, on average, in 2014. Like the top 20%, the top 1% in 1980 were also poorer on average 34 years later in 2014. The gloomiest picture of the American economy is not accurate. The rich don’t get all the gains. The poor and middle class are not stagnating.”

Roberts concludes,
There’s a lot more to study and understand. But what the studies above show is that the economic growth of the last 30–40 years has been shared much more widely than is generally found in the cross-section studies that compare snapshots at two different times, following quintiles rather than people. No one of these studies is decisive. They each make different assumptions about income…which people to include, how to handle inflation. Together they suggest the glass isn’t as empty as we’ve been led to believe. It’s at least half-full.