A brand new study offers some interesting insights into the question. Kay Hymowitz summarizes,
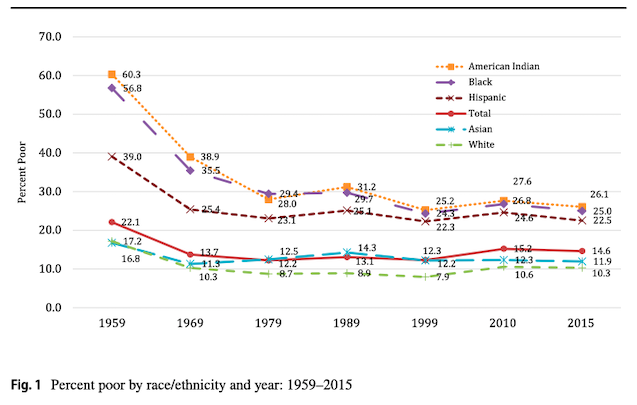
Using Census and ACS data, [John Iceland] shows that whites were the least likely of all groups to be poor throughout the decades studied (though, notably, their poverty rates inched up after 1980.) Although blacks and American Indians have become markedly less poor since 1959, they remain the groups with the highest— and fairly similar—odds of living in poverty. Hispanics never had poverty rates as high as those for American Indians and Blacks in the years studied, but their rates today, at 22.5%, are only marginally lower than those poorer groups (26.1 and 25%, respectively).
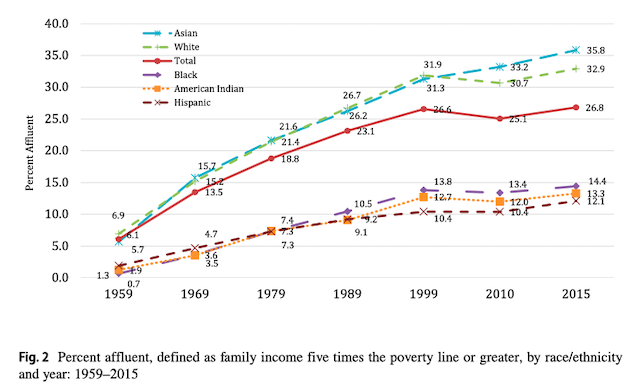
Iceland’s calculations also confirm that we are a much richer nation than we were in 1959. Affluence, defined as family income-to-poverty ratios five times the poverty threshold (or $120,180 as of 2015), has grown for all demographic categories, though at a faster pace for whites and Asians than others. (This “affluence” may strike New Yorkers and renters in other expensive cities as dubious, though the author checked his findings against alternative measures of poverty and affluence; they all showed the same basic trends.)
Despite the massive declines in poverty, what are the main factors behind continuing inequality?
Taking the groups as a whole, he finds immigrant status to be the characteristic that best correlates with poverty, and education the trait most associated with affluence. However, the features most closely related to poverty and affluence differ among groups in fascinating ways. At a time of renewed concerns about racial inequality, the most striking story is for blacks. African Americans are more than three times as likely to be poor than whites without controls. With controls, the gap declines considerably—to 1.71. Iceland estimates that female-headed households can now explain about one-third of the black-white poverty difference, age comes in second at 16%, and education at 15%; all-in-all, the three characteristics can explain two-thirds of the poverty gap between blacks and whites.
Iceland’s findings on trends in minority poverty and affluence are consistent with a narrative of progress in racial relations. In 1959, family structure, education, and age explained less than half of the poverty and affluence gap between blacks and whites, for example; most of the divide was due to “unobservables” like discrimination, neighborhood, and social networks. Iceland confirms earlier research showing black and American Indian poverty plummeting in the 1960s; 57% of African-Americans and 60.3% of Indians started that decade poor. By the 1970s the number was 35.5% and 35.5%. Because the strong economy of the 1960’s lifted all ethnic and racial boats during the 1960s, black, Hispanic, Asian, American Indian, and white, however, the decade ended with inequality between the various groups more or less unchanged. In sum, between civil rights laws and economic growth, minority groups were able to make substantial economic progress in the 1960s, though not enough to catch up with whites.
But as discriminatory barriers fell, individual and family characteristics became more crucial for economic mobility. The author shows that “observables,” including family structure, age, and education, have considerably more explanatory power for poverty and affluence gaps today than they did in 1959, while unobservable factors, like discrimination, though still significant for blacks and American Indians, have nevertheless become less so.
What about other groups?
Education differences have the largest effect on the Hispanic and white poverty gap and that effect has grown over time; age and immigrant status play strong supporting roles. Education has been the prime mover for affluent Hispanics and American Indians; intact families, fewer children, and relocation to metropolitan areas also helped the latter group improve their outcomes.
Asians are the most educated of any group as well as the most stably married. These traits help explain the 35.8% of Asians who are affluent (vs. 32.9% of second-place whites) as well as why, though they have higher poverty rates than whites mostly due to immigration, they are still somewhat “protected” against poverty.
Some limitations and cautions:
It could be that family structure itself is partly a proxy for discrimination. If black men have trouble finding jobs because of prejudice, they are inevitably less “marriageable.” He notes as well that the data available has serious limitations. “Asian” was not a Census category until 1980; before that, people checked the Chinese, Japanese, Filipino, or Hawaiian box. It’s worth noting that Asian remains an awkward grouping, encompassing people of very different histories and cultures; in measuring affluence, Iceland shows, the Vietnamese don’t look at all like other Asians. “Hispanic” is similarly problematic. With controls, Cubans are as likely as whites to be affluent; that’s far from the case with other Hispanic subgroups.