The other day I was working on an article about how Agents of S.H.I.E.L.D. is an awful lot like a reskinned version of Firefly when I realized I should probably check to see if other folks had written about that. They had.
That took the wind out of my sails, so I spent the rest of the evening delving into the site statistics for Difficult Run. I don’t generate any revenue from the site at all, but obviously you want more people to read what you’re writing as opposed to fewer, and I’m just sort of fascinated by the whole idea of publishing: what engages readers and builds an audience? To me, it’s an interesting question. So I always like it when folks like John Scalzi publish about their site statistics (like he did back in 2010 or more recently in January 2014). Also, as a blogger at Times And Seasons, I have access to their site stats as well[ref]I obviously can’t say anything about them ’cause it’s not my place, but I do enjoy having at least one site to compare with.[/ref].
Since I took the time to make some pretty charts and graphs, I thought I may as well write up what I learned and what I”m hoping to see happen for the year of 2014 as far as blog traffic goes.
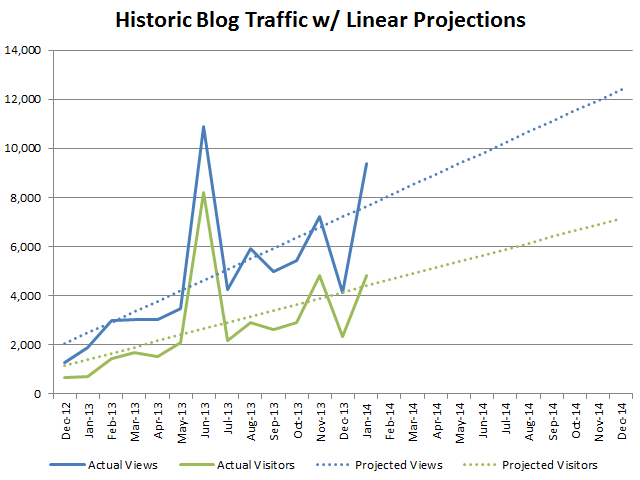
So this is my total monthly traffic for every complete month that I’ve had the site running[ref]All stats come from the Jetpack plugin for WordPress. I also have Google Analytics running, but Jetpack is easier to get to so that’s what I used this time.[/ref]. (I launched it during the month of November 2012.) You can see a general upward trend (which is nice), along with a really big spike in June 2013 and a really low dip in December 2014. The spike is from the post Health Insurance vs. Food Insurance which got posted on Reddit and drew over 5,000 views in one day. The dip is because December 2014 was insane: there were holidays, I was moving my family, and I had some ridiculous projects at work. It was a truly awful month, and I basically stopped blogging. Those two months are pretty clearly outliers, I think, but the question is whether or not January 2014 is also an outlier. That’s the month my mum poster her article on whether or not Mormon women ought to receive the priesthood, and it became the second most popular post on the site. I’m inclined to think it’s not an outlier, but I’ll get to that later.
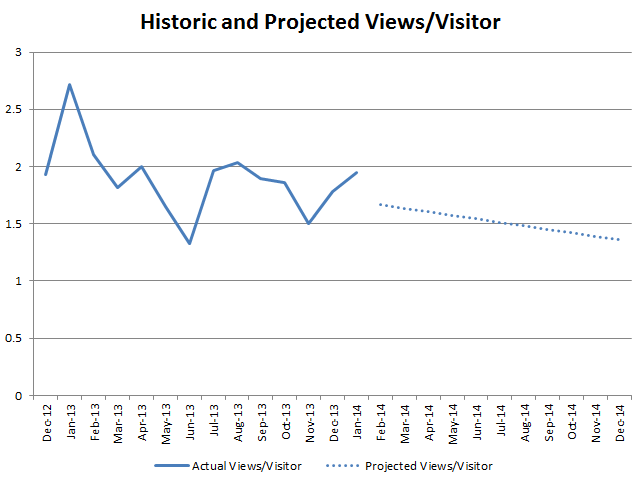
I also did some really basic linear projections to get a ball-park idea of what kind of traffic I can expect to get by the end of 2014. As you can see, it looks like I’d be getting about 12,000 views / month or about 7,000 visitors / month. More on that in a moment as well, but for now I thought it was interesting that the projections were diverging. That shows that ratio of views / visitor (e.g. how many pages a given visitor looks at) is changing. So I took a look at that as well.
The overall trend is negative, which means that as time goes on my audience reads fewer articles per person. I think that’s probably a natural function of my audience moving outside of the core friends and family who came to see what I had to say early on and towards strangers who come across the site because an article gets linked here of there.[ref]I don’t actually know if that is the kind of thing that happens with new blogs. If anyone reading this is an expert, feel free to weigh in.[/ref]
Tracking both visitors and views seemed a bit messy, so at this point I decided to pick just one metric to concentrate on. I think views is the standard (probably mostly because it’s easier to track), but I decided that I would just check out the variability of the two and pick whichever one was the most stable. I picked the coefficient of variation rather than variance because it’s dimensionless, and views (0.55) was a lot less volatile than visitors (0.70), so from here on out I just look at views instead of visitors.
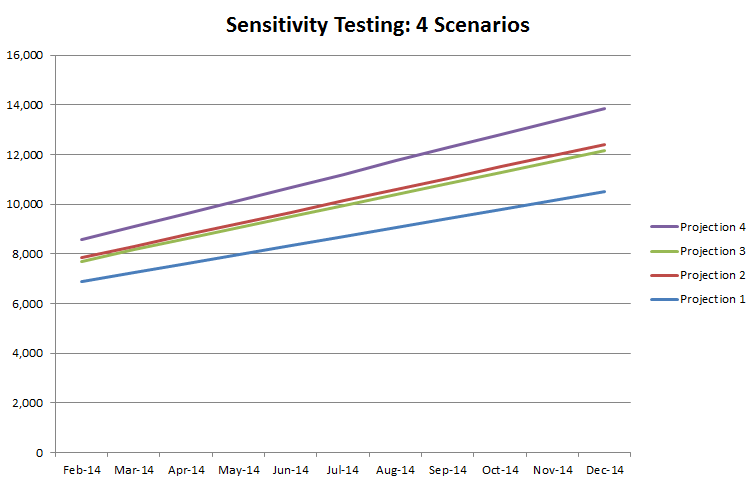
So what I did in this chart was look at the impact of different scenarios on future growth. Here are the scenarios:
- Scenario 1 – I took out the two highest months (June 2013 and January 2014) and left everything else in. This is the most pessimistic scenario.
- Scenario 2 – I took out the two highest months (June 2013 and January 2014) and also took out the unusually low month (December 2013).
- Scenario 3 – I took out the highest month (June 2013).
- Scenario 4 – I took out the highest month (June 2013) and also the unusually low month (December 2013)
The first scenario, where I took out the two highest months but left everything else in, was unsurprisingly the most pessimistic. According to that scenario, the blog would just cross 10,000 monthly views by the end of this year. The second and third scenarios ended up being very similar, and both predict around 12,000 monthly views by the end of this year. Finally, the fourth scenario is the most optimistic and would predict almost 14,000 monthly views by the end of the year.
Up to now, however, I’ve assumed linear growth. That means that I add the same number of new views every month (usually in the range of 400 – 500 in these models). When you’re talking about populations, however, everything from birth rates to disease growth to adoption of new technologies usually follows exponential growth [ref]This is during the early phases when nothing is restricting growth. If you have a population that requires resources, or something, the logistic population model is probably your best bet. That’s my favorite one.[/ref]. With an exponential model you’re not adding the same number of views every month, but instead your adding the same percentage of views every month. (So it works just like compound interest.)
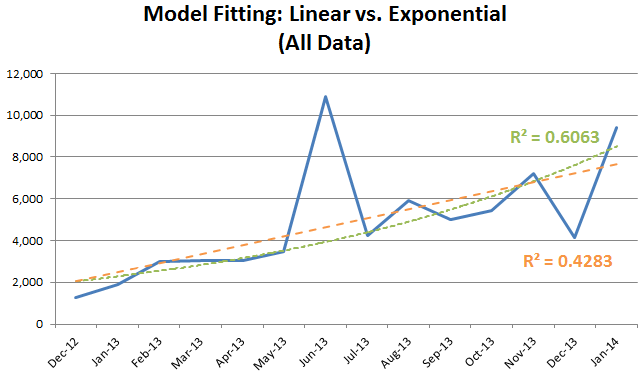
So, which model fits the data best? So far, does my model look more linear or more exponential?
Without getting into the technical details, the R-squared value is a measure of how good your model fits the data. In this case I used all the data (no throwing out outliers) and compared it with a linear model and an exponential model. The linear model got 0.4283 (which roughly means it explains 43% of the variance in the data) and the exponential model got 0.6063 (so it explains about 61% of the variation in the data). Based on this: the data looks exponential. That’s good news if you’re me, because an exponential model is going to yield a lot more growth down the road. But there’s a caveat: when I started taking out outliers, the difference between the exponential and linear models all but disappeared. With just a couple of those outliers gone, the r-squared values were above 0.9 for each. Even though the exponential model always did better, the advantage is tiny once you throw out a couple of outliers.
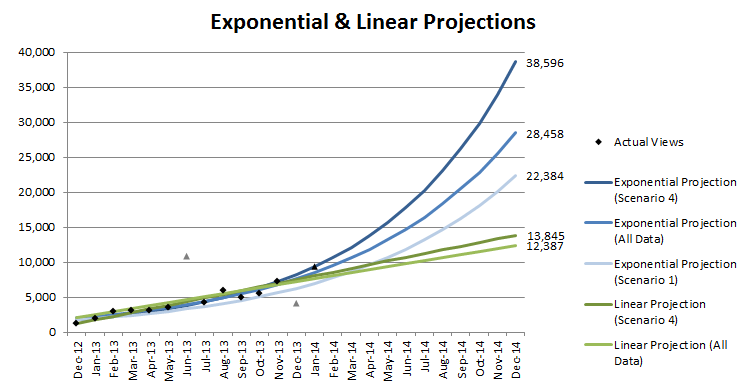
Still, what would growth look like based on an exponential model? This chart–the last of the bunch–shows the original data, some linear projects, and some exponential projections all at once so you can get an idea of the possibilities.
So this chart shows the actual data points (as points) along with two linear projections and three exponential projections. You can tell that up through the data that I have so far, it’s pretty hard to tell the two apart. But by the end of the year, the difference really matters. The lowest exponential projection has about 22,000 monthly views by December 2014, and the highest linear projection has less than 14,000. The optimistic exponential projection has close to 40,000 monthly views by year’s end!
So here’s the fun part: which do I think it’s going to be? I think that the exponential model is the best model of growth in general, but with one big caveat. It assumes that the underlying reason for the growth is constant. For example, you only get the joy (or suffering, depending on which side of the coin you’re on) of compounding interest if the interest rate stays the same. Difficult Run doesn’t have an interest rate. It has content. And so my guess is that we’ll continue to see exponential growth if the quality and quantity of the posts keep up with reader expectations. The posts have gotten better, the site layout has gotten better, and I’ve recruited some good editors and guest posters. All of those efforts have to continue, but if they do then I think when I look back with the 2014 data all in a spreadsheet, the growth will look exponential rather than linear.
And, just for fun, I’ll make a specific prediction: I expect to see 25,000 monthly views by the end of January 2015. That doesn’t mean there will be 25,000 views in that month. There could be more or less, but we’ll be in that range. Which sounds pretty awesome, until I realize that that would still be about 4% of the monthly traffic that John Scalzi averaged through 2013.
By an interesting coincidence (since we also corresponded for the first time yesterday) I had looked at my site stats and those of The Orthosphere yesterday, and my skeptical impression is that the underlying trend is that the blogs have peaked, plateaued and are declining over the past six months or so.
I get 50-plus thousand views per month, but a large (and continually increasing) proportion is simply due to having a mass of old, past posts, many of which attracts a few views a day (and some of which are steady contributors). In terms of genuine growth of frequent blog viewers, an ‘audience’, plateau means decline.
(The shark must keep moving forward or it dies! – or in the case of a blog becomes moribund.)
I have zero interest in promoting my blog, or making money from it – indeed sheer idleness prevents my even classifying blog posts by theme, and I don’t do topical stuff and very rarely link – but blog views grew pretty steadily for over three years, and I felt that was a sign of health.
Consequently – since I maintain daily posting – I regard the current situation as evidence of decline; and the similar state (at a lower level of views) at the Orthosphere suggests it may be a decline in the audience (that audience being mostly Mere Christian traditionalists including Mormons, but with quite a few seculars).
I believe that the potenital audience of tradititionalist (anti politically correct) Christian intellectuals is in fact very small, and dwindling – and that they are also fragmented by internal dissent – for example, I am sure, I know, that my continued interest in, and positive attitude to, Mormonism has ‘driven away’ many Protestant and Catholic readers – especially because I will usually not print comments on Mormonism when I regard them as ignorant or driven by animosity (and there are a lot of these).
(I will not provide a forum for anti-Mormonism (plenty of them already), so I will not print ignornat or hostile comments without refutation – and I have not the inclination or interest to try and refute them further than the many blog postings already do – so I censor them unrepetantly, even when coming from known and liked commenters.)
Your blog is still small, so growth is still possible without compromize – although probably this blog already has more real-world influential than mine because you have a cohesive and engaged audience.
But my pessimistic inference from the small corner of the world I inhabit is that the dwindling Mere-but-real Christian blogosphere reflects the dwindling of Mere-but-real Christian intellectuals as a group.
Most of this group have by now been corrupted by ideological subordination to secular Leftism, and are joining mainstream culture (for example the First Things group), while the specifically denominational Christian groups are clearly on the slide.
This especially applies to the previously dominant intellectual Roman Catholics and Anglicans which provided much of the Christian firepower over the past decades – yet now dead and gone, or else (like Peter Kreeft) aged.
Eastern Orthodox are deeply divided ethnically and that is not changing. Conservative Protestants are not interested in Mere Christianity – and viscerally hostile to Mormons.
Mormonism remains fundamentally healthy and uncorrupted, but the Mormon *bloggers* are – *as a whole* – simply recapitulating (tentatively, but with the same self-congratulatory and self-conscious ‘radicalism’ and ‘liberation’) the trajectory of apostasy of the mid 1960s counter culture – the same arguments *exactly* but half a century later.
So the situation is overall very bad for intellectual Christians!
BUT luckily that need not be a concern, so long as we believe that our work has benefit for a few individual people. A handful of people, several human beings, who really feel some kind of daily nourishment and benefit from my blog is *easily* enough encouragement to continue – indeed it is an abundance of reward.