Economic and policy historian Phillip Magness has an enlightening post on Houston’s Harvey situation:
Older generations remember earlier storms and hurricanes that produced similar effects going back decades, although you have to return to December 6-9, 1935 to find an example that compares to Harvey’s stats.
Houston was a much smaller city in 1935, both in population and in geographical spread. But by some metrics the 1935 flood was even more severe. Buffalo Bayou – the main waterway through downtown – peaked at over 54 feet. Harvey, in all its devastation, hit “only” 40 feet by comparison. The 1935 storm dropped less rain, the maximum recorded being about 20 inches to the north of town where Houston’s main airport now sits. But it was also complicated by the problem of severe storms upstream that flowed into town and caused almost all of the other creeks and bayous that flooded last weekend to exceed their banks. Reports at the time noted that as much as 2/3rds of what was then rural and unpopulated farmland in surrounding Harris County saw flooding. Those areas are now suburbs today.
The effects of the 1935 flood on populated areas are also eerily similar to what we saw on television over the weekend. I recommend watching this film of the aftermath for comparison. All of downtown was underwater, as the film shows. People were stranded on rooftops as rivers of water emerged around them. There are even clips of rescuers navigating the streets of neighborhoods in small boats and canoes as water reached second and third stories on nearby buildings.
In the aftermath of the 1935 flood, the federal government commissioned an extensive study of Houston’s rainfall patterns. They produced
the following map of the Houston storm’s effects, showing unsettling similarities to what we just witnessed (note that this map does not include the areas to the north of town, where rainfall in 1935 was significantly higher. These are the suburbs that flooded along Cypress and Spring Creeks last weekend and the farmland that similarly flooded in 1935)
And therein lies the importance of history to understanding what we just witnessed in catastrophic form this weekend. Houston floods fairly regularly. In fact, downtown Houston has suffered a major flood on average about once a decade as far back as records extend in the 1830s.
He continues:
…tropical storms and hurricanes throughout the 20th century revealed Houston’s continued vulnerability to storms.
The reasons have to do almost entirely with topography and geography. Houston sits on the gulf of Mexico in an active hurricane zone that attracts large storms. But more significantly, Houston’s topography is extraordinarily flat. The elevation drop across the entire city and region is extremely modest. Most local waterways are slow-moving creeks and bayous that wind their way through town and eventually trickle into the shallow, marshy Trinity bay. Drainage is slow on a normal day. During a deluge, these systems fill rapidly with water that effectively has nowhere to go.
We’ve seen a flurry of commentators in the past few days attributing Houston’s flooding to a litany of pet political causes. Aside from the normal carping about “climate change” (which always makes for a convenient point of blame for bad warm weather events, even as environmentalists simultaneously decry the old conservative canard about blizzards contradicting Al Gore), several pundits and journalists have opportunistically seized upon Houston’s famously lax zoning and land use regulations to blame Harvey’s destruction on “sprawl” and call for “SmartGrowth” policies that restrict and heavily regulate future construction in the city.
According to this argument, Harvey’s floods are a byproduct of unrestricted suburban development in the north and west of the city at the expense of prairies that would supposedly absorb rainwater at sufficient rates to prevent natural disasters and that supposedly served this purpose “naturally” in the past.
There are multiple problems with this line of argument that suggest it is rooted in naked political opportunism rather than actual concern for Houston’s flooding problems.
And here they are:
- “flooding has been a regular feature of Houston’s landscape since the beginning of recorded history in the region. And catastrophic flooding – including multiple storms in the 19th century and the well-documented flood of December 1935 – predates any of the “sprawl” that has provoked these armchair urban designers’ ire.”
- “the flooding we saw in Harvey is largely a result of creeks and bayous backlogging and spilling over their banks as more water rushes in from upstream. While parking lot and roadway runoff from “sprawl” certainly makes its way into these streams, it is hardly the source of the problem. The slow-moving and windy Brazos river reached record levels as a result of Harvey and spilled over its banks, despite being nowhere near the city’s “sprawl.” The mostly-rural prairie along Interstate 10 to the extreme west of the city recorded some of the worst flooding in terms of water volume due to the Brazos overflow, although fortunately property damage here will be much lower due to being rural.”
- “the very notion that Houston is a giant concrete-laden water retention pond is itself a pernicious myth peddled by unscrupulous urban planning activists and media outlets. In total acres, Houston has more parkland and green space than any other large city in America and ranks third overall to San Diego and Dallas in park acreage per capita.”
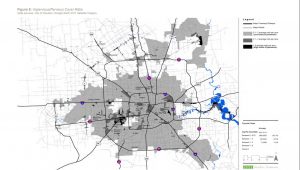
- “a 2011 study by the Houston-Galveston Area Council…actually measured the ratio of impervious-to-pervious land cover within the city limits (basically the amount of water-blocking concrete vs. water-absorbing green land). The study used an index scale to measure water-absorption land uses. A low score (defined as less than 2.0 on the scale) indicates a high presence of green relative to concrete. A high score (defined as greater than 5.0) indicates high concrete and low levels of greenery and other water-absorbing cover. The result are in the map below, showing the city limits. Gray corresponds to high levels of pervious surfaces (or greenery). Black corresponds to high impervious surface use (basically either concrete or lakes that collect runoff). As the map shows, over 90% of the land in the city limits is gray, indicating more greenery and higher water absorption. Although they did not measure unincorporated Harris County, it also tends to be substantially less dense than the city itself.”
In short,
Houston’s flood problems are a distinctive feature of its topography and geography, and they long predate any “sprawl.” While steps have been taken over the years to mitigate them and reduce the severity of flooding, a rare but catastrophic event will unavoidably overwhelm even the most sophisticated flood control systems. Harvey was one such event – certainly the highest floodwater event to hit Houston in over 80 years, and possibly the worst deluge in its recorded history. But it is entirely consistent with almost 2 centuries of recorded historical patterns. In the grander scheme of causes for Harvey’s flooding, “sprawl” does not even meaningfully register.