The Global Economic Impact of Climate Change

Image result for climate change

Yale economist William Nordhaus has done some of the best research on the economic effects of climate change. In a new working paper, Nordhaus and Andrew Moffat survey the literature (27 studies) and look at 36 different estimates regarding the global economic impact of climate change by 2100. They note that the IPCC stated in their 2007 report, “Global mean losses could be 1 to 5% of GDP for 4°C of warming” (pg. 2). Overall, “there are many studies of theoretical temperature increases in the 2 to 4 °C range, and that they cluster in the range of a loss of 0 to 4% of global output” (pg. 13). The authors’ own “preferred regression” provides an “estimated impact” of “1.63 % of income at 3 °C warming and 6.53% of income at a 6 °C warming. We make a judgmental adjustment of 25% to cover unquantified sectors…With this adjustment, the estimated impact is -2.04 (+ 2.21) % of income at 3 °C warming and -8.16 (+ 2.43) % of income at a 6 °C warming” (pg. 3).

This supports my previous posts about the economics of climate change. Once again, climate change will drastically reduce income over the next 100 years without intervention (and recent research suggests that we might have more time to intervene than previously thought). But people will still be be significantly better off compared to us today even if we fail to act. They just won’t be as well off as they could have been.

Land-Use Restrictions and the Economy

A brand new NBER working paper confirms what past evidence has shown: land-use restrictions tend to have negative effects on the economy. The researchers conclude,

Image result for land-use restrictions
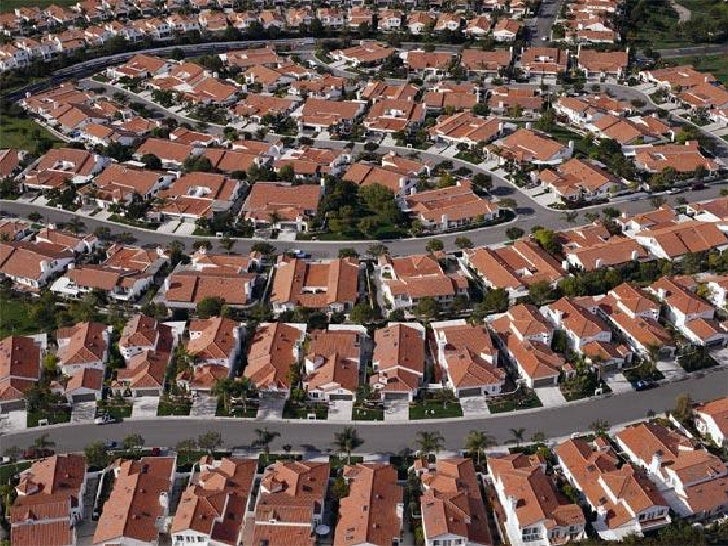
Historically, U.S. economic growth has gone hand-in-hand with the regional reallocation of labor and capital. The pace of resource reallocation, however, has slowed considerably. This decline has roughly coincided with lower productivity and output growth, as well as growing home price premia in high income states, including California and New York.

This paper develops a theory of these observations based on land-use regulations. We analyzed how policies that restrict land-use have affected resource reallocation, aggregate output and productivity, and regional employment shares.

We constructed a multi-region model economy in which regions differ by their productivity, their amenities, their urban land stock, and land-use regulations. We develop a procedure that uses the model together with data on land acreage, regional employment shares, and regional labor productivities to identify time series of regional TFP, amenities, and to systematically construct a time series of land-use regulations, which has been missing from the literature. Our model-inferred TFP, amenities, and land-use regulations compare fairly closely with independent measures of state-level regulations and quality of life measures.

We find that reforming land-use regulations would generate substantial reallocation of labor and capital across U.S. regions, and would significantly increase investment, output, productivity, and welfare. The results indicate that too few people are located in the highly productive states of California and New York. In particular, we find that deregulating just California and New York back to their 1980 land-use regulation levels would raise aggregate productivity by as much as 7 percent and consumption by as much as 5 percent. The results suggest that relaxing land-use restrictions may contribute significantly to higher aggregate economic performance (pg. 40).

They explain “that even modest land-use deregulation leads to a substantial reallocation of population across the states, with California’s population growing substantially. We also find that economy-wide TFP, output, consumption, and investment would be significantly higher as a consequence of deregulation. We find that U.S. labor productivity would be 12.4 percent higher and consumption would be 11.9 percent higher if all U.S. states moved halfway from their current land-use regulation levels to the current Texas level. Much of these gains reflect general equilibrium effects from the policy change. In particular, roughly half of the output and welfare increases reflect the substantial reallocation of capital across states” (pg. 4).

Houston, Hurricanes, and History

Economic and policy historian Phillip Magness has an enlightening post on Houston’s Harvey situation:

Older generations remember earlier storms and hurricanes that produced similar effects going back decades, although you have to return to December 6-9, 1935 to find an example that compares to Harvey’s stats.

Houston was a much smaller city in 1935, both in population and in geographical spread. But by some metrics the 1935 flood was even more severe. Buffalo Bayou – the main waterway through downtown – peaked at over 54 feet. Harvey, in all its devastation, hit “only” 40 feet by comparison. The 1935 storm dropped less rain, the maximum recorded being about 20 inches to the north of town where Houston’s main airport now sits. But it was also complicated by the problem of severe storms upstream that flowed into town and caused almost all of the other creeks and bayous that flooded last weekend to exceed their banks. Reports at the time noted that as much as 2/3rds of what was then rural and unpopulated farmland in surrounding Harris County saw flooding. Those areas are now suburbs today.

The effects of the 1935 flood on populated areas are also eerily similar to what we saw on television over the weekend. I recommend watching this film of the aftermath for comparison. All of downtown was underwater, as the film shows. People were stranded on rooftops as rivers of water emerged around them. There are even clips of rescuers navigating the streets of neighborhoods in small boats and canoes as water reached second and third stories on nearby buildings.

In the aftermath of the 1935 flood, the federal government commissioned an extensive study of Houston’s rainfall patterns. They produced 
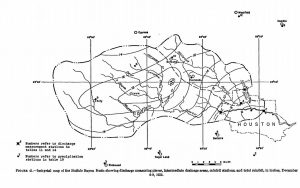
the following map of the Houston storm’s effects, showing unsettling similarities to what we just witnessed (note that this map does not include the areas to the north of town, where rainfall in 1935 was significantly higher. These are the suburbs that flooded along Cypress and Spring Creeks last weekend and the farmland that similarly flooded in 1935)

And therein lies the importance of history to understanding what we just witnessed in catastrophic form this weekend. Houston floods fairly regularly. In fact, downtown Houston has suffered a major flood on average about once a decade as far back as records extend in the 1830s.

He continues:

tropical storms and hurricanes throughout the 20th century revealed Houston’s continued vulnerability to storms.

The reasons have to do almost entirely with topography and geography. Houston sits on the gulf of Mexico in an active hurricane zone that attracts large storms. But more significantly, Houston’s topography is extraordinarily flat. The elevation drop across the entire city and region is extremely modest. Most local waterways are slow-moving creeks and bayous that wind their way through town and eventually trickle into the shallow, marshy Trinity bay. Drainage is slow on a normal day. During a deluge, these systems fill rapidly with water that effectively has nowhere to go.

We’ve seen a flurry of commentators in the past few days attributing Houston’s flooding to a litany of pet political causes. Aside from the normal carping about “climate change” (which always makes for a convenient point of blame for bad warm weather events, even as environmentalists simultaneously decry the old conservative canard about blizzards contradicting Al Gore), several pundits and journalists have opportunistically seized upon Houston’s famously lax zoning and land use regulations to blame Harvey’s destruction on “sprawl” and call for “SmartGrowth” policies that restrict and heavily regulate future construction in the city.

According to this argument, Harvey’s floods are a byproduct of unrestricted suburban development in the north and west of the city at the expense of prairies that would supposedly absorb rainwater at sufficient rates to prevent natural disasters and that supposedly served this purpose “naturally” in the past.

There are multiple problems with this line of argument that suggest it is rooted in naked political opportunism rather than actual concern for Houston’s flooding problems.

And here they are:

  1. “flooding has been a regular feature of Houston’s landscape since the beginning of recorded history in the region. And catastrophic flooding – including multiple storms in the 19th century and the well-documented flood of December 1935 – predates any of the “sprawl” that has provoked these armchair urban designers’ ire.”
  2. “the flooding we saw in Harvey is largely a result of creeks and bayous backlogging and spilling over their banks as more water rushes in from upstream. While parking lot and roadway runoff from “sprawl” certainly makes its way into these streams, it is hardly the source of the problem. The slow-moving and windy Brazos river reached record levels as a result of Harvey and spilled over its banks, despite being nowhere near the city’s “sprawl.” The mostly-rural prairie along Interstate 10 to the extreme west of the city recorded some of the worst flooding in terms of water volume due to the Brazos overflow, although fortunately property damage here will be much lower due to being rural.”
  3. “the very notion that Houston is a giant concrete-laden water retention pond is itself a pernicious myth peddled by unscrupulous urban planning activists and media outlets. In total acres, Houston has more parkland and green space than any other large city in America and ranks third overall to San Diego and Dallas in park acreage per capita.”
  4. “a 2011 study by the Houston-Galveston Area Council…actually measured the ratio of impervious-to-pervious land cover within the city limits (basically the amount of water-blocking concrete vs. water-absorbing green land). The study used an index scale to measure water-absorption land uses. A low score (defined as less than 2.0 on the scale) indicates a high presence of green relative to concrete. A high score (defined as greater than 5.0) indicates high concrete and low levels of greenery and other water-absorbing cover. The result are in the map below, showing the city limits. Gray corresponds to high levels of pervious surfaces (or greenery). Black corresponds to high impervious surface use (basically either concrete or lakes that collect runoff). As the map shows, over 90% of the land in the city limits is gray, indicating more greenery and higher water absorption. Although they did not measure unincorporated Harris County, it also tends to be substantially less dense than the city itself.”

In short,

Houston’s flood problems are a distinctive feature of its topography and geography, and they long predate any “sprawl.” While steps have been taken over the years to mitigate them and reduce the severity of flooding, a rare but catastrophic event will unavoidably overwhelm even the most sophisticated flood control systems. Harvey was one such event – certainly the highest floodwater event to hit Houston in over 80 years, and possibly the worst deluge in its recorded history. But it is entirely consistent with almost 2 centuries of recorded historical patterns. In the grander scheme of causes for Harvey’s flooding, “sprawl” does not even meaningfully register.

The Health Benefits of Nuclear Power

Image result for chernobyl diaries

Science writer Ronald Bailey has a brief write-up on some of the research regarding nuclear power and health outcomes:

A 2015 recent analysis by Israeli researcher Yehoshua Socol in the journal Dose-Reponse reconsiders the health consequences of the the Chernobyl accident. Socol argues that using even the most conservative linear no-threshold hypothesis to calculate cancer risk cannot distinguish any increase above normal background rates of cancer incidence and mortality. Assume 50,000 cancer deaths would result from Chernobyl’s radiation. Socol notes, assuming current mortality rates, that over the next 50 years some 50 million people (plus or minus 2.5 million) will die of cancer in developed countries. Given the annual uncertainty of 50,000 deaths per year, it would be impossible to detect what number, if any, of those deaths can be attributed to exposures to Chernobyl.

Socol concludes that “unlike the widespread myths and misperceptions, there is little scientific evidence for carcinogenic, mutagenic or other detrimental health effects caused by the radiation in the Chernobyl-affected area, besides the acute effects and small number of thyroid cancers. On the other hand, it should be stressed that the above-mentioned myths and misperceptions about the threat of radiation caused, by themselves, enormous human suffering.”

A fascinating December 2015 study by European researchers in the Journal of Geophysical Research-Atmospheres asked what would the health consequences to Europe if the continent had closed all of its nuclear power plants and switched to coal-fired generation between 2005 and 2009? They calculated that there would have been an increase of around 100,000 premature deaths annually owing to increased air pollution (most of them due to cardiopulmonary illnesses). If these calculations are correct, the number of deaths attributable to coal would have been three times higher than even the worst-case Chernobyl cancer scenario being pushed by activists. If the WHO’s estimates are right, coal kills at more than 1,000 times the rate of Chernobyl radiation.

Chernobyl was bad enough, but exaggerating its effects to further an unscientific campaign against nuclear power is ethically sleazy and may have the unintended consequence of killing more people than the activists claim they want to save.

There’s Hollywood, then there’s reality.

Did the EPA Change Its Stance on Fracking?

Image result for epaAccording to The New York Times,

The Environmental Protection Agency has concluded that hydraulic fracturing, the oil and gas extraction technique also known as fracking, has contaminated drinking water in some circumstances, according to the final version of a comprehensive study first issued in 2015. The new version is far more worrying than the first, which found “no evidence that fracking systemically contaminates water” supplies. In a significant change, that conclusion was deleted from the final study.

So why the change? Is there new evidence demonstrating that fracking is in fact a danger to water sources? Not really. CBS reports,

The government report notes concerns over well leaks and waste water spilling above ground. The agency didn’t pinpoint any damage related to the fracking deep underground itself. “What we found is that although the overall incidents of impacts is low, that there are vulnerabilities,” said EPA science adviser Thomas Burke. The EPA is taking a tougher stance than ever before. Language in an earlier draft of the report downplaying fracking concerns was removed. It said: “We did not find evidence that these mechanisms have led to widespread, systemic impacts on drinking water resources.” Burke explained why they omitted the lighter language. “The gaps in information unfortunately do not allow us to say how much, what is the rate of the impact. And so that sentence was removed,” Burke said.

Elsewhere, Burke told reporters, “While the number of identified cases of drinking water contamination is small, the scientific evidence is insufficient to support estimates of the frequency of contamination…Scientists involved with finalising the assessment specifically identified this uncertainty in the report.”

The above can hardly be interpreted as a seismic, anti-fracking change. Science writer Ronald Bailey observes,

First, most of the instances and speculations cited in the EPA report are applicable to all oil and gas wells, not just to wells created by means of fracking. These include harms caused by spills, leaks due to faulty well casings, and inadequate treatment and disposal of fluids and water that flow from wells.

Focusing chiefly on the process of fracking itself—creating cracks by injecting pressurized fluids into shale rocks as a way to release trapped oil and natural gas—the EPA report looks at four pathways by which fracking specifically could contaminate drinking water supplies. Most of the agency’s findings are couched in conditional language. They include the possibility that fluids and natural gas could migrate via fracked cracks that might extend directly into drinking water aquifers; because well casings for horizontal drilling might be less able to withstand the high fracking pressures they may be more likely to leak allowing contaminants to migrate; migration might occur when a fracked well “communicates” with a nearby previously drilled well that is not able to withstand the additional pressures from newly released natural gas; and fracked cracks might intersect with natural faults allowing contaminants to migrate into drinking water supplies.

The EPA cites the results of lots of computer models that find that migration of fluids and natural gas by these four pathways is possible. However, given the fact that by some estimates as many as 35,000 fracked oil and gas wells are drilled each year in the United States, it is astonishing how few examples of actual contamination and other harms are identified in the EPA report…Given even the limited quantitative findings in the EPA’s final report, the agency should have reaffirmed its original more qualitative statement that there is little “evidence that these mechanisms have led to widespread, systemic impacts on drinking water resources.”

Read the report for yourself: “However, significant data gaps and uncertainties in the available data prevented us from calculating or estimating the national frequency of impacts on drinking water resources from activities in the hydraulic fracturing water cycle” (pg. 2). The 2015 draft report read, “We did not find evidence that these mechanisms have led to widespread, systemic impacts on drinking water resources in the United States” (pg. 6). These two reports communicate virtually the same thing. The newest report still, to quote the draft, “did not find evidence that these mechanisms have led to widespread, systemic impact on drinking water resources in the United States.” The language is simply massaged to emphasize “data gaps and uncertainties.” Both the draft and final reports acknowledge that fracking can impact drinking water sources under certain circumstances. That’s not a revelation. What the draft highlighted was the infrequency of these incidents. What the new report highlights is a lack of good data to quantify the frequency. However, the takeaway for the scientifically minded is nearly identical: there is no evidence that fracking has “led to widespread, systemic impact on drinking water resources.” Nonetheless, better data and continual research is needed (absence of evidence is not evidence of absence and whatnot).

Future evidence may indeed condemn fracking mechanisms or at least call for better regulations. For now, that evidence is sorely lacking. Natural gas is both economically and environmentally beneficial. We need to be careful not to squash it due to faulty interpretations of government reports.

The Effects of Climate Change on the U.S. Economy

Climate change could have massive negative effects on the U.S. economy according to a new study:

We exploited random fluctuations in seasonal temperatures across years and states, using the richness of historical data available in the US. We employed a panel regression framework with the growth rate of gross state product (GSP) and average seasonal temperatures for each US state, and found that summer and autumn temperatures have opposite effects on economic growth. An increase in the average summer temperature negatively affects the growth rate of GSP. An increase in the autumn temperature positively affects this growth rate, although to a lesser extent. This suggests that previous studies’ aggregation of temperature data into annual temperature averages may mask the heterogeneous effects of different seasons.

The summer effect is particularly pronounced in data since 1990. This leads to a negative net economic effect of rising temperatures. This implies that the US economy is still sensitive to temperature increases, despite the adoption of adaptive technologies such as air conditioning (Barreca et al. 2015). Temperature also has a stronger effect in states with relatively high summer temperatures, most of which are located in the south.

Our analysis quantified the effect of rising temperatures across sectors of the US economy. We find that an increase in average summer temperature has a pervasive effect on all industries, not just the sectors that are traditionally assumed to be vulnerable to climate change…In our empirical analysis, an increase in the average summer temperature decreased the annual growth rate of labour productivity. An increase in the average autumn temperature had the opposite effect. Our analysis used data at the macroeconomic level, but it is consistent with existing studies of this relationship at the microeconomic level (Zivin and Neidell 2014, Cachon et al. 2012, Zivin et al. 2015).

The authors find that the long-term effect of climate change would be a reduction in “the growth rate of US output by 0.2 to 0.4 percentage points by the end of the century. At the historical growth rate of US GDP of 4% per year, this would correspond to a reduction of up to 10%. The results are even more dramatic in the high emissions scenario (A2). Here, the reduction of economic growth could reach 1.2 percentage points, corresponding to roughly one-third of the historical annual growth rate of the US economy.”

You can see economist Bridget Hoffman explain the findings below:

These results echo Joseph Heath’s analysis of climate change’s effects on the global economy. But perhaps more important, it helps drive home his main point: climate change will drastically reduce economic growth over the next 100 years without intervention. But people will still be be significantly better off compared to us today even if we fail to act (check the GDP graph at about 0:46). They just won’t be as well off as they could have been.

Policy makers should consider both of these facts when discussing how to combat climate change.

Climate Change and Economic Growth

Philosopher Joseph Heath has an enlightening working paper on the economics and ethics of climate change. Heath is emphatic that his goal is

not to make a case for the importance of economic growth, but merely to expose an inconsistency in the views held by many environmental ethicists. Part of my reason for doing so is to narrow the gap somewhat, between the discussion about climate change that occurs in philosophical circles and the one that is occurring in policy circles, about the appropriate public response to the crisis. One of the major differences is that the policy debate is conducted under the assumption of ongoing economic growth, as well as an appreciation of the importance of growth for raising living standards in underdeveloped countries. The philosophical discussion, on the other hand, is dominated by the view that ongoing economic growth is either impossible or undesirable, leading to widespread acceptance of the steady-state view. This view is, however, a complete non-starter as far as the policy debate is concerned, because it is too easily satisfied. As a result, its widespread acceptance among philosophers (and environmentalists) has led to their large-scale self-marginalization (pg. 31).

Drawing on the economic research of economists Nicholas Stern and William Nordhaus, Heath proceeds to point out how misleading language often distorts and exaggerates the negative impact of climate change:

Stern adopts a similar mode of expression when he suggests that “in the baseline-climate scenario with all three categories of economic impact, the mean cost to India and South-East Asia is around 6% of regional GDP by 2100, compared to a global average of 2.6%.” The casual reader could be forgiven for thinking that the reference, when he speaks of “loss in GDP per capita,” is to present GDP. What he is talking about, however, is actually the loss of a certain percentage of expected future GDP. In some cases, he states this more clearly: “The cost of climate change in India and South East Asia could be as high as 9- 13% loss in GDP by 2100 compared with what could have been achieved in a world without climate change.” The last clause is of course crucial – under this scenario, GDP will not be 9-13% lower than it is right now, but rather lower than it might have been, in 2100, had there not been any climate change…In other words, what Stern is saying is that climate change stands poised to depress the rate of growth. This type of ambiguity has unfortunately become common in the literature. An important recent paper in Nature by Marshall Burke, Solomon M. Hsiang and Edward Miguel, estimating the anticipated costs of climate change, presents its conclusions in the same misleading way. The abstract of the paper states that “unmitigated climate change is expected to reshape the global economy by reducing average global incomes by roughly 23% by 2100.” The paper itself, however, states the finding in a slightly different way: “climate change reduces projected global output by 23% in 2100, relative to a world without climate change.” Again, that last qualifying clause is crucial, yet it was the unqualified version of the claim found in the abstract that made its way into the headlines, when the study was published (pgs. 15-16).

Heath acknowledges that

these potential losses are enormous, and they call for a strong policy response in the present. At the same time, what these economists are describing is not a “broken world,” in which “each generation is worse off than the last.” On the contrary, they are describing a world in which the average person is vastly better off than the average person is now – just not as well off as he or she might have been, had we been less profligate in our greenhouse gas emissions. It is important, in this context to recall that annual rate of real per capita GDP growth in India, at the time of writing is 6.3%, and so what Stern is describing is, at worst, the loss of approximately two years worth of growth. At the present rate of growth, living standards of the average person in India are doubling every 12 years. There are fluctuations from year to year, but the mean expectation of several studies, calculated by William Nordhaus, suggests that the GDP of India will be about 40 times larger in 2100 than it was in the year 2000 (which implies an average real growth rate of 3.8%). The 9-13% loss, due to climate change, is calculated against the 40-times-larger 2100 GDP, not the present one (pg. 16-17).

The full paper has more details and additional arguments. But this is the kind of serious cost/benefit analysis we need to be having about climate change.

The Real War on Science

trust-me-im-a-scientists

New York Times reporter and best-seller John Tierny published an excellent article with City Journal in which he argues that the Left has waged a far more damaging and effective war on science than the Right, despite narratives to the contrary. The whole article is worth reading, but among his examples include:

  1. Extensive confirmation bias (and other biases) in the social sciences that result in skewed research, particularly regarding research comparing left-wing people and right-wing people.
  2. Taboos against valid research: for example, discouraging or outright condemning research that (a) explores genetic differences between genders or races (unless the genetic differences relate to differences in sexual orientation) or (b) finds negative impacts of single-parent households, LGBT parenting, or putting children in childcare versus stay-at-home parenting.
  3. Politicizing (and thus corrupting) research on (a) genetics and animal breeding (contributing to the eugenics movement of the early 20th century),  (b) overpopulation (contributing, Tierny argues, to China’s immoral and disastrous one-child policy), (c) environmental science (contributing to many different problems, such as increased death tolls from malaria when DDT was restricted or the spread of dengue and Zika virus due to needless fears of insecticides), and (d) food science (pushing low fat diets and greatly increasing American consumption of carbohydrates).

Tierny argues that possibly one of the greatest casualties of the Left’s war on science is the reputation of scientists. As he puts it: “Bad research can be exposed and discarded, but bad reputations endure.”

The whole article is worth reading, but here is a sampling:

In a classic study of peer review, 75 psychologists were asked to referee a paper about the mental health of left-wing student activists. Some referees saw a version of the paper showing that the student activists’ mental health was above normal; others saw different data, showing it to be below normal. Sure enough, the more liberal referees were more likely to recommend publishing the paper favorable to the left-wing activists. When the conclusion went the other way, they quickly found problems with its methodology.


The narrative that Republicans are antiscience has been fed by well-publicized studies reporting that conservatives are more close-minded and dogmatic than liberals are. But these conclusions have been based on questions asking people how strongly they cling to traditional morality and religion—dogmas that matter a lot more to conservatives than to liberals. A few other studies—not well-publicized—have shown that liberals can be just as close-minded when their own beliefs, such as their feelings about the environment or Barack Obama, are challenged.

Social psychologists have often reported that conservatives are more prejudiced against other social groups than liberals are. But one of Haidt’s coauthors, Jarret Crawford of the College of New Jersey, recently noted a glaring problem with these studies: they typically involve attitudes toward groups that lean left, like African-Americans and communists. When Crawford (who is a liberal) did his own study involving a wider range of groups, he found that prejudice is bipartisan. Liberals display strong prejudice against religious Christians and other groups they perceive as right of center.

Conservatives have been variously pathologized as unethical, antisocial, and irrational simply because they don’t share beliefs that seem self-evident to liberals. For instance, one study explored ethical decision making by asking people whether they would formally support a female colleague’s complaint of sexual harassment. There was no way to know if the complaint was justified, but anyone who didn’t automatically side with the woman was put in the unethical category. Another study asked people whether they believed that “in the long run, hard work usually brings a better life”—and then classified a yes answer as a “rationalization of inequality.” Another study asked people if they agreed that “the Earth has plenty of natural resources if we just learn how to develop them”—a view held by many experts in resource economics, but the psychologists pathologized it as a “denial of environmental realities.”


For his part, Holdren [a previous advocate of forced population control in the U.S.] has served for the past eight years as the science advisor to President Obama, a position from which he laments that Americans don’t take his warnings on climate change seriously. He doesn’t seem to realize that public skepticism has a lot to do with the dismal track record of himself and his fellow environmentalists. There’s always an apocalypse requiring the expansion of state power. The visions of global famine were followed by more failed predictions, such as an “age of scarcity” due to vanishing supplies of energy and natural resources and epidemics of cancer and infertility caused by synthetic chemicals. In a 1976 book, The Genesis Strategy, the climatologist Stephen Schneider advocated a new fourth branch of the federal government (with experts like himself serving 20-year terms) to deal with the imminent crisis of global cooling. He later switched to become a leader in the global-warming debate.


Yet many climate researchers are passing off their political opinions as science, just as Obama does, and they’re even using that absurdly unscientific term “denier” as if they were priests guarding some eternal truth. Science advances by continually challenging and testing hypotheses, but the modern Left has become obsessed with silencing heretics. In a letter to Attorney General Loretta Lynch last year, 20 climate scientists urged her to use federal racketeering laws to prosecute corporations and think tanks that have “deceived the American people about the risks of climate change.” Similar assaults on free speech are endorsed in the Democratic Party’s 2016 platform, which calls for prosecution of companies that make “misleading” statements about “the scientific reality of climate change.” A group of Democratic state attorneys general coordinated an assault on climate skeptics by subpoenaing records from fossil-fuel companies and free-market think tanks, supposedly as part of investigations to prosecute corporate fraud. Such prosecutions may go nowhere in court—they’re blatant violations of the First Amendment—but that’s not their purpose. By demanding a decade’s worth of e-mail and other records, the Democratic inquisitors and their scientist allies want to harass climate dissidents and intimidate their donors.


Related reading:


2016 NAS Report on GMOs: Safe With Relatively Minor Concerns

Image result for gmo

The National Academy of Sciences released a comprehensive report earlier this year that “builds on previous related Academies reports published between 1987 and 2010 by undertaking a retrospective examination of the purported positive and adverse effects of GE crops and to anticipate what emerging genetic-engineering technologies hold for the future.” Here are the highlights from the press release:

  • Effects on human health: “The committee carefully searched all available research studies for persuasive evidence of adverse health effects directly attributable to consumption of foods derived from GE crops but found none. Studies with animals and research on the chemical composition of GE foods currently on the market reveal no differences that would implicate a higher risk to human health and safety than from eating their non-GE counterparts. Though long-term epidemiological studies have not directly addressed GE food consumption, available epidemiological data do not show associations between any disease or chronic conditions and the consumption of GE foods. There is some evidence that GE insect-resistant crops have had benefits to human health by reducing insecticide poisonings. In addition, several GE crops are in development that are designed to benefit human health, such as rice with increased beta-carotene content to help prevent blindness and death caused by vitamin A deficiencies in some developing nations.”
  • Effects on the environment: “The use of insect-resistant or herbicide-resistant crops did not reduce the overall diversity of plant and insect life on farms, and sometimes insect-resistant crops resulted in increased insect diversity, the report says. While gene flow – the transfer of genes from a GE crop to a wild relative species – has occurred, no examples have demonstrated an adverse environmental effect from this transfer. Overall, the committee found no conclusive evidence of cause-and-effect relationships between GE crops and environmental problems. However, the complex nature of assessing long-term environmental changes often made it difficult to reach definitive conclusions.”
  • Effects on agriculture: “The available evidence indicates that GE soybean, cotton, and maize have generally had favorable economic outcomes for producers who have adopted these crops, but outcomes have varied depending on pest abundance, farming practices, and agricultural infrastructure. Although GE crops have provided economic benefits to many small-scale farmers in the early years of adoption, enduring and widespread gains will depend on such farmers receiving institutional support, such as access to credit, affordable inputs such as fertilizer, extension services, and access to profitable local and global markets for the crops. Evidence shows that in locations where insect-resistant crops were planted but resistance-management strategies were not followed, damaging levels of resistance evolved in some target insects. If GE crops are to be used sustainably, regulations and incentives are needed so that more integrated and sustainable pest-management approaches become economically feasible. The committee also found that in many locations some weeds had evolved resistance to glyphosate, the herbicide to which most GE crops were engineered to be resistant. Resistance evolution in weeds could be delayed by the use of integrated weed-management approaches, says the report, which also recommends further research to determine better approaches for weed resistance management. Insect-resistant GE crops have decreased crop loss due to plant pests. However, the committee examined data on overall rates of increase in yields of soybean, cotton, and maize in the U.S. for the decades preceding introduction of GE crops and after their introduction, and there was no evidence that GE crops had changed the rate of increase in yields. It is feasible that emerging genetic-engineering technologies will speed the rate of increase in yield, but this is not certain, so the committee recommended funding of diverse approaches for increasing and stabilizing crop yield.”

Add this to the statements by the World Health Organization, the American Medical Association, and the American Association for the Advancement of Science that GMOs are safe. Concerns over increased chemical use may be somewhat legitimate, though this tends to be complicated. However, fears about herbicides like glyphosate are often overblown, seeing that both the EPA and the U.N.’s Food and Agriculture Organization and WHO declare that it is not a cancer risk. Furthermore, it is important to note that uncontrolled weeds are actually a potentially huge threat, making weedkillers all the more important. As for increased herbicide resistance, science writer Ronald Bailey explains in his book The End of Doom: Environmental Renewal in the Twenty-First Century,

What about “superweeds”? Again, the evolution of resistance by weeds to herbicides is nothing new and is certainly not a problem specifically related to genetically enhanced crops. As of April 2014, the International Survey of Herbicide Resistant Weeds reports that there are currently 429 uniquely evolved cases of herbicide resistant weeds globally involving 234 different species. Weeds have evolved resistance to 22 of the 25 known herbicide sites of action and to 154 different herbicides. Herbicide resistant weeds have been reported in 81 crops in sixty-five countries. A preliminary analysis by University of Wyoming weed scientist Andrew Kniss parses the data on herbicide resistance from 1986 to 2012. He finds no increase in the rate at which weeds become resistant to herbicides after biotech crops were introduced in 1996. Since Roundup (glyphosate) is the most popular herbicide used with biotech crops, have the number of weed species resistant to Roundup increased? Kniss finds that the development of Roundup resistant weeds has occurred more frequently among non biotech crops. Glyphosate resistant weeds evolved due to glyphosate use, not directly due to GM crops,” he points out. “Herbicide resistant weed development is not a GMO problem, it is a herbicide problem (pgs. 155-156).

In summary, GMOs are indeed safe with relatively minor concerns. Or, as Slate‘s William Saletan puts it,

The more you learn about herbicide resistance, the more you come to understand how complicated the truth about GMOs is. First you discover that they aren’t evil. Then you learn that they aren’t perfectly innocent. Then you realize that nothing is perfectly innocent. Pesticide vs. pesticide, technology vs. technology, risk vs. risk—it’s all relative. The best you can do is measure each practice against the alternatives. The least you can do is look past a three-letter label.

Natural Gas: The Bridge to Renewable Energy

Most people are in favor of renewable energy such as wind and solar, yet many supporters tend to look at natural gas with disdain. However, a new NBER study finds that this position is untenable. As one of the authors writes in The Washington Post,

Because of the particular nature of clean energy sources like solar and wind, you can’t simply add them to the grid in large volumes and think that’s the end of the story. Rather, because these sources of electricity generation are “intermittent” — solar fluctuates with weather and the daily cycle, wind fluctuates with the wind — there has to be some means of continuing to provide electricity even when they go dark. And the more renewables you have, the bigger this problem can be.

Now, a new study suggests that at least so far, solving that problem has ironically involved more fossil fuels — and more particularly, installing a large number of fast-ramping natural gas plants, which can fill in quickly whenever renewable generation slips.

Er…Solar!

…In the study, the researchers took a broad look at the erection of wind, solar, and other renewable energy plants (not including large hydropower or biomass projects) across 26 countries that are members of an international council known as the Organisation for Economic Co-operation and Development over the period between the year 1990 and 2013. And they found a surprisingly tight relationship between renewables on the one hand, and gas on the other.

…“Our paper calls attention to the fact that renewables and fast-reacting fossil technologies appear as highly complementary and that they should be jointly installed to meet the goals of cutting emissions and ensuring a stable supply,” the paper adds.

Image result for earth captain planet gif
…which is where the natural gas is found.

The study seems to indicate that natural gas is “a so-called “bridge fuel” that allows for a transition into a world of more renewables, as it is both flexible and also contributes less carbon dioxide emissions than does coal, per unit of energy generated by burning the fuel.” Or, as Reason‘s science writer Ronald Bailey puts it, “Anti-fracking pro-renewable energy activists are walking contradictions.”