With yet another Oxfam report out, Swedish author Johan Norberg felt the obligation to point out its deficiencies:[ref]The following is based on a Bing translation.[/ref]
There are two rules to stick to when someone reports that the rich are getting richer and the poor poorer. The first is to check the source. The second is that if the track shows that the information comes from OXFAM, you can throw it in the trash. Few organizations have such a consistent habit of misleading about the world’s prosperity.
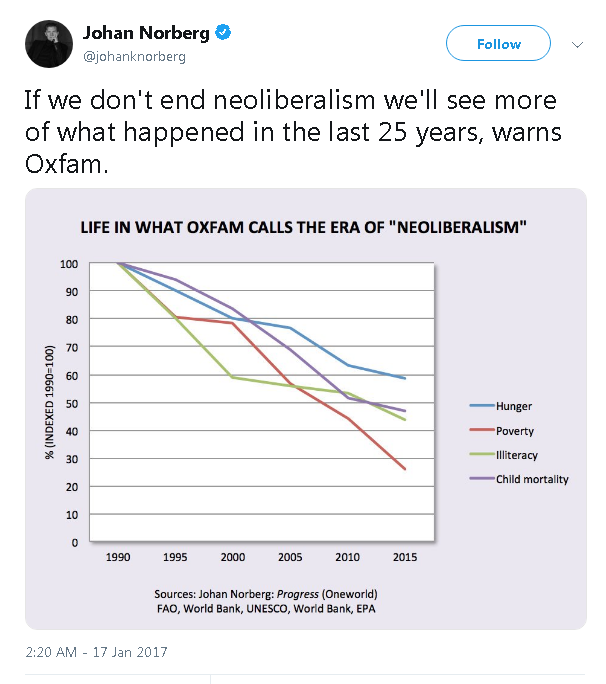
The fact is that poverty is decreasing dramatically regardless of the degree of poverty that is used. According to the UN and World Bank’s measures of extreme poverty, it has fallen from 18.1 to 8.6% between 2008 and 2018. It is the biggest economic lift in history.
So how can Oxfam get it to the poor become poorer? Firstly, they ignore the income and consumption, and count only financial assets, which the poor rarely have – often they do not even have a bank account. And although some have it, there will not be much left in total when you deduct all the debts they have from this amount.
It enables OXFAM every year to shock journalists by saying that a single billionaire owns more than two billion people together. The problem with the reasoning is just that my daughter – who owns about 500 kronor – owns more than two billion people together, because these two billions do not have any net financial assets at all.[ref]Others have had similar criticisms over the years.[/ref]
Or, as he said on Twitter a couple years ago:

Norberg then cites some recent research on global earnings inequality. The researchers explain,
We focus exclusively on labour earnings, which is the main income source for the vast majority of the world’s population (Hammar and Waldenström 2017). We create the first estimates of global earnings inequality, its trend between 1970 and 2015, and some evidence on its main drivers.
The estimation of the global earnings inequality rests on a unique earnings survey database run by UBS, a Swiss bank. It contains data on earnings, taxes, working hours, and local prices for workers in 15 representative occupations. The data have been collected in the same way every third year since 1970, in up to 85 cities in 66 countries, in all the world’s continents. We match it with occupational and country population data from the ILO and the World Bank. Our balanced sample covers more than 80% of the global population, and correlates well with statistics from other sources. It should be noted that the tails of the distribution are not well covered in our data, but imputations from other sources (top incomes from the World Wealth and Income Database, for example) suggest only a modest impact on the global earnings inequality trend.
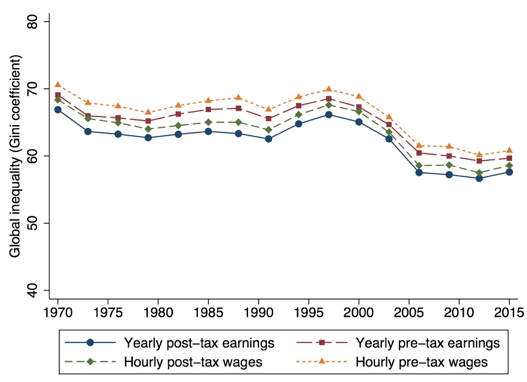
Figure 1 [below] shows the main result – that global earnings inequality was very high in 1970 (with a Gini coefficient of around 70), but has fallen to a lower level today (around 60). The main equalisation occurred in the late 1990s and 2000s. Global pre-tax inequality is higher than global post-tax inequality (approximately 3 Gini points), and inequality is higher for hourly wages than for yearly earnings (approximately 1 percentage point). The latter suggests a negative relationship between earnings and hours worked at the global level. Compared with earlier studies on global inequality in income or consumption, we find that inequality in earnings and wages is slightly lower, but follows a similar trend.

They continue,
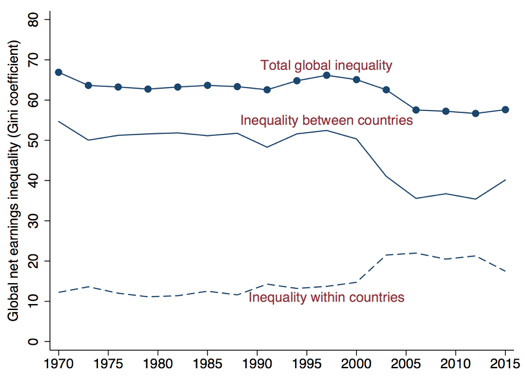
Decomposing the global earnings inequality trend within and between countries, we find that within-country inequality rose over this period (by 5 Gini points), while between-country inequality fell (by 15 points), leading to the combined effect of a 10-point fall in total earnings inequality. In Figure 3, we can also see that the main shift in both of these trends took place at almost the same time, during the early years of the 21st century. We also find that inequality within occupations has fallen, especially within the traded, industrial sector. This suggests that globalisation could be a potential driver of this earnings convergence trend.

They conclude,
Our new evidence on global earnings and wage inequality shows a falling trend over the past half-century. Similar to previous findings for global household income inequality, the main equalisation period was the late 1990s and 2000s. At this time several large, developing economies experienced high growth rates. Higher earnings in the agricultural sector, but also some low-skill urban professions, contributed specifically to this trend.
Once again, things are getting better.