Walker joined Difficult Run as an editor in August 2013.
He graduated from the University of North Texas with an MBA in Strategic Management and a BBA in Organizational Behavior and Human Resource Management. He's currently a grad student in Government at Johns Hopkins University. He has been published in SquareTwo, BYU Studies Quarterly, Dialogue, Graziadio Business Review, and Economic Affairs. He also contributed to Julie Smith's (ed.) 'As Iron Sharpens Iron: Listening to the Various Voices of Scripture'. His other online writing can be found at Worlds Without End and Times & Seasons. He lives in Denton, Texas, with his wife.
A week late, but what were some of the political economics behind the American Revolution? Here’s the abstract from a new working paper:
Why did the most prosperous colonies in the British Empire mount a rebellion? Even more puzzling, why didn’t the British agree to have American representation in Parliament and quickly settle the dispute peacefully? At first glance, it would appear that a deal could have been reached to share the costs of the global public goods provided by the Empire in exchange for political power and representation for the colonies. (At least, this was the view of men of the time such as Lord Chapman, Thomas Pownall and Adam Smith). We argue, however, that the incumbent government in Great Britain, controlled by the landed gentry, feared that allowing Americans to be represented in Parliament would undermine the position of the dominant coalition, strengthen the incipient democratic movement, and intensify social pressures for the reform of a political system based on land ownership. Since American elites could not credibly commit to refuse to form a coalition with the British opposition, the only realistic options were to maintain the original colonial status or fight a full-scale war of independence.
I was reviewing some old blog posts and such and came across the following. Remember this beautiful exchange?
Awww, yes. The “evil corporations” trope, i.e. the “confusion between abstract categories and flesh-and-blood human beings.”[ref]Thomas Sowell, Economic Facts and Fallacies, 2nd ed. (New York: Basic Books, 2011), 153.[/ref] Explaining the fallacious nature of this thinking, Thomas Sowell writes,
Abstract people can be aggregated into statistical categories such as households, families, and income brackets, without the slightest concern for whether those statistical categories contain similar people, or even the same number of people, or people who differ substantially in age, much less in such finer distinctions as whether or not they are working or whether they are the same people in the same categories over time. Abstract people have an immortality which flesh-and-blood people have yet to achieve.[ref]Thomas Sowell, Intellectuals and Society (New York: Basic Books, 2009), 112-113.[/ref]
What Romney’s hecklers (affiliates of Iowa Citizens for Community Improvement) and critics seem to have missed is the abstract nature of “greedy corporations.” The rhetoric invoked by these individuals often describes corporations as quasi-personal, transcendent entities that exist above and beyond flesh-and-blood people. As one writer notes, “Romney doesn’t mean that corporations are entitled to some of the legal rights of people in the Citizens United sense. He means it in the sense that the money made by corporations flows in and out of human hands—or pockets, in the language of the heckler who hoisted himself on his own metaphorical petard.” The abstractions of “corporations” and “the rich” are frequently linked, if not synonymous. Yet, empirical evidence suggests that corporate taxes negatively impact actual people. And not the rich ones you would hope for.[ref]See Matthew H. Jensen, Aparna Mathur, “Corporate Tax Burden on Labor: Theory and Evidence,” Tax Notes (June 6, 2011) for a nice rundown of the literature.[/ref]
A 2010 working paper explored international tax rates and manufacturing wages across 65 countries over 25 years. It suggests that a 1 percent increase in corporate tax rates decreases wage rates by 0.5-0.6 percent. “These results also hold for effective marginal and average tax rates” (pg. 22). A 2012 study[ref]Ungated working paper version here.[/ref] looked at over 55,000 companies in 9 European countries between 1996 and 2003. It found that every $1 increase in tax liability leads to a $0.49 decline in wages. This suggests that about 50% of the increased tax burden is passed on to the labor force over the long run. A 2007 Kansas City Fed working paper used cross-country data between 1979 and 2002 to find that a 1 percentage point increase in the average corporate tax rate led to a 0.7% decrease in annual gross wages; a decrease that was more than 4 times the amount of the corporate tax revenue collected. Furthermore, the “burden of the corporate tax on wages is shared equally across skill-level, suggesting that the corporate tax may not be as progressive as many politicians assume. Also, as the economy becomes more global, raising the corporate tax may result in lower than predicted corporate revenue increases due to the ability of firms to avoid taxes more effectively” (pg. 22). Another 2007 paper looked at a panel of U.S. multinationals across 50 countries over a 15-year period. The authors found that 45-75% of the corporate tax is shouldered by labor, with the rest falling on capital. Similarly, a 2013 study finds that a $1 increase in corporate tax liability leads to decreases in wages by about $0.60. The authors conclude,
Our findings suggest that labor shares a significant part of the burden of corporate income taxes. A direct calculation of the mean marginal effect of the corporate income tax from our estimates suggests that a 10 percent increase in the tax rate would decrease the average wage rate by 0.28–0.38 percent. Labor shares at least 42 percent of the burden of the corporate tax and possibly more. The average labor share of the corporate tax burden is around 60–80 percent (pg. 233).
A 2016 study[ref]Earlier, ungated version here.[/ref] of state corporate tax rates concluded that 25-30% fell on landowners and 30-35% fell on workers. A 2016 paper for the Federal Reserve looked at 131 tax increases and 140 tax cuts across 45 states going back to 1969. It found that “a one percentage-point increase in the top marginal corporate income tax rate reduces employment by between 0.3% and 0.5% and income by between 0.3% and 0.6%, measured relative to neighboring counties on the other side of the state border. These estimates are remarkably stable: they remain essentially unchanged regardless of local characteristics such as the flexibility of local labor markets, income levels, population density, or the prevalence of small businesses in a county. They are also stable across the business cycle and little changed when we control for localized industry-level shocks by comparing employment and income in bordering counties within the same industry” (pg. 3). A 2009 study by economist Robert Carroll found that across state lines “a one percent drop in the average tax rate leads to a 0.014 percent rise in real wages five years later.” In other words, wages rise $2.50 for every dollar reduction in the state-local corporate income taxes. The opposite also occurs: every dollar increase in tax rates leads to a $2.50 loss in wages. Drawing on recent research, Carroll suggests that “the least mobile factor of production is likely to bear the burden of a tax. In an increasingly global economy, labor is the least mobile because capital can flow freely across borders…When workers have more capital to work with, their labor productivity and wages will rise” (pg. 1). An abstraction is unable to pay its demanded “fair share” and instead places the economic burden on individuals. “After all, businesses are merely convenient ways of organizing economic activity,” writes Carroll, “so while businesses write checks to pay the corporate tax (and other taxes), the burden of those taxes falls ultimately on the individuals who depend on the corporations, in their roles as investors, workers, or consumers” (pg. 2). This is why Carroll finds numerous benefits to cutting corporate taxes, including higher long-term growth, higher wages and living standards, lowered tax burdens on low-income taxpayers and seniors, and boosted entrepreneurship, investment, and productivity.
The point of this review is to remind us that policy is complicated and often counterintuitive. We need to look at the empirical evidence. And if there isn’t much, perhaps we should wait until there is. The effects are real and they impact real people. The problem is that rarely will you achieve a utopian outcome. As I’m fond of saying, “There are no solutions; there are only trade-offs.”[ref]Sowell, The Vision of the Anointed: Self-Congratulation as a Basis for Social Policy(New York: Basic Books, 1995), 142.[/ref]
For a sense of net effects –positive or negative, we looked at 22 primary studies. Explicit analysis on skilled versus unskilled immigrants is rare. So, most of the econometric results pertain to the effects of total immigrants. They remain instructive, given the overwhelming direction of migrant flows from less educated to more educated countries.
…In our RPB, broken down to the three components of labor productivity, positive effects from total immigrants are especially apparent through TFP. There is no statistically significant impact on physical capital per worker suggesting that capital accumulation need not be adversely affected. Human capital per worker is somewhat negatively affected, indicating that immigrants’ compositional effect on skills tends to outweigh the effect on natives’ skills upgrading. In the studies that analyze labor productivity alongside all its three components, positive immigrant effects on TFP more than offset the effects on physical capital and human capital per worker.
Outcomes vary across countries. Positive productivity effects from total immigrants are obvious for the U.S. – analysis using state-level data links task specialization of less-educated natives, induced by unskilled immigrant inflows, to TFP growth. Studies suggest that the complementarity and scale channels operate in Malaysia, but also that automation is somewhat hindered. Actual empirical evidence of net productivity effects seems mixed, and not representative enough of the economy as a whole, tending to focus on the manufacturing sector. In contrast, there is also the unique example of a large influx of skilled immigrants into Israel (fleeing the collapse of the Soviet Union) not having positive effects on productivity in the manufacturing sector.
More than anything, the cross-country evidence highlights that underlying the likelihood of positive net productivity effects is how immigrants link to specific gaps in the economy – regardless of skill level. And the response of agents, markets and institutions in host countries.
In fact, the report found that “on balance, total immigrant effects on labor productivity are statistically insignificant to positive” with “statistically significant positive effects” for total factor productivity (pg. 2). In short, “The economic case for an outright ban on unskilled immigrant workers is weak.”
I know I said the same thing about 2016. And 2015. Even 2013. But that’s because things continue to get better. Nicholas Kristof writes in The New York Times, “There’s a broad consensus that the world is falling apart, with every headline reminding us that life is getting worse. Except that it isn’t. In fact, by some important metrics, 2016 was the best year in the history of humanity. And 2017 will probably be better still…Polls show that about 9 out of 10 Americans believe that global poverty has worsened or stayed the same.” And yet,
Every day, an average of about a quarter-million people worldwide graduate from extreme poverty, according to World Bank figures. Or if you need more of a blast of good news, consider this: Just since 1990, more than 100 million children’s lives have been saved through vaccinations, breast-feeding promotion, diarrhea treatment and more. If just about the worst thing that can happen is for a parent to lose a child, that’s only half as likely today as in 1990. When I began writing about global poverty in the early 1980s, more than 40 percent of all humans were living in extreme poverty. Now fewer than 10 percent are. By 2030 it looks as if just 3 or 4 percent will be. (Extreme poverty is defined as less than $1.90 per person per day, adjusted for inflation.) For nearly all of human history, extreme poverty has been the default condition of our species, and now, on our watch, we are pretty much wiping it out. That’s a stunning transformation that I believe is the most important thing happening in the world today — whatever the news from Washington.
What’s more is that “global income inequality is…declining. While income inequality has increased within the U.S., it has declined on a global level because China and India have lifted hundreds of millions from poverty.”[ref]Nathaniel and I covered global poverty and inequality in our 2014 SquareTwo article.[/ref] Today “some 40 countries are now on track to eliminate elephantiasis. When you’ve seen the anguish caused by elephantiasis — or leprosy, or Guinea worm, or polio, or river blindness, or blinding trachoma — it’s impossible not to feel giddy at the gains registered against all of them.” In “the 1960s, a majority of humans had always been illiterate; now, 85 percent of adults are literate. And almost nothing makes more difference in a society than being able to read and write.”
For me, this was the clincher in Kristof’s piece:
On a recent trip to Madagascar to report on climate change, I was struck that several mothers I interviewed had never heard of Trump, or of Barack Obama, or even of the United States. Their obsession was more desperate: keeping their children alive. And the astonishing thing was that those children, despite severe malnutrition, were all alive, because of improvements in aid and health care — reflecting trends that are grander than any one man.
He concludes, “The most important thing happening is not a Trump tweet. What’s infinitely more important is that today some 18,000 children who in the past would have died of simple diseases will survive, about 300,000 people will gain electricity and a cool 250,000 will graduate from extreme poverty.”
AEI’s James Pethokoukis has a nice little blog post on the negative effects of ill-conceived regulation:
So I very much liked a Mercatus study last year finding US economic growth has been slowed by an average 0.8% per year since 1980 due to the cumulative effects of regulation. Also a favorite of mine: A 2013 study from economists John Dawson of Appalachian State University and John Seater of North Carolina State University, Federal Regulation and Aggregate Economic Growth, that estimates the past 50 years of federal regulations have reduced real GDP by roughly two percentage points a year, or nearly $40 trillion. Both studies show pretty sizable effects from smarter regulation or deregulation.
He points to new articles at Reason and National Affairs demonstrating that the Federal Communications Commission limited tech advancement, including cell phones. As economist Thomas Winslow Hazlett writes in his Reason piece,
When AT&T wanted to start developing cellular in 1947, the FCC rejected the idea, believing that spectrum could be best used by other services that were not “in the nature of convenience or luxury.”… A child conceived at the same time as cellular would have been 37 years old by the time the first commercial cellphone—Gordon Gecko’s $3,995 Motorola DynaTAC 8000X brick—was released onto the market. Once the blockage was cleared, progress popped. Soon, the science fiction vision of the Star Trek communicator was reality.
Sociologist W. Bradford Wilcox testified before a committee put together by the National Academies of Sciences, Engineering, and Medicine on child poverty in the United States. The following comes from his testimony:[ref]The sources for Wilcox’s claims can be found in the full link.[/ref]
Research by Robert Lerman of the Urban Institute and Isabel Sawhill of the Brookings Institution, among others, suggests the growth of child poverty from the 1970s to the 1990s was driven, in part, by the rise of single-parent families and family instability over this time period. For instance, in 1970, 12% of children lived with a single parent; by 1990, 25% of children lived with a single parent. Their work indicates that more than half of the increase in child poverty over this period can be attributed to the decline of stable marriage as an anchor to family life in America. Since then, the retreat from marriage has slowed, which means that family structure has been less salient in the ebb and flow of child poverty. Nevertheless, this research suggests that child poverty would be markedly lower in the United States if more American parents were stably married.
In fact, the continuing relevance of marriage to economic well-being can be seen in two recent studies, both of which suggest that marriage per se is strongly related to poverty. My own recent research with the Institute for Family Study’s Wendy Wang indicates that Millennials who have formed a family by marrying first are significantly less likely to be poor than Millennials who have formed a family by having a child before or outside of marriage. After controlling for education, race, ethnicity, family-of-origin income, and a measure of intelligence/knowledge (AFQT scores), we find that Millennials who married before having any children are about 60% less likely to be poor than their peers who had a child out of wedlock. In fact, as shown in the figure below, 95% of Millennials who married first are not poor by the time they are in their late twenties or early thirties. So, even for the latest generation of young adults, it looks like marriage continues to matter.
…[C]hildren in single-mother-headed families (who make up the clear majority of single-parent families) are over four times more likely to be poor, compared to children in married-parent families. And because more than one-quarter of American children are in single-parent families, this elevates the child poverty rate above what it would otherwise be if more children were living in married-parent families. Sawhill’s research suggests that if the share of children in female-headed families had remained steady at the 1970 level of 12.0%, then the 2013 child poverty rate would be at 16.4%, rather than a rate of 21.3%. In other words, the current child poverty rate would be cut by almost one-quarter if the nation enjoyed 1970-levels of married parenthood.
What about cohabiting parents?
One recent study finds, for instance, that children born to cohabiting parents are almost twice as likely to see their parents break up, compared to children born to married parents, even after controlling for a number of socioeconomic factors. This means that children in cohabiting families are more likely to end up in single-parent families or complex families without both their biological parents, which increases their risk of being in poverty. All this suggests that cohabitation does not protect children from poverty as much as marriage does.
What are the economic benefits of marriage for children?
“children raised by their married parents are much more likely to enjoy access to the economic support of their father over the course of their childhood, compared to children raised by single or cohabiting parents.”
“married parents are more likely to enjoy economies of scale, compared to single parents, and to pool their income, compared to other types of families.”
“stably married parents who do not have children with other partners do not incur child support obligations or legal expenses related to family dissolution that reduce their household income.”
“having stably married parents is worth about an extra $40,000 in annual family income to children while growing up, compared to children being raised by a single parent.”
What are his policy recommendations?
“On the educational front, strengthen vocational education and apprenticeship programs, so as to increase the vocational opportunities of the majority of young adults who will not get a four-year college degree.“
“On the policy front, work to minimize marriage penalties facing lower-income families, perhaps by offering newly married Americans a “honeymoon” period of three years where their eligibility for means-tested programs would not end if they marry—so long as their household income is below a threshold of $55,000.”
“On the cultural front, launch local, state, and federal campaigns on behalf of what Haskins and Sawhill have called the “success sequence,”where young adults are encouraged to get at least a high school degree, work full-time, and marry before having any children—in that order.”
“On the civic front, encourage secular and religious organizations to be more deliberate about targeting Americans without college degrees.”
This shouldn’t surprise anyone that has kept up with my posts. But it’s always nice to have some of the most updated research on the matter.
land use controls have a more widespread impact on the lives of ordinary Americans than any other regulation. These controls, typically imposed by localities, make housing more expensive and restrict the growth of America’s most successful metropolitan areas. These regulations have accreted over time with virtually no cost-benefit analysis. Restricting growth is often locally popular. Promoting affordability is hardly a financially attractive aim for someone who owns a home. Yet the maze of local land use controls imposes costs on outsiders, and on the American economy as a whole.
…[The] most productive parts of America are unaffordable. The National Association of Realtors data shows median sales prices over $1,000,000 in the San Jose metropolitan area and over $500,000 in Los Angeles…America’s affordability problem is local, not national, but that doesn’t mean that land use regulations don’t have national implications. Historically, when parts of America experienced outsized economic success, they built enormous amounts of housing. New housing allowed thousands of Americans to participate in the productivity of that locality. Between 1880 and 1910, bustling Chicago’s population grew by an average of 56,000 each year. Today, San Francisco is one of the great capitals of the information age, yet from 1980 to 2010, that city’s population grew by only 4200 people per year.
…Land use controls that limit the growth of such successful cities mean that Americans increasingly live in places that make it easy to build, not in places with higher levels of productivity. Hsieh and Moretti (2015) have estimated that “lowering regulatory constraints” in areas like New York and Silicon Valley would “increase U.S. GDP by 9.5%.” Whether these exact figures are correct, they provide a basis for the claim that America’s most important, and potentially costly, regulations are land use controls.
…Land use controls may be benign even if they restrict growth and increase prices. Their proponents argue that they prevent environmental damage and reduce the downsides of local growth to the community. Theoretically, it is at least conceivable that America’s web of locally-constructed zoning codes have worked out to be a finely tuned system that functions like a perfect Pigouvian tax internalizing all the offsetting externalities of all new construction.
Yet such a view seems untenable. Getting the right national policy requires comparing the social costs of building in one location versus the costs of building elsewhere. Few localities seriously consider the negative impact that restricting buying will have on non-residents of their town. No locality considers the impact that their local rules may induce more building elsewhere.
We’ve written on zoning laws before. As Glaeser concludes, “Reforming local land use controls is one of those rare areas in which the libertarian and the progressive agree. The current system restricts the freedom of the property owner, and also makes life harder for poorer Americans. The politics of zoning reform may be hard, but our land use regulations are badly in need of rethinking.”
What is the science of diversity and creativity? According to an article in Harvard Business Review, it may be slightly surprising given how much of a buzzword “diversity” has become:
Generating vs. implementing ideas:Studies suggest that diversity is useful in generating ideas, but actually a hindrance when it comes to selecting and implementing them. “It would therefore make sense for organizations to increase diversity in teams that are focused on exploration or idea generation, and use more-homogeneous teams to curate and implement those ideas. This distinction mirrors the psychological competencies associated with the creative process: divergent thinking, openness to experience, and mind wandering are needed to produce a large number of original ideas, but unless they are followed by convergent thinking, expertise, and effective project management, those ideas will never become actual innovations. For all the talk about the importance of creativity, the critical piece is really innovation.”
Good leadership:Effective leadership can mitigate diversity-induced conflict. “It is the psychological process that enables individuals to set aside their selfish agendas to cooperate with others for the common benefit of the team, articulating the natural tension between our desire to get ahead of others and our need to get along with others.”
Moderate diversity is better: “recent evidence suggests that a moderate degree of diversity is more beneficial than a higher dose. This finding is consistent with the too-much-of-a-good-thing paradigm in management science, which provides compelling evidence for the idea that even the most desirable qualities have a dark side if taken to the extreme.”
Personality vs. demographic differences: “Most discussions about diversity focus on demographic variables (e.g., gender, age, and race). However, the most interesting and influential aspects of diversity are psychological (e.g., personality, values, and abilities), also known as deep-level diversity. Indeed, there are several advantages to focusing on deep-level variables as opposed to demographic factors. First, whereas demographic variables perpetuate stereotypical and prejudiced characterizations, deep-level diversity focuses on the individual, allowing a much more granular understanding of human diversity.”
Knowledge flows: Diversity doesn’t matter unless there is “a culture of sharing knowledge. Studies mapping the social networks of organizations have found higher levels of creativity in groups that are more interconnected, particularly when creative and intrapreneurial individuals are a central node in those networks.”
Skeptics: “diversity training is most effective with individuals who are skeptical of it. This is encouraging, though the challenge, of course, is to ensure that people who are cynical about diversity actually enroll in these training programs.”[ref]Diversity training has to be done properly to be effective.[/ref]
Non-diversity factors matter (and matter more): “As a seminal meta-analysis of 30 years of research showed, support for innovation, vision, task orientation, and external communication is the strongest determinant of creativity and innovation; most input variables, including team composition and structure, have much weaker effects. Likewise, developing expertise, assigning people to tasks that are meaningful and interesting, and improving creative thinking skills will produce higher gains in both individual and team creativity than focusing on diversity will.” Selecting employees based on their creativity also enhances overall creativity.
The article concludes, “In short, there are probably much better reasons for creating a diverse team and organization than boosting creativity. And if your actual goal is to enhance creativity, there are simpler, more effective solutions than boosting diversity.”
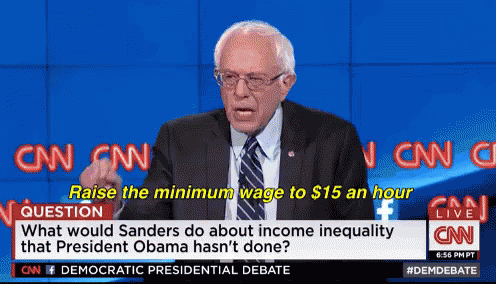
Ready for the second minimum wage paper in a row today? A new working paper looks at the Danish experience, where the minimum wage increases drastically when individuals turn 18 years old. So what happens when individuals become adults? “Danish minimum wages cause an increase in average wages of 40 percent when workers reach age 18. This increase in wages causes a 33 percent decrease in employment when workers turn 18, almost all of which comes from job loss” (pgs. 30-31).
In a section of the paper that adds important new evidence to the debate, the authors look at the consequence of losing a job at age 18. One year after separation only 40% of the separated workers are employed but 75% of the non-separated workers are employed. Different interpretations of this are possible. The separated workers will tend to be of lower quality than the non-separated and maybe this is correlated with less desire to have a job. Without discounting that story entirely, however, the straightforward explanation seems to me to be the most likely. Namely, the minimum wage knocks low-skill workers off the job ladder and it’s difficult to get back on until their skills improve.
the Seattle Minimum Wage Ordinance caused hours worked by low-skilled workers (i.e., those earning under $19 per hour) to fall by 9.4% during the three quarters when the minimum wage was $13 per hour, resulting in a loss of 3.5 million hours worked per calendar quarter. Alternative estimates show the number of low-wage jobs declined by 6.8%, which represents a loss of more than 5,000 jobs. These estimates are robust to cutoffs other than $19. A 3.1% increase in wages in jobs that paid less than $19 coupled with a 9.4% loss in hours yields a labor demand elasticity of roughly -3.0, and this large elasticity estimate is robust to other cutoffs.
…Importantly, the lost income associated with the hours reductions exceeds the gain associated with the net wage increase of 3.1%…[W]e compute that the average low-wage employee was paid $1,897 per month. The reduction in hours would cost the average employee $179 per month, while the wage increase would recoup only $54 of this loss, leaving a net loss of $125 per month (6.6%), which is sizable for a low-wage worker (pgs. 35-36).
According to The Washington Post, economist David Autor described the study as one “that is likely to influence people,” calling it “very credible” and “sufficiently compelling in its design and statistical power that it can change minds.”
Given how past evidence has been ignored, I doubt it.


 When AT&T wanted to start developing cellular in 1947, the FCC rejected the idea, believing that spectrum could be best used by other services that were not “in the nature of convenience or luxury.”… A child conceived at the same time as cellular would have been 37 years old by the time the first commercial cellphone—Gordon Gecko’s $3,995 Motorola DynaTAC 8000X brick—was released onto the market. Once the blockage was cleared, progress popped. Soon, the science fiction vision of the Star Trek communicator was reality.
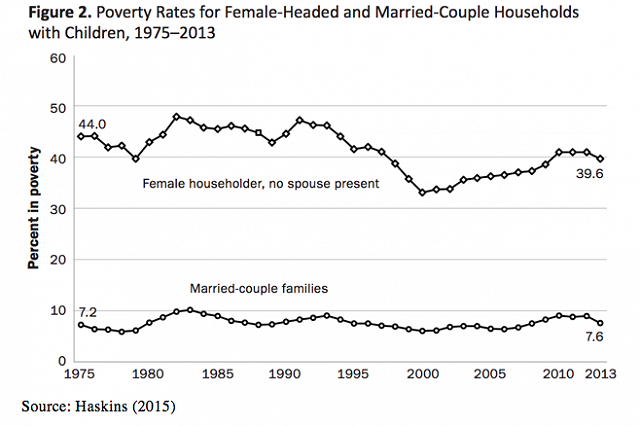
 land use controls have a more widespread impact on the lives of ordinary Americans than any other regulation. These controls, typically imposed by localities, make housing more expensive and restrict the growth of America’s most successful metropolitan areas. These regulations have accreted over time with virtually no cost-benefit analysis. Restricting growth is often locally popular. Promoting affordability is hardly a financially attractive aim for someone who owns a home. Yet the maze of local land use controls imposes costs on outsiders, and on the American economy as a whole.