Violence Is Bad For Business

From my paper in Economic Affairs:

The…act of seeking out mutually beneficial exchanges with others expands what Michael Shermer (2015) calls the ‘moral sphere’. As this sphere diversifies, our attitudes regarding the vulnerable and disenfranchised tend to alter for the better. This moral expansion is likely why economic globalisation has been linked to fewer governmental violations of human rights, namely torture, extrajudicial killings, political imprisonment, and disappearances (De Soysa and Vadlammanati 2011). An analysis of 117 countries between 1981 and 2006 also found ‘positive effects of market-economic policy reforms on government respect for human rights’ (De Soysa and Vadlammanati 2013, p. 180) as defined above. While these studies seem to imply the market’s influence on human rights, there is also evidence that human rights boost market liberalisation. Utilising the CIRI Human Rights Data Project (which reports on extrajudicial killings, disappearances, torture, political imprisonment, freedom of speech and government censorship, freedom of religion, freedom of movement and migration, freedom of assembly and association, free and fair elections, workers’ rights, and women’s rights), a 2010 study finds that human rights abuses ‘actually reduce the pace of economic liberalization’ (Carden and Lawson 2010, p. 12). These studies seem to confirm that morals and markets create a positive feedback loop regarding human rights.

…[T]rade and business openness largely reduces the incentives of war and brutalisation. People become more valuable alive and able as potential partners, lenders, investors, and customers…After analysing data spanning from 1970 to 2005, De Soysa and Fjelde (2010) find that higher economic freedom lowers the risk of civil war, more so even than democracy and good governance. This remains true after variables such as income per capita, growth rates, total population, ethnic fractionalisation, and oil exportation are controlled for. Yet these results likely underestimate the total impact of economic freedom on civil war. ‘In reality’, write De Soysa and Fjelde (2010, p. 293), ‘the effect of economic freedom on peace is likely to be larger if we also take into account the indirect effect of economic freedom through its impact on income growth’. These findings correspond with a later study by De Soysa and Flaten (2012), which controls for the same variables and finds that higher levels of globalisation (particularly economic globalisation) reduce the risk of civil war as well as state violations of human rights. Other research finds that free-market conditions and economic liberalisation are associated with lower levels of various societal insecurities, including open armed conflict, violent crime, murder, societal militarisation and political instability (Stringham and Levendis 2010; De Soysa 2011, 2016; Bjornskov 2015). Various organisations from the World Economic Forum (2016) to the UN Global Compact (2014) are recognising the power commerce has to decrease conflict and establish peace (pg. 426-429).

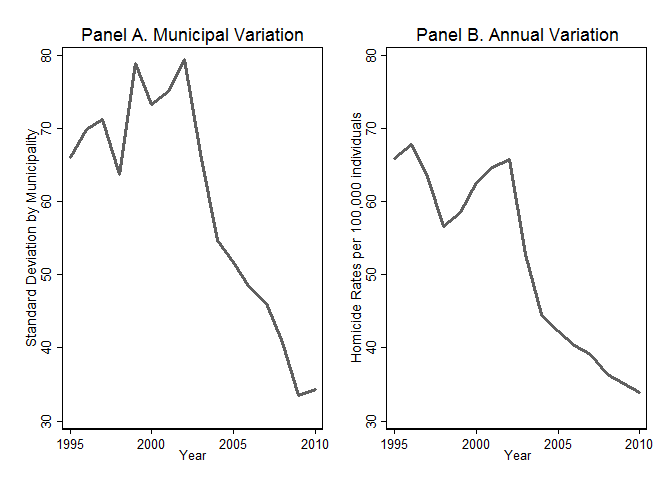
A brand new study looks at the relationship between violence and business by examining Columbia’s reduction in violence between 1995 and 2010. 

The author explains,

To precisely measure the effects of violent crime on firm behaviour, I use the large reductions in violence caused by increased security expenditures of the Democratic Security programme under Uribe’s administration. According to the Uribe’splan published in 2003, the Democratic Security programme aimed at restoring police presence in all municipalities; dismantling terrorist organisations; reducing kidnappings, extortion, and homicides; preventing forced displacement; and fighting the illegal drug trade (Ministerio de Defensa 2003). Uribe’s government intended to achieve these goals by increasing spending on military infrastructure, personnel, and intelligence. High spending on security led to decreased violence in municipalities that voted for Uribe in the presidential elections of 2002 (when he was elected for the first time) as he was looking for re-election in 2006 (he was re-elected).

…I combine unique plant-level and rich consumer pricing data with homicide rates and electoral results in Colombia. Using these data, I compare the prices and market size of Colombian municipalities that showed higher and lower support for Alvaro Uribe in the presidential election of 2002. These correlations were subsequently reflected in larger or lower changes in homicide rates.

I find large effects due to changes in violent crime: 

– When violence decreases by 1%, firm aggregate production increases by approximately 0.4%. This is partly explained by higher production per firm but also explained by the entrance of new firms into the market.  

– Real income increases in areas with less violence. These changes are explained by higher nominal wages, which are larger in size than the documented increases in the general price levels. 

– Consequently, areas with lower violent crime have higher incomes. This condition may further reduce social unrest and violence.  

In conclusion, a “48% decline in homicide rates between 1995 and 2010 in Colombia increased aggregate production by 19.6%. My estimates, however, are a lower bound of the total social costs of violent crime, as they are do not include the costs of mortality or the long-run impacts of violent crime reductions. The benefits of reducing violence, consequently, are even higher. Investments in security improvements are thus an effective way to boost economic development.”

Violence, it seems, is antithetical to business. As I note in my paper, “findings that ‘merely’ demonstrate positive correlations [between markets and morality] should be interpreted in light of the feedback loops: even if moral behaviours are foundational and give rise to market systems (instead of vice versa), market systems in turn reinforce these virtues by imbuing them with value” (pg. 423).

Keys to Ending Global Poverty: Growth and Migration

Harvard’s Lant Pritchett has an incredible new paper out that looks at the best course for eliminating global poverty:

So think of two ways to help the global poor. One is for rich people (in a global sense) to give a dollar and get roughly a dollar’s worth of benefits for the poor. The other people is for rich people to allow people who would like to work at the prevailing wage of their country to do so and not deploy active coercion to prevent this—which reflects the person’s contribution to product and hence is (or can be made to be) zero net cost to the host country. Of course, a dollar for a poor person could produce vastly more human well-being than had the richer person spent the money as the marginal utility was much, much higher for the poor person, but this redistribution effect is the same for both options. This means, at least in current conditions, the least you can do—just increasing the freedom of people who want to work and people who want those people to work to carry out that mutually beneficially transaction across national borders—is better than the best you can do of trying to directly help people in poverty but without allowing them to move to opportunity (pg. 1-2).

Pritchett looks at the Ultra Poor Graduation program, whose stated claim is “to graduate ultra poor households out of extreme poverty to a more stable state. This 24-month program provides beneficiaries with a holistic set of services including: livelihood trainings, productive asset transfers, consumption support, savings plans, and healthcare” (pg. 9). Pritchett finds that this program led to an average income gain of $344 dollars by the third year for targeted households. “The five country average NPV of costs per household of the 24 month program was $4,545” (pg. 9).

While Pritchett recognizes that redistribution can indeed benefit the poor, its impact is quite small. He concludes,

A large part of the explanation of differences in labor productivity across countries is differences in “A”—total factor productivity. Transmitting A from country to country has proven difficult. This implies that labor with the exact same intrinsic productivity will have much higher productivity (and hence justify a higher wage) in a high A than in a low A country. But, by and large, rich countries have passed extraordinarily strict regulations on the movement of unskilled labor. A relaxation of these restrictions could produce the largest single gains in global poverty of any available policy, program or project action. And since these gains to movers are (mostly) due to higher A which (at the margin) is a “public good” (it is non-rival and non-excludable) in the host country these gains are essentially free to the host country (or could be free to the host country under some technical design conditions).

Comparing the annual gains of the Ultra Poor Graduation program ($344 per household for a cost of $4,545) to those of a low-skill worker simply moving to and working in the United States ($17,115), Pritchett finds that the Ultra Poor Graduation program would have to invest $226,000 per person in order to match the gains of migration. Furthermore,

sustained rapid economic growth in developing countries—that is sustained by improvements in A—can also produce cumulatively enormous gains. And avoiding growth collapses/stagnation can prevent enormous losses. So, even though traditional measures of the country to country transfers of resources via “foreign aid” do not, in and of themselves, appear to be responsible for producing most of the observed differences in economic growth, investments that could bring that about more sustained growth (both more sustained accelerations and fewer sharp and extended decelerations) could also have astronomical returns. 

As Bryan Caplan sums it up, “Virtually all poverty reduction comes from economic growth and migration – not redistribution or philanthropy.”

What Does Economic Mobility in the U.S. Actually Look Like?

Economist Russ Roberts gives us some insights:

Studies that use panel data — data that is generated from following the same people over time — consistently find that the largest gains over time accrue to the poorest workers and that the richest workers get very little of the gains. This is true in survey data. It is true in data gathered from tax returns.[ref]More panel data can be found in a 2007 Treasury Department report, a 1995 Dallas Fed report, and a 1992 Treasury Department report.[/ref] 

Here are some of the studies that find a very different picture of the impact of the American economy on the economic well-being of the poor, middle, and the rich.

This first study, from the Pew Charitable Trusts, conducted by Leonard Lopoo and Thomas DeLeire uses the Panel Study of Income Dynamics (PSID) and compares the family incomes of children to the income of their parents. Parents income is taken from a series of years in the 1960s. Children’s income is taken from a series of years in the early 2000s. As shown in Figure 1, 84% earned more than their parents, corrected for inflation. But 93% of the children in the poorest households, the bottom 20% surpassed their parents. Only 70% of those raised in the top quintile exceeded their parent’s income.

Chetty et al find a similar pattern. In an otherwise gloomy assessment of American progress, they find that 70% of children born in 1980 into the bottom decile exceed their parents’ income in 2014. For those born in the top 10%, only 33% exceed their parents’ income.

The poor may find it easier to do better than their parents. But how much better off do they end up? Julia Isaacs’s study for the Pew Charitable Trusts finds that children raised in the poorest families made the largest gains as adults relative to children born into richer families.

In short, “the children from the poorest families added more to their income than children from the richest families. That reality isn’t consistent with the standard pessimistic story that only the richest Americans have benefited from economic growth over the last 30–40 years.” Another “study looks at people who were 35–40 in 1987 and then looks at how they were doing 20 years later, when they are 55–60. The median income of the people in the top 20% in 1987 ended up 5% lower twenty years later. The people in the middle 20% ended up with median income that was 27% higher. And if you started in the bottom 20%, your income doubled. If you were in the top 1% in 1987, 20 years later, median income was 29% lower.” A recent study found that when you follow quintiles, “[o]nly the people at the top gain much of anything between 1980 and 2014.” However, when you follow people, the same study finds that “the biggest gains go to the poorest people. The richest people in 1980 actually ended up poorer, on average, in 2014. Like the top 20%, the top 1% in 1980 were also poorer on average 34 years later in 2014. The gloomiest picture of the American economy is not accurate. The rich don’t get all the gains. The poor and middle class are not stagnating.”

Roberts concludes,

There’s a lot more to study and understand. But what the studies above show is that the economic growth of the last 30–40 years has been shared much more widely than is generally found in the cross-section studies that compare snapshots at two different times, following quintiles rather than people. No one of these studies is decisive. They each make different assumptions about income…which people to include, how to handle inflation. Together they suggest the glass isn’t as empty as we’ve been led to believe. It’s at least half-full.

Does Gender Equality Enlarge Gender Differences?

Previous research has found that the greater the gender equality, the greater the differences between genders. A brand new article in Science heaps on more evidence. Testing 80,000 individuals in 76 countries on preferences such as risk-taking, patience, altruism, positive and negative reciprocity, and trust, the authors found,

Gender differences were found to be strongly positively associated with economic development as well as gender equality. These relationships held for each preference separately as well as for a summary index of differences in all preferences jointly. Quantitatively, this summary index exhibited correlations of 0.67 (P < 0.0001) with log GDP per capita and 0.56 (P < 0.0001) with a Gender Equality Index (a joint measure of four indices of gender equality), respectively. To isolate the separate impacts of economic development and gender equality, we conducted a conditional analysis, finding a quantitatively large and statistically significant association between gender differences and log GDP per capita conditional on the Gender Equality Index, and vice versa. These findings remained robust in several validation tests, such as accounting for potential culture-specific survey response behavior, aggregation bias, and nonlinear relationships.

How do men and women differ?

On the global level, all six preferences featured significant gender differences (fig. S1): Women tended to be more prosocial and less negatively reciprocal than men, with differences in standard deviations of 0.106 for altruism (P < 0.0001), 0.064 for trust (P < 0.0001), 0.055 for positive reciprocity (P < 0.0001), and 0.129 for negative reciprocity (P < 0.0001). Turning to nonsocial preferences, women were less risk-taking by 0.168 standard deviations (P < 0.0001) and less patient by 0.050 standard deviations (P < 0.0001) (26).

The researchers conclude,

The reported evidence indicates that higher levels of economic development and gender equality are associated with stronger gender differentiation in preferences. These findings may also relate to other personality traits, such as the Big Five (3435) or value priorities (36). Our findings do not rule out an influence of gender-specific roles that drive gender differences in preferences. They also do not preclude a role for biological or evolutionary determinants of gender differences (37). Our results highlight, however, that theories not attributing a significant role to the social environment are incomplete (38).

In this regard, our findings point toward the critical role of availability of and equal access to material and social resources for both women and men in facilitating the independent formation and expression of gender-specific preferences across countries. As suggested by the resource hypothesis, greater availability of material resources removes the human need of subsistence, and hence provides the scope for attending to gender-specific preferences. A more egalitarian distribution of material and social resources enables women and men to independently express gender-specific preferences.

DR Editor in Economic Affairs

Image result for globalization

My article “Is Commerce Good for the Soul?: An Empirical Assessment” was published in the latest issue of Economic Affairs. The abstract reads,

Numerous empirical studies suggest that market exchange helps (a) create the conditions for liberal values to flourish, (b) refine our sense of fairness, (c) promote cooperation with those who are different from ourselves, (d) develop networks of mutual trust and trustworthiness, (e) generate tolerance and respect towards others, and (f) undermine hostility and conflict in favour of peace. This article reviews this empirical evidence and argues that markets make us better people, morally speaking.

You can read the full thing here. Check it out.

What Is the Impact of Minimum Wage Hikes on the Least-Skilled?

In case you needed more evidence that minimum wage hikes tend to hurt those with the least skills and education, here are the conclusions from a paper from earlier this year:

This paper uses the ACS to generate early estimates of the employment effects of state minimum wage increases implemented between January 2013 and January 2015. Through 2015, our best estimate is that minimum wage increases exceeding $1 resulted, on average, in an employment decline just over 1 percentage point among teenagers, among individuals ages 16–21, and among individuals ages 16–25 with less than a completed high school education. Smaller minimum wage increases and inflation indexed minimum wage increases had much smaller (and possibly positive) effects on these groups’ employment…Due to the short time horizons we analyze, our estimates provide short-run evidence on the effects of the minimum wage increases enacted after the Great Recession. Data on the longer-run effects of this period’s minimum wage changes will be essential for arriving at strong conclusions regarding their effects (pgs. 720-721).

This should surprise no one. As economist Antony Davies explains, “Historically, as the relative minimum wage has risen, unemployment among college-educated workers has not changed, unemployment among high-school-educated workers has risen slightly, unemployment among workers without high school diplomas has increased moderately, and unemployment among young workers without high school diplomas has increased dramatically.”[ref]See Davies’ own research on the topic here.[/ref] 

“I Am Not the Problem”: Economic Freedom and Human Flourishing

In this passionate TED talk, entrepreneur Magatte Wade explains why the continent of Africa is so poor: bad laws, high tariffs, and excessive red-tape on businesses. “Why is it,” she asks exasperated, “that when I look at the Doing Business index ranking of the World Bank, that ranks every country in the world in terms of how easy or hard it is to start a company, you tell me why African countries, all 50 of them, are basically at the bottom of that list? That’s why we’re poor. We’re poor because it is literally impossible to do businesses in these countries of ours.”[ref]In fact, business-friendly economic policies may actually matter more for per capita income than legal and political institutions.[/ref] She continues, getting even more worked up:

I have a manufacturing facility in Senegal. Did you know that for all my raw material that I can’t find in the country, I have to pay a 45 percent tariff on everything that comes in? Forty-five percent tariff. Do you know that, even to look for fine cardboard to ship my finished products to the US, I can’t find new, finished cardboard? Impossible. Because the distributors are not going to come here to start their business, because it makes no sense, either. So right now, I have to mobilize 3000 dollars’ worth of cardboard in my warehouse, so that I can have cardboard, and they won’t arrive for another five weeks. The fact that we are stifled with the most nonsensical laws out there. That’s why we can’t run businesses. It’s like swimming through molasses.

But it was this story that broke me: 

I explained the [things above] to my employees in Senegal. And one of them started crying — her name is Yahara. She started crying. I said, “Why are you crying?”She said, “I’m crying because I had come to believe –always seeing us represented as poor people –I had come to believe that maybe, yes, maybe we are inferior. Because, otherwise, how do you explain that we’re always in the begging situation?” That’s what broke my heart. But at the same time that she said that, because of how I explained just what I explained to you, she said, “But now, I know that I am not the problem. It is my environment in which I live, that’s my problem.”I said, “Yes.” And that’s what gave me hope –that once people get it, they now change their outlook on life.

No, you’re not the problem. 

Half of Us Are Now Middle Class

From the Brookings Institution:

For the first time since agriculture-based civilization began 10,000 years ago, the majority of humankind is no longer poor or vulnerable to falling into poverty. By our calculations, as of this month, just over 50 percent of the world’s population, or some 3.8 billion people, live in households with enough discretionary expenditure to be considered “middle class” or “rich.” About the same number of people are living in households that are poor or vulnerable to poverty. So September 2018 marks a global tipping point. After this, for the first time ever, the poor and vulnerable will no longer be a majority in the world. Barring some unfortunate global economic setback, this marks the start of a new era of a middle-class majority.

The authors classify the middle class as “households spending $11-110 per day per person in 2011 purchasing power parity, or PPP.” They “have some discretionary income that can be used to buy consumer durables like motorcycles, refrigerators, or washing machines. They can afford to go to movies or indulge in other forms of entertainment. They may take vacations. And they are reasonably confident that they and their family can weather an economic shock—like illness or a spell of unemployment—without falling back into extreme poverty…In the world today, about one person escapes extreme poverty every second; but five people a second are entering the middle class. The rich are growing too, but at a far smaller rate (1 person every 2 seconds).” 

Number of people who are Poor, Vulnerable, Middle Class, and Rich Worldwide

Sing it, Paul.

Political Identity Divides Us More Than Policy Preferences

Politics is the worst:

Increased sorting could reflect identification with groups that better match our values. Perhaps Republicans and Democrats can’t compromise because their policy preferences are irreconcilable. However, this doesn’t explain why Americans personally dislike political opponents with such intense fervor. U.S. liberals and conservatives not only disagree on policy issues: they are also increasingly unwilling to live near each other, be friends, or get married to members of the other group. 

…Now, surprising new research suggests that what divides us may not just be the issues. In two national surveys, political psychologist Lilliana Mason of the University of Maryland measured American’s preferences on six issues such as abortion and gun control, how strongly they identified as liberals and conservatives, and how much they preferred social contact with members of their own ideological groups. Identifying as liberal or conservative only explained a small part of their issue positions. (This is consistent with findings that Americans overestimate the differences in policy preferences between Republicans and Democrats.) Next, Mason analyzed whether the substantial intolerance between liberals and conservatives was due to their political identities (how much they labelled themselves as “liberal” or “conservative”) or to their policy opinions. For example, who would be more opposed to marrying a conservative: a moderate liberal who is pro-choice, or a strong liberal who is pro-life? Across all six issues, identifying as liberal or conservative was a stronger predictor of affective polarization than issue positions. Conservatives appear particularly likely to feel cold towards liberals, even conservatives who hold very liberal issue positions.

…[W]e see that Americans are increasingly divided not just on the issues but also on their willingness to socialize across the political aisle. It is normal that society manifests new social cleavages as it heals old ones. However, when identities are fused with policies that have vast, long-term consequences (e.g., war, taxes, or the Paris Agreement), these divisions imperil our ability to select policies based on their expected outcomes. To paraphrase anthropologist John Tooby, forming coalitions around policy questions is disastrous because it pits our modest urge for truth-seeking against our voracious appetite to be good group members. If Americans slide into seeing all policy debates as battles between Us vs. Them, we stop selecting policies based on their actual content. Ironically, this would lead to choosing policies that don’t match our personal values, because the content and evidence would become less important than the source. In short, seeing politics as a battle may worsen things for everyone.

Once again, politics makes us into worse people.

Image result for politics gif

Negative Effects of the Corporate Income Tax

I’ve looked at the evidence for adverse effects of the corporate income tax in a previous post. A brand new article in the American Economic Journal: Macroeconomics provides some more insights. The authors find,

A reduction in the corporate income tax rate leads to moderate job growth. If the corporate income tax were eliminated, the model predicts that the non-employed population would decrease from 34.1 percent to 31.7 percent, about a 7 percent fall in the relative nonemployment rate.

…[E]liminating the corporate income tax has a relatively small overall effect on TFP (an increase of only about 0.9 percent). The productivity loss due to capital misallocation caused by the corporate income taxation is estimated to be 2.6 percent.

…Average welfare is maximized with a 10 percent corporate income tax rate. With a lower corporate income tax rate, the widening of the corporate income tax base allows the government to maintain revenue neutrality without large increases in the personal income tax burden. An overwhelming majority of the population would be in favor of such a corporate income tax cut in this environment (pg. 302-303).

The Tax Foundation also has a new brief that looks at the benefits of cutting the corporate income tax rate:

  • One of the most significant provisions of the Tax Cuts and Jobs Act is the permanently lower federal corporate income tax rate, which decreased from 35 percent to 21 percent.
  • Prior to the Tax Cuts and Jobs Act, the United States’ high statutory corporate tax rate stood out among rates worldwide. Among countries in the Organisation for Economic Co-operation and Development (OECD), the U.S. combined corporate income tax rate was the highest. Now, post-tax reform, the rate is close to average.
  • A corporate income tax rate closer to that of other nations will discourage profit shifting to lower-tax jurisdictions.
  • New investment will increase the size of the capital stock, and productivity, output, wages, and employment will grow. The Tax Foundation Taxes and Growth model estimates that the total effect of the new tax law will be a 1.7 percent larger economy, leading to 1.5 percent higher wages, a 4.8 percent larger capital stock, and 339,000 additional full-time equivalent jobs in the long run.
  • Economic evidence suggests that corporate income taxes are the most harmful type of tax and that workers bear a portion of the burden. Reducing the corporate income tax will benefit workers as new investments boost productivity and lead to wage growth.
  • If lawmakers raised the corporate income tax rate from 21 percent to 25 percent, we estimate the tax increase would shrink the long-run size of the economy by 0.87 percent, or $228 billion. This would reduce the capital stock by 2.11 percent, wages by 0.74 percent, and lead to 175,700 fewer full time equivalent jobs.