Incoherent Know-Nothings

Cards Against Humanity’s Pulse of the Nation poll from 2017 to 2018 has some pretty interesting, disturbing, and rather unsurprising findings about the American public:

Conflicting Views

39.1% of Democrats think that it’s wrong to negatively stereotype people based on their place of birth, but also think Southerners are more racist.

65.2% of Republicans think that people are too easily offended, yet find Black Lives Matter offensive.

64.6% of Democrats think that a woman has the right to do what she wants with her body, except when it comes to selling her kidney. Nearly half also believe a woman has the right to do whatever she wants with her body, except sell it for sex.

57.9% of Republicans think that people should be free to express their political opinions in the workplace, but athletes shouldn’t be allowed to make political protests at games.

Over half of Democrats think that men and women “are equal in their talents and abilities,” except when it comes to multitasking and empathy.

About 1/3 of Republicans think we should be more suspicious of foreigners, yet believe Putin when he says he didn’t interfere in the 2016 election. (You’re twice as likely to do this if you support Trump.)

Over half of Republicans believe nobody deserves a handout and that the government should do more to help small, working-class towns in America’s heartland.

About 1/3 of Democrats say that they trust the scientific consensus, just not when it comes to GMOs.

Political Ignorance

39% of Americans either think low GDP is better than high GDP or have no clue altogether.

The majority of Americans can’t name the three branches of government.

Only 12.7% of Americans can name a living, breathing economist. 55.9% can’t name a living economist, but think their opinions about economic policy are well-informed.

The richest 1% of Americans own 39% of the country’s wealth. Everyone overestimates the amount. If you’re a Democrat, you think it is 75 percent. If you’re a Republican, you think it’s 50 percent. Perhaps surprisingly, the more educated you are, the more likely you are to overestimate the amount.

Nearly half of Americans do not believe the U.S. has interfered with foreign democratic elections. You’re less likely to believe it if you’re Republican.

Other Stuff

Those who think “sex without love” is okay are far more likely to be pro-choice.

If you rely on “common sense” instead of empirical evidence, you’re likely older, less educated, and lack a Twitter account. You also are more likely support military action against Russia for their 2016 election interference. 

29% of Trump supporters would still stick with him in 2020 even if he murdered journalist for spreading lies.

What Kind of Immigration Fuels Nationalism?

From a recent NBER Digest:

In Skill of Immigrants and Vote of the Natives: Immigration and Nationalism in European Elections 2007-16 (NBER Working Paper No. 25077), Simone Moriconi, Giovanni Peri, and Riccardo Turati explore the relationship between immigration and European elections. They develop an index of “nationalistic” attitudes of political parties to measure the shift in preferences among voters when confronted with influxes of skilled and unskilled immigrants. They find that larger inflows of highly educated immigrants dampen nationalistic sentiments, while larger inflows of less-educated immigrants heighten them. Their results imply that a more balanced inflow of high-skilled and low-skilled immigrants could attenuate voters’ nationalistic attitudes.

...The new study tracks voter attitudes and behavior for all political parties and elections in 12 European countries for a decade. It relies on demographic and political data from the European Social Survey and a number of other sources. In addition, the researchers collected and classified the political manifestos of 126 parties for 28 elections, focusing in particular on how frequently these materials mentioned nationalistic subjects, the European Union, and other indicators of where parties stood on the political spectrum.

The researchers found “that highly educated native voters are less nationalistic in their attitudes towards immigrants than less-educated natives. The data also show strong nationalistic sentiments in regional pockets in the United Kingdom, Ireland, France, Germany, Demark, Sweden, Norway and, especially, Italy.”

The results suggest that a 1 percent increase in the share of a country’s population who are immigrants in highly educated, highly skilled groups was associated with a 0.1 standard deviation voting change away from nationalism. An increase of comparable size in the number of less-educated and lower-skilled immigrants led to a 0.12 standard deviation voting change towards nationalism. The same patterns emerged when the researchers analyzed voter sentiment expressed in surveys. In this case, a 1 percent increase in high-skilled immigrants led to a 0.07 standard deviation decrease away from nationalism, while a 1 percent increase in lower-skilled immigrants lead to a 0.07 standard deviation increase in nationalism. The results were broadly similar regardless of whether the analysis focused on all immigrants or only on immigrants from non-EU nations.

Immigration is not only about ethnicity, but class as well.

What’s Behind Cuba’s Health Outcomes?

The above comes from Michael Moore’s Sicko. Cuba’s healthcare system is a common talking point among those of Moore’s persuasion. However, a recent study should give us pause regarding some of the overly positive claims about Cuba’s system. First, what people like Moore get right:

How is Cuba healthy while poor? Most attribute the fact to Cuba’s zero monetary cost health care system. There is some truth to that attribution. With 11.1% of GDP dedicated to health care and 0.8% of the population working as physicians, a substantial amount of resources is directed towards reducing infant mortality and increasing longevity. An economy with centralized economic planning by government like that of Cuba can force more resources into an industry than its population might desire in order to achieve improved outcomes in that industry at the expense of other goods and services the population might more highly desire (pg. 755).

However,

Centralized planning has disadvantages. Physicians are given health outcome targets to meet or face penalties. This provides incentives to manipulate data. Take Cuba’s much praised infant mortality rate for example. In most countries, the ratio of the numbers of neonatal deaths and late fetal deaths stay within a certain range of each other as they have many common causes and determinants. One study found that that while the ratio of late fetal deaths to early neonatal deaths in countries with available data stood between 1.04 and 3.03 (Gonzalez, 2015)—a ratio which is representative of Latin American countries as well (Gonzalez and Gilleskie, 2017). Cuba, with a ratio of 6, was a clear outlier. This skewed ratio is evidence that physicians likely reclassified early neonatal deaths as late fetal deaths, thus deflating the infant mortality statistics and propping up life expectancy. Cuban doctors were re-categorizing neonatal deaths as late fetal deaths in order for doctors to meet government targets for infant mortality.

Using the ratios found for other countries, corrections were proposed to the statistics published by the Cuban government: instead of 5.79 per 1000 births, the rate stands between 7.45 and 11.16 per 1000 births. Recalculating life expectancy at birth to account for these corrections (using WHO life tables and assuming that they are accurate depictions of reality), the life expectancy at birth of men by between 0.22 and 0.55 years (Gonzalez, 2015) (pg. 755).

But that’s not the only thing driving low infant mortality rates:

Coercing or pressuring patients into having abortions artificially improve infant mortality by preventing marginally riskier births from occurring help doctors meet their centrally fixed targets. At 72.8 abortions per 100 births, Cuba has one of the highest abortion rates in the world. If only 5% of the abortions are actually pressured abortions meant to keep health statistics up, life expectancy at birth must be lowered by a sizeable amount. If we combine the misreporting of late fetal deaths and pressured abortions, life expectancy would drop by between 1.46 and 1.79 years for men. In Figure 1 below, we show that that with this adjustment alone, instead of being first in the ranking of life expectancy at birth for men in Latin America and the Caribbean, Cuba falls either to the third or fourth place depending on the range (pg. 755-756).

The researchers explain, “Other repressive policies, unrelated to health care, contribute to Cuba’s health outcomes” (pg. 756) These include:

  • Restrictions in car ownership leading to low automobile fatalities.
  • Rationing combined with physically demanding transportation (e.g., cycling) contributing to reductions in obesity and deaths caused by diabetes, coronary heart diseases and strokes.

The researchers conclude,

Cuban mortality and longevity statistics appear impressive. They are a result of some combination of the government’s choice to allocate more resources into the health care industry (at the expense of other industries that could produce needed goods) and from coercive measures through both health delivery and economic planning that improve health statistics at the expense of other spheres of life.

Although the USA and other countries re-examine how to design health care delivery they should not uncritically accept the myth that the Cuban health care system has been the sole, or even the most important, cause of Cuba’s abnormally high longevity statistics. The role of Cuban economic and political oppression in coercing ‘good’ health outcomes merits further study (pg. 756).

The Effects of Corporate Taxes on Innovation

Image result for innovation

I’ve looked at some of the negative effects of corporate taxes in previous posts. These largely had to do with wages and employment. But a new study based on Chinese data finds that they can have negative effects on innovation:

Theoretically, taxes can have either positive or negative impacts on firm innovation. On the one hand, lower taxes can increase the after-tax profit of firms, so that they have better capacity to invest in new technologies or products. Moreover, lower taxes may reduce the resources that firms spend on tax evasion, such as the costs of bribing tax officers, which can be instead used on innovation activities. On the other hand, lower taxes may also have a negative impact on innovation because they decrease government revenue, and in turn may reduce government spending on public goods such as research, education, and infrastructure. As a result, whether providing tax incentives can improve firm innovation is ambiguous. 

In a new study, we investigate the impact of taxes on firm innovation using a natural experiment in China (Cai et al. 2018). In November 2001, China implemented a tax collection reform on all manufacturing firms established on or after January 2002, which switched the collection of corporate income taxes from the local tax bureau to the state tax bureau. After the reform, similar firms established before or after 2002 could pay very different effective tax rates because of the differences in the management and incentives of those two types of tax bureaus…[T]he reform changed the enforcement of tax collection, resulting in a reduction of effective corporate income tax rates by almost 10% among newly established firms.

…To test the impact of taxes on innovation, we combine a comprehensive dataset of all medium and large enterprises in China between 1998 and 2007 with patent data from the State Intellectual Property Office (SIPO), including all patents applied in China by the year 2014. We use the data to measure three dimensions of innovation activities – input (R&D expenditure and skilled labour ratio), output (number of patent application), and quality (type and characteristics of patent application). 

Our analysis yields several interesting results. First, we show a strong and robust causal relationship between tax rate and firm innovation. Decreasing the effective tax rate by one standard deviation (0.01) increases the average number of patent application by a significant 5.7% (see Figure 2 for the graphical evidence). The reform also stimulated R&D expenditures and increased the skilled-labour ratio by 14%. Second, a lower tax rate also improves the quality of patents. The impact of tax reform on patent applications mainly comes from its effect on invention and utility patents – decreasing the effective tax rate by one standard deviation improves the probability of having an invention patent application by 4.4% and increases the number of utility patent applications by 4.7%. This suggests that the improvement in innovation outcomes is not merely driven by the low-quality design patents. We also use the detailed information on patent applications as proxies for the patent quality, including number of claims, number of independent claims, and the amount of effort that was spent on the patent application (length of the application document, number of figures, and length of abstract). In our patent data, only invention and utility patents have the above information, and results suggest that a reduction in the tax rate significantly improved patent quality, and the effect is significant for both invention and utility patents. 

Another study drawing on datasets from the 20th century had similar results:

We use new data from the 20th century to show a negative effect of high taxes on innovation. We use three newly constructed datasets consisting of: (1) the universe of corporate and non-corporate inventors who patented since 1920, as well as the citations to their patents; (2) the patents, research employment, and location of laboratory facilities of firms active in R&D; and (3) an historical state-level database of corporate income taxes linked to personal income tax rates from Bakija (2017).

…At the macro level, we find that the effects of taxes are strongly negative and quantitatively important. For example, a one percentage point increase in either the median or top marginal tax rate is associated with an approximately 4% decline in patents, citations, and inventors, and a close to 5% decline in the number of superstar inventors in the state. A one percentage point higher top corporate tax rate leads to around 6-6.3% fewer patents, 5.5-6% fewer citations, 4.6-5% fewer inventors, and 8.5-9.3% fewer superstar inventors.

Furthermore, we find that the share of patentsassigned to corporations appears to be extremely sensitive to the corporate tax rate. A one percentage point increase in the top corporate tax rate is associated with close to 1.2 percentage points fewer patents assigned to companies.      

Individual case studies of tax regime changes underscore how important the effect of taxation could be. As one example, Figure 4 shows the depressing impact on innovation of Michigan’s 1967 and 1968 tax reform bills. In 1967, Michigan introduced its personal income tax, at a rate of 2.6%. In 1968, it then introduced its corporate income tax, at a rate of 5.6%. In the subsequent years, the state experienced a substantial decline in innovative output relative to its peer states.

…At the micro level, we similarly find that taxation negatively affects innovation. To estimate the effect, we assign inventors to their tax brackets based on their productivity, which we observe in the patent data. A one percentage point higher tax rate at the individual level decreases the likelihood of having a patent in the next three years by 0.63 percentage points, even controlling for inventor quality and all other state-level policy changes. The likelihood of having high-qualitypatents with more than ten citations decreases by 0.6 percentage points for every percentage point increase in the personal tax rate. We also show that corporate inventors — inventors who appear on at least one patent assigned to a company — are much more responsive to personal and corporate income taxes than non-corporate inventors, consistent with the profit-sharing narrative posited above, as well as with different motives for innovation. 

Inventors prefer to locate in places where other inventors are active in their particular technology area. This suggests there are particular characteristics which may matter to inventors, and which can ultimately dampen their responses to taxation. Silicon Valley, for example, still attracts an abundance of tech inventors due to its rich network of capital and labour resources for innovation, despite California being a high tax state.          

At the firm level, we find consistently negative effects of taxation on patents and citations. We also find that the top corporate tax rate has a significantly negative effect on the decision of a firm to locate its R&D laboratory in a given state.

Innovation is critical to improvements in human well-being. Something for policymakers to consider.

The Benefits of Walmart

Image result for walmart

Walmart catches a lot of grief. For example, as reported by CNN, Bernie Sanders recently “introduced a bill, titled the Stop Walmart Act, that would prevent large companies from buying back stock unless they pay all employees at least $15 an hour, allow workers to earn up to seven days of paid sick leave and limit CEO compensation to no more than 150 times the median pay of all staffers.” Yet, many don’t consider the massive benefits produced by Walmart: 

A 2005 Global Insight study commissioned by Wal-Mart and overseen by an independent panel suggested that a new Wal-Mart would create, on net, 137 jobs in the short term and 97 jobs in the long term (Global Insight 2005: 2). Studying Pennsylvania counties, Hicks (2005, discussed by Vedder and Cox 2006: 110) found that the company led to a net increase of fifty new jobs with a 40% reduction in job turnover. Hicks (2007: 93-94) uses data from Indiana to estimate that Wal-Mart increases rural retail employment from 3.4% to 4.8% after correcting for endogeneity. After correcting for endogeneity of urban Wal-Mart entry, Hicks argues that Wal-Mart leads to a 1.2% increase in employment but points out that this estimate is statistically insignificant.

…Wal-Mart’s most obvious effect on the retail sector comes through its policy of Every Day Low Prices. Basker (2005b) and Basker and Noel (2009) estimate that WalMart has a substantial price advantage over competitors with the effect being that prices among incumbent competitors fall after Wal-Mart entry. Hausman and Leibtag (2007: 1147) argue that the compensating variation from Big Box retailers’ effect on prices leads to welfare increases of some 25% of total food expenditure for people who enjoy the direct and indirect effects of Big Box stores. Further, they argue (Hausman and Leibtag 2009) that the Consumer Price Index is over-estimated because it fails to account properly for price effects of supercenters, mass merchandisers, and club stores. Evaluating estimates of the price effects of Big Box retailers and adjusting for foreign sales, Vedder and Cox (2006: 18-19) argue that “the annual American-derived welfare gains are probably still in excess of $65 billion, or about $225 for every American, or $900 for a typical family of four.”

…Jason Furman (2005) called Wal-Mart a “progressive success story” because of its impact on prices. He notes that if the 2005 Global Insight estimate of annual average household savings of $2,329 is accurate, the annual Wal-Mart related consumer savings of $263 billion dwarfs Wal-Mart-generated reductions in retail wages of $4.7 billion estimated by Dube et al. (2005). Hicks (2007: 82) notes that reductions in nominal retail wages are likely offset by larger price reductions, which translates into higher real wages. Courtemanche and Carden’s (2011a) estimate of $177 per household in savings attributable to the effects of Wal-Mart Supercenters in 2002 multiplied by the 105,401,101 households in the 2000 census yields household savings of $18.7 billion, which is still substantially higher than Dube et al.’s estimate of lost wages. 

Hausman and Leibtag (2007: 25) argue that the compensating variation—i.e., welfare increase—attributable to supercenters, mass merchandisers, and club stores is some 25% of food expenditures. Since poorer households spend more of their income on food, the effect (as a percentage of income) is higher toward the bottom of the income distribution (Furman 2005: 2-3). Hausman and Leibtag (2007: 1172, 1174) further argue that compensating variation from access to non-traditional retailers is higher at lower income levels, which would make the effect even more progressive (pgs. 8-9).[ref]This doesn’t even address the overseas benefits.[/ref]

A brand new study demonstrates even more benefits provided by Walmart:

We estimate the effects that Walmart Supercenters have on food security using data from the 2001–2012 waves of the December Current Population Study Food Security Supplement (CPS-FSS). Narrow geographic identifiers available in the restricted version of these data enable us to compute the distance from each household’s census tract to the nearest Walmart Supercenter. Our outcomes are counts of the number of affirmative responses on the household and child-specific portions of the food insecurity questionnaire, along with binary variables for household food insecurity, household very low food security, child food insecurity, and child very low food security. We estimate instrumental variables (IV) models that leverage the predictable geographic expansion patterns of Walmart Supercenters outward from corporate headquarters. Specifically, we instrument for Walmart Supercenters with the interaction of distance from Bentonville, Arkansas (Walmart’s headquarters), with time. For both households in general and children specifically, the results show that a closer proximity to the nearest Walmart Supercenter leads to sizeable and statistically significant improvements in all food security measures except the indicator for very low food security. Subsample analyses reveal that the effects are especially large for low-income households and children, though they are also sizeable for middle-income children.

As journalist John Tierney asked, “How could any progressive with a conscience oppose an organization that confers such benefits?”

What Drives Political Violence?

Image result for political violence

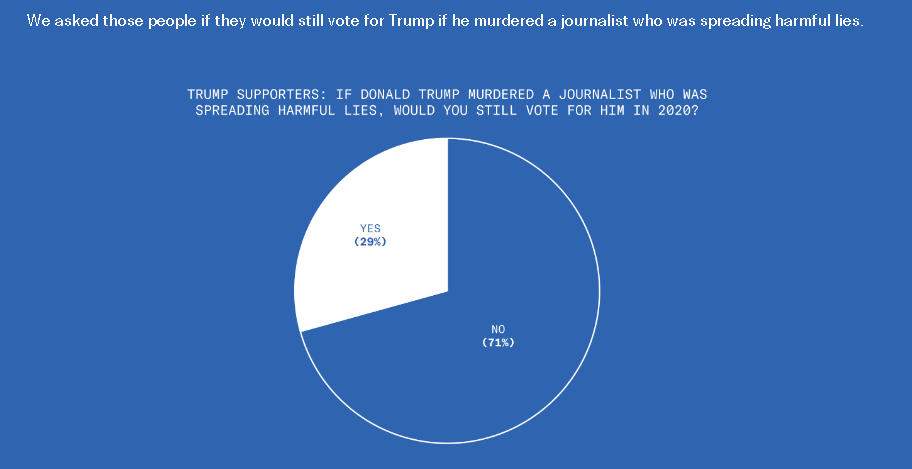
This is disturbing, if not really all that surprising. From the Greater Good Science Center:

Earlier this year, political scientists Lilliana Mason and Nathan Kalmoe presented a paper at the American Political Science Association’s annual meeting, titled “Lethal Mass Partisanship.” With data from two different national surveys, they found that 24 percent of Republicans and 17 percent of Democrats believe that it is occasionally acceptable to send threatening messages to public officials. Fifteen percent of Republicans and 20 percent of Democrats agree that the country would be better if large numbers of opposing partisans in the public today “just died,” which the authors call a “shockingly brutal sentiment.” Nine percent of both Democrats and Republicans agree that violence would be acceptable if their opponents won the 2020 presidential election.

So drives political violence? First and foremost, aggression:

By far the biggest predictor of lethal partisanship across the board was having aggressiveness as a personality trait. This isn’t surprising, of course—aggression and violence go hand in hand. But a deeper look at aggression reveals how it fits together with other traits and shapes human behavior. Aggression all by itself is not good or bad; any of us can become aggressive when we face a direct threat. But aggression can go too far when inner and outer restraints are absent.

In neurological studies, more aggressive people tend to show less activation of the default mode brain network, which is associated with empathy and emotion regulation, which in turn helps suppress aggressive impulses. As psychologist Scott Barry Kaufman notes in Scientific American, aggressive people are more likely to retaliate when treated unfairly by others, which is not necessarily a bad thing (“although they tend to care much less about whether others are treated unfairly”).

However, aggression also shapes political outcomes. “Politicians who are more antagonistic get more media attention and are more often elected than more agreeable politicians,” he writes. “In the general population, antagonistic people are more likely to distrust politics in general, to believe in conspiracy theories, and to support secessionist movements.” In a series of experiments published in 2014, Kalmoe found “that exposure to mildly violent political metaphors such as ‘fighting for our future’ increased general support for political violence among people with aggressive personalities.”

Next, party identity:

After aggressiveness, Mason and Kalmoe found that “partisan identity strength”—how much being Democrat or Republican is part of who they are—is the most important factor in endorsing violence.

There are many studies—mostly from political science and sociology—showing that more Americans are using their political party affiliation as a source of meaning and social identity, with these identities linked to differences in “leisure activities, consumption, aesthetic taste, and personal morality,” as Daniel DellaPosta and colleagues write in their 2015 paper, “Why Do Liberals Drinks Lattes?

Worse, the Republican Party has become whiter in recent decades, while the Democratic Party has become more racially diverse—which could be intensifying party antagonism. A recent study of survey data by political scientist Diana Mutz found that nothing predicted support for Donald Trump more than a feeling of threatened status among white Christians—an insight ratified by several studies from Robb Willer at Stanford Universityand the Public Religion Research Institute.

…“All of the research to date was pointing in this direction,” adds Mason in an interview. “But we have a long tradition of treating partisanship like a largely benevolent force. It makes sense that as an identity grows stronger, and conflict intensifies, people will begin to approve of violence.”

Third, emotions like anger, contempt, and disgust:

While Mason and Kalmoe’s study gives us some sense of how common the tendency to accept political violence is—and some of the personality traits and belief structures that may be associated with it—a 2015 study points us in the direction of the emotions involved. In “The Role of Intergroup Emotions in Political Violence,” San Francisco State University researchers David Matsumoto and Hyisung C. Hwang and the University at Buffalo’s Mark G. Frank tried to figure out which emotions can drive violence by a group against an outgroup.

They examined the emotional tone of major political speeches that occurred prior to political events throughout history, looking at the emotions expressed in words, the judgments underlying the emotions, and the nonverbal expression of the emotions that could be seen in video form.

They also examined speeches made by “ideologically driven” leaders who despised opponent outgroups that resulted in violence, such as Hitler’s; and they studied those that did not, like Gandhi’s Salt March and pro-Tibet protests at the Beijing Olympics in 2008.

They found that speeches which preceded violent events tended to express more anger, contempt, and disgust (ANCODI)—but not fear, happiness, sadness, or surprise. These negative emotions tended to target specific “outgroups”—Jews, in the case of Hitler’s speeches.

Fourth, moralizing language:

Earlier this year, a team of five researchers searched the popular social media platform Twitter for tweets about the Baltimore protests. They wanted to investigate “moralizing” tweets—that is, tweets that viewed the protests as a moral issue rather than as a political disagreement. A moralizing tweet might, for example, refer to people as “disgusting” or “evil” or “traitorous.”

In fact, they did find a positive association between the number of moral tweets and the occurrence of violent protests (gauged with arrest data). “The days in which there were violent protests, we saw that there was a lot more moral language being used,” says study co-author and University of Southern California Ph.D. student Joe Hoover. “Which was consistent with the idea that morality and violence in these contexts might be linked.”

The team also ran an experiment using another prominent protest marred by violence: the far-right rally in Charlottesville, Virginia, in 2017. Respondents were asked to what extent they thought protesting against the far-right demonstrators was a moral issue; they were then asked how acceptable it was to use violence against these far-right activists. What they found is that people were more likely to embrace violence the more they saw it as a moral issue.

In an additional experiment, the participants were given the same prompts, but they were told either that the majority of Americans agreed with their view of the protest, or that few Americans agreed with their view. They found that “moralization predicted violence only when participants perceived that they shared their moralized attitudes with others.”

In other words, when it comes to violence, there’s validation and safety in numbers. The researchers dubbed this phenomenon “moral convergence,” when many people come together around a strong idea of what’s right and what’s wrong. The “risk of violent protest, in other words, may not be simply a function of moralization, but also the perception that others agree with one’s moral position, which can strongly be influenced by social media dynamics,” they write. 


Finally, group leadership:

There are many, many studies—starting with Stanley Milgram’s classic electric-shock experiments—which show that people are much more likely to inflict pain on others when an authority figure tells them to. When leaders engage in violent rhetoric, so do their followers; when they urge calm, people do calm down. Research has documented that words do have an impact on both beliefs and behaviors.

For example, a 2017 Polish study found “frequent and repetitive exposure to hate speech leads to desensitization to this form of verbal violence and subsequently to lower evaluations of the victims and greater distancing, thus increasing outgroup prejudice.” As part of the study, researchers surveyed participants on how frequently they encountered hate speech against refugees; they found that those who were more exposed to hateful words were more prejudiced against the group and more accepting of restrictive immigration policy.

Taken together, these studies suggest that our political leadership—everyone from pundits on cable news to the President of the United States—would do well to avoid promoting the political tribalism that leads people to strongly identify with one group and demonize the other.

In short, watch your aggression, avoid identity politics, keep your emotions in check, lay off the moral grandstanding, and quit putting so much stock into political leaders and pundits.

Economic Growth and Corruption

In my latest paper in Economic Affairs, I wrote,

Drawing on the EFW Index, Brennan (2016a)…points to a strong positive correlation between a country’s degree of economic freedom and its lack of public sector corruption. Granted, a lack of corruption could very well give rise to market reforms and increased economic freedom instead of the other way around. However, recent research on China’s anti-corruption reforms (Ding et al. 2017; Li et al. 2017) suggests that markets may actually pave the way for anti-corruption reforms (pg. 425).

Furthermore,

Market liberalisation can also have indirect effects on war and violence. For example, Neudorfer and Theuerkauf (2014) explore the effects of public sector corruption on ethnic violence by analysing 81 to 121 countries between 1984 and 2007. They find that corruption has a robust positive effect…on the risk of ethnic civil war. When the evidence provided in the previous sections by Brennan (2016a) and Lin et al. (2017) is considered, we find that market liberalisation deters corruption and, consequently, ethnic violence (pg. 429).

Research suggests that economic growth may reduce corruption:

The traditional explanation for this relationship has been the theory articulated by Wolfenson above – corruption increases the cost and risk of business activity, thereby deterring investment and depressing growth that could have lifted citizens out of poverty (Mauro 1995, Wei 1999).

However, there is an alternative possibility that has received less attention among development practitioners and academics. The strong relationship between income and growth may result from exactly the opposite causal relationship – countries may be growing out of corruption (Tresiman 2002). Over time, economic growth reduces both the incentives for government officials to extract bribes and firms’ willingness to pay them. Some scholars of developed countries have discussed this possibility in terms of a ‘life cycle’ theory with corruption peaking at early stages of development and declining as countries industrialise (Huntington 1968, Theobald 1990, Ramirez 2013). However, there has been little work either testing for this empirical link from growth to corruption, or laying out the specific mechanisms that could generate the link.

The authors continue:

The key theoretical insight of our argument is that the share of bribes that officials will choose to extract as rents depends on a firm’s ability to move and set up business in a different location. Ask for too much, and firms that have the ability to do so, will simply pull up anchor and head to safer harbours. Because officials know this, they are likely to set a bribe amount that is just below the cost of moving.

Building on that insight, we show that as firms grow the cost of moving should decline relative to firm size. The fixed cost of moving becomes less expensive relative to revenue, and more and more firms have the opportunity to escape the bribe requests of officials in their locality. Corrupt officials faced with a sudden growth surge must lower their bribe rates, or face losing their key providers of employment and tax payers to competitors.

…The theory we propose has important policy implications. To the extent this theoretical mechanism is important, rather than focusing on politically difficult institutional changes to combat corruption, resources might be better spent on policies that facilitate capital mobility across subnational jurisdictions. Providing clear titles to business premises, for instance, enables entrepreneurs to sell and recoup the full market value of land. Such businesses are more mobile than renters or owners with insecure titles, who risk significant losses if they try to escape corruption by fleeing across the border.

Drawing on “an annual survey funded by USAID and administered by the Vietnamese Chamber of Commerce and Industry,” the researchers find “that the average bribe rate decreases as GDP per capita increases” and “that large firms actually pay lower bribe rates, which is what our theory predicts. Firms with higher revenues are more put out by a high bribe rate, since it increases the amount of bribes they must pay dramatically. To retain them then, officials must push their bribe rate lower.” 

Then, using “a census of firms conducted by Vietnam’s General Statistical Office (GSO) [to] calculate aggregate employment at the province-industry-year level,” the authors

show that exogenous industry-wide performance is indeed a strong predictor of a firm’s performance. A doubling of total employment in the industry is associated with a 1.6 percentage point reduction in the bribe rate, or about 42% of the mean level. Moreover, the effect is more pronounced for highly mobile firms. The magnitude of the effect of growth on bribe reductions is 17% larger for firms in possession of a Land Use Rights Certificate, which facilitates the sale of their business premises. Similarly, the effect is 20% greater for firms that already have branch operations in other provinces, and therefore possess knowledge and experience that could facilitate movement.

These effects survive a battery of robustness tests and alternative specifications, providing compelling evidence that growth can directly reduce corruption.

In short, economic growth can decrease corruption by undermining the power of officials to extract bribes. But this is likely part of a virtuous feedback loop. For example, a 2017 paper 

exploit[s] spatial variation in randomized anti-corruption audits related to government procurement contracts in Brazil to assess how corruption affects resource allocation, firm performance, and the local economy. After an anti-corruption crackdown, regions experience more entrepreneurship, improved access to finance, and higher levels of economic activity. Using firms involved in corrupt business with the municipality, we find that two channels explain these facts: allocation of resources to less efficient firms, and distortions in government dependent firms. The second channel dominates, as after the audits government dependent firms grow and reallocate resources within the organization (pg. 31). 

As I state in the beginning of my paper,

Of course, it is far easier to demonstrate correlation than causation, and while some studies do find markets playing a causal role in moral development, most simply establish a positive relationship. However, findings that ‘merely’ demonstrate positive correlations should be interpreted in light of the feedback loops: even if moral behaviours are foundational and give rise to market systems (instead of vice versa), market systems in turn reinforce these virtues by imbuing them with value. As Paul Zak (2011, p. 230) explains, ‘Markets are moral in two senses. Moral behavior is necessary for exchange in moderately regulated markets, for example, to reduce cheating without exorbitant transaction costs. In addition, market exchange itself can lead to greater expression of morals in nonmarket settings’ (pg. 423).

Texico: The Texas-Mexico Economy

Michael Cox and Richard Alm of SMU’s O’Neil Center have an essay in D Magazine based on the latest report from the Center. The two

imagine Texas and Mexico as one economy, connected by exports, imports, migration, cross-border business investments, transport infrastructure, tourism, and knowledge transfers. As a combined economy, Texas and Mexico churn out an annual GDP of more than $4 trillion, enough to rank as the world’s sixth-largest economy, just behind Germany and ahead of Russia.

We denote this sprawling and diverse economy by the portmanteau word: Texico. The name captures the reality that over the past quarter-century the Texas and Mexico economies have emerged as highly integrated, making an often-unsung contribution to Texas’ reign as America’s top-performing state economy.

The explain how trade has deeply integrated the two countries: 

An often-cited gauge of integration is trade—exports moving south, imports moving north. They totaled $188 billion last year, or more than 11 percent of gross state product, separating Texas from all other states in doing business with Mexico.

Texas companies are finding business opportunities in Mexico—among them, cosmetics-maker Mary Kay Inc. and telecommunications giant AT&T Inc., both based in Dallas-Fort Worth. At the same time, Mexican companies are heading northward and expanding their businesses, including Mission Foods in Irving and the movie theater chain Cinépolis in Addison.

The Texas and Mexico economies are more formidable combined rather than separate. Binational supply chains, for example, take advantage of low production costs in Mexico and highly skilled professional labor in Texas. The companies emerge more competitive in the global marketplace, able to sell their wares at a better price.

Automobile production comes to mind—for good reason. Plants in the Dallas-Fort Worth area are on the northern edge of the Texas-Mexico Automotive SuperCluster region, which includes close to 30 assembly plants and more than 230 parts suppliers in Texas and Mexico’s northern states.

Texas and Mexico have already profited a great deal from their binational economy, even though work began in earnest only recently. Mexico didn’t open its energy and telecom markets until just a few years ago. During negotiations that led to the North American Free Trade Agreement, Mexico clung to its monopolies in these industries. With its oil output falling, Mexico finally lifted its ban on foreign oil and gas companies three years ago. If all goes well, this should be a bonanza for Texas, with its deep roster of oilfield services and exploration companies. The telecom monopoly expired about the same time—and AT&T rushed in with its wireless service.

The annual report provides a few more interesting insights:

The report explains the slow convergence above: “Other factors like low levels of education shouldn’t be ignored, but the ongoing plague of corruption, cronyism and rising violence go a long way toward explaining why Mexican growth and income haven’t converged with the United States or kept pace with the likes of Chile, South Korea and China” (pg. 13). 

Cox and Alm conclude,

Texans are well aware of Mexico’s shortcomings, including corruption and drug-cartel violence. None of these problems will get any better by enacting policies that build barriers against Mexico and harm the Texas and Mexico economies. Perhaps Trump and Obrador will decide that the best course lies in expedient practicality—recognizing the fact that Texico has been working and building a large constituency. If these two leaders don’t make a mess of things, the businesses of Texas and Mexico can take it from there.

The Psychology of Voting

I’ve already provided the actual data on a single vote’s value (reminder: it’s virtually zilch). Despite this fact, plenty of people still vote. Why? The Greater Good Science Center at UC Berkeley has an insightful article on the emotions involved with voting:

Voting is an act of altruism. When you vote, you are taking your personal time and effort to advance the collective good, without any guarantee of personal reward—the very heart of what it means to be altruistic.

…In one study, Panagopoulos sent postcards to a subset of random voters before a special election in New York and before a gubernatorial election in New Jersey. The postcards contained either a message encouraging people to vote or a message thanking them for having voted in a recent election. Then, he compared voting percentages for those two groups to a control group who received no postcards.

His findings showed that voters receiving the gratitude postcard voted significantly more—two to three percentage points more—than those not receiving postcards.

…“Making people feel good by reinforcing the notion that society is grateful for their participation in the political process reminds people that they have a role to play and reinforces their willingness to be responsive,” says Panagopoulos.

…[I]n another experiment, he sent postcards thanking people for political participation, in general—without reference to past voting—while others received either the thanks for voting or the reminder postcards used in the other experiments.

In the Georgia primary election that followed, Panagopoulos found that people who received the generic thank-you postcard were more likely to vote—as much or more so than people being specifically thanked for voting, and much more than those who got the simple reminders. To Panagopoulos, this confirms the idea that gratitude was key.

…In one study, people who received information about their own voting behavior in the past seemed to increase their propensity to vote in an upcoming election. Another study found that people will vote more in an election when they see that people they are close to are voting, and that this behavior can spread through social networks.

These kinds of studies add to a body of research showing that our social relationships and emotions play a significant role in how we vote. For example, one study found that when people are told that they might be recognized for voting in a local newspaper or put on an honor roll of voters—to induce feelings of pride—they vote in higher numbers.

Alternatively, when people are warned that their name will be published in a local newspaper for not voting—to induce feelings of shame—this also increases voting. Shame seems to have even more impact than pride.

Altruism, gratitude, friendships, pride, and shame are just a few reasons people go to the polls.

Inclusive Institutions and the Church

A few months ago, I posted about a new working paper exploring the origins of WEIRD psychology. A brand new job market paper builds on this research:

Political institutions, ranging from autocratic regimes to inclusive, democratic ones, are widely acknowledged as a critical determinant of economic prosperity (e.g. Acemoglu and Robinson 2012, North, Wallis, and Weingast 2009). They create incentives that foster or inhibit economic growth. Yet, the emergence and global variation of growth-enhancing, inclusive political institutions in which people broadly participate in the governing process and the power of the elite is constrained, are not well understood. Initially, inclusive institutions were largely confined to the West. How and why did those institutions emerge in Europe?

This article contributes to the debate on the formation and global variation of inclusive institutions by combining and empirically testing two long-standing hypotheses. First, anthropologist Jack Goody (1983) hypothesized that, motivated by financial gains, the medieval Catholic Church implemented marriage policies—most prominently, prohibitions on cousin marriage—that destroyed the existing European clan-based kin networks. This created an almost unique European family system where, still today, the nuclear family dominates and marriage among blood relatives is virtually absent. This contrasts with many parts of the world, where first- and second-cousin marriages are common (Bittles and Black 2010). Second, several scholars have hypothesized that strong extended kin networks are detrimental to the formation of social cohesion and affect institutional outcomes (Weber, 1958; Todd, 1987; Augustine, 1998). Theologian Augustine of Hippo (354–430) pointed out that marrying outside the kin group enlarges the range of social relations and “should thereby bind social life more effectively by involving a greater number of people in them” (Augustine of Hippo, 354-430 / 1998, p. 665). More recently, Greif (2005), Greif and Tabellini (2017), Mitterauer (2010), and Henrich (forthcoming) combined these two hypotheses and emphasized the critical role of the Church’s marriage prohibitions for Europe’s institutional development (pg. 2).

His findings?:

The analysis demonstrates that already before the year 1500 AD, Church exposure and its marriage regulations are predictive of the formation of communes—self-governed cities that put constraints on the executive. The difference-in-difference analysis does not reveal pre-trends and results are robust to many specifications. They hold within historic political entities addressing concerns that the relation is driven by other institutional factors and when exploiting quasi-natural experiments where Church exposure was determined by the random outcomes of medieval warfare. Moreover, exploiting regional and temporal variation in marriage regulations suggests that the dissolution of kin networks was decisive for the formation of communes.

The study also empirically establishes a robust link between Church exposure and dissolution of extended kin networks at the country, ethnicity and European regional level. A language-based proxy for cousin marriage—cousin terms—offers a window into the past and rules out that the dissolution was driven by more recent events like the Industrial Revolution or modernization. Moreover, the study reports a robust link between kin networks, civicness and inclusive institutions. The link between kin networks and civicness holds within countries and—getting closer to causality—among children of immigrants, who grew up in the same country but vary in their vertically transmitted preference for cousin marriage. Kin networks predict regional institutional failure within Italy, ethnicities’ local-level democratic traditions and modern-day democratic institutions at the country level. Measures for the strength of pre-industrial kin networks rule out contemporary reverse causality or the possibility that the estimates are driven by contemporary omitted variables. The analysis also demonstrates that the association between kin networks and the formation of inclusive institutions holds universally—both within Europe and when excluding Europe and countries with a large European ancestry. This universal link strengthens the hypothesis that the Church’s marriage regulations, and not some other Church-related factor, were decisive for European development.

Underlying these early institutional developments was most likely a psychology that, as a consequence of dissolved kin networks, reflects greater individualism and a more generalized, impartial morality (Schulz et al. 2018). This is a building block not only for inclusive institutions but also for economic development more generally. For example, transmission of knowledge across kin networks and the shift away from a collectivistic culture toward an individualistic one, a culture of growth, may have further contributed to Europe’s economic development (Mokyr, 2016; de la Croix, 2018).

…To build strong, functional, inclusive institutions and to foster democracy, the potentially deleterious effect of dense kin networks must be considered. Also, simply exporting established formal institutions to other societies without considering existing kin networks will likely fail. Policies that foster cooperation beyond the boundaries of one’s kin group, however, have a strong potential to successfully diminish the fractionalization of societies. These can be policies that encouraging marriages across kin groups. More generally, policies that foster interactions that go beyond the boundaries of in-groups such as family, close friends, social class, political affiliation or ethnicity are likely to increase social cohesion (pg. 41-42).