I’m sure most of you have heard about the controversial Google Memo making the rounds throughout the media. Social psychologists Sean Stevens and Jonathan Haidt provide an excellent source[ref]Thanks to Megan Conley for linking to this on Facebook.[/ref] for those interested in browsing the academic literature on the subject. They provide both supportive and critical responses[ref]Update: Add this to the critical pile.[/ref] to the memo as well as highlight findings within the research that both agree and disagree with the memo’s assertions. Overall, they conclude,
1. Gender differences in math/science ability, achievement, and performance are small or nil.* (See especially the studies by Hyde; see also this review paper by Spelke, 2005). The one exception to this statement seems to be spatial abilities, such as the ability to rotate 3-dimensional objects in one’s mind. This ability may be relevant in some areas of engineering, but it’s not clear why it would matter for coding. Thus, the large gender gap in coding (and in tech in general) cannot be explained as resulting to any substantial degree from differences in ability between men and women.
2. Gender differences in interest and enjoyment of math, coding, and highly “systemizing” activities are large. The difference on traits related to preferences for “people vs. things” is found consistently and is very large, with some effect sizes exceeding 1.0. (See especially the meta-analyses by Su and her colleagues, and also see this review paper by Ceci & Williams, 2015).
3. Culture and context matter, in complicated ways. Some gender differences have decreased over time as women have achieved greater equality, showing that these differences are responsive to changes in culture and environment. But the cross-national findings sometimes show “paradoxical” effects: progress toward gender equality in rights and opportunities sometimes leads to larger gender differences in some traits and career choices. Nonetheless, it seems that actions taken today by parents, teachers, politicians, and designers of tech products may increase the likelihood that girls will grow up to pursue careers in tech, and this is true whether or not biology plays a role in producing any particular population difference. (See this review paper by Eagly and Wood, 2013).
When it comes to the motivations behind redistribution, it turns out that fairness has little to do with it. Instead, researchers find[ref]Full access here.[/ref] that compassion, envy, and self-interest are the main drivers. From the abstract:
Why do people support economic redistribution? Hypotheses include inequity aversion, a moral sense that inequality is intrinsically unfair, and cultural explanations such as exposure to and assimilation of culturally transmitted ideologies. However, humans have been interacting with worse-off and better-off individuals over evolutionary time, and our motivational systems may have been naturally selected to navigate the opportunities and challenges posed by such recurrent interactions. We hypothesize that modern redistribution is perceived as an ancestral scene involving three notional players: the needy other, the better-off other, and the actor herself. We explore how three motivational systems—compassion, self-interest, and envy—guide responses to the needy other and the better-off other, and how they pattern responses to redistribution. Data from the United States, the United Kingdom, India, and Israel support this model. Endorsement of redistribution is independently predicted by dispositional compassion, dispositional envy, and the expectation of personal gain from redistribution. By contrast, a taste for fairness, in the sense of (i) universality in the application of laws and standards, or (ii) low variance in group-level payoffs, fails to predict attitudes about redistribution.
Let’s dive into the details:
We conducted 13 studies with 6,024 participants in four countries to test the hypothesis that compassion, envy, and self-interest jointly predict support for redistribution. Participants completed instruments measuring their (i) support for redistribution; (ii) dispositional compassion; (iii) dispositional envy; (iv) expected personal gain or loss from redistribution (our measure of self-interest); (v) political party identification; (vi) aid given personally to the poor; (vii) wealthy-harming preferences; (viii) endorsement of procedural fairness; (ix) endorsement of distributional fairness; (x) age; (xi) gender; and (xii) socioeconomic status (SES) (pg. 8422).
The results?:
To test this prediction, we regressed participants’ support for redistribution simultaneously on their dispositional compassion, their dispositional envy, and their expected personal gain (or loss) from redistribution. As predicted, the three motives have positive, significant, and independent effects on support for redistribution. This is true in the four countries tested: the United States (US) (study 1a), India (IN) (study 1b), the United Kingdom (GB) (study 1c), and Israel (IL) (study 1d)—standardized regression coefficients (β values): compassion, 0.28–0.39; envy, 0.10–0.14; self-interest, 0.18–0.30. Jointly, these motives account for 13–28% of the variance in support for redistribution. Adding to the regression models age and gender, or age, gender, and S[ocio]E[conomic]S[tatus], does not appreciably alter the effect of the emotion/motivation triplet, or the total variance accounted for. We note that age did not have significant effects in any country. Gender had significant effects in the United States and the United Kingdom (females more opposed to redistribution), but not in India or Israel. SES had a significant (negative) effect in the United Kingdom, but not in the other countries (Ibid.).
Unsurprisingly, in the U.S. “self-described Democrats endorsed redistribution to a greater extent than Republicans and Libertarians did. Democrats also reported more compassion and more expected personal gain from redistribution than Republicans and Libertarians did; envy did not differ by party” (Ibid.). Interestingly enough, “dispositional compassion was the only reliable predictor of giving aid to the poor” in all four countries. However, “support for government redistribution was not a unique predictor of personally aiding the poor in the regressions…Support for government redistribution is not aiding the needy writ large—in the United States, data from the General Social Survey indicate that support for redistribution is associated with lower charitable contributions to religious and nonreligious causes” (Ibid.).
Compassion
Now consider these absurd answers from the survey respondents:
Participants in the United States, India, and the United Kingdom (studies 1a–c) were given two hypothetical scenarios and asked to indicate their preferred one. In one scenario, the wealthy pay an additional 10% in taxes, and the poor receive an additional sum of money. In the other scenario, the wealthy pay an additional 50% in taxes (i.e., a tax increment five times greater than in the first scenario), and the poor receive (only) one-half the additional amount that they receive in the first scenario. That is, higher taxes paid by the wealthy yielded relatively less money for the poor, and vice versa (63). To clarify the rationale for this trade-off, we told participants that the wealthy earned more when tax rates were low, thereby generating more tax revenue that could be used to help the poor. Fourteen percent to 18% of the American, Indian, and British participants indicated a preference for the scenario featuring a higher tax rate for the wealthy even though it produced less money to help the poor…We regressed this wealthy-harming preference simultaneously on support for redistribution, the emotion/motivation triplet, age, gender, and SES. Dispositional envy was the only reliable predictor (Ibid.).
In short, “Compassion and envy motivate the attainment of different ends. Compassion, but not envy, predicts personally helping the poor. Envy, but not compassion, predicts a desire to tax the wealthy even when that costs the poor” (Ibid.). The cries for fairness, though, have little to do with support for redistribution:
To sum up the set of fairness studies, in predicting support for redistribution, the effect of fairness as a group-wide concern is unreliable and of far smaller magnitude than the effect of the emotion/motivation triplet. This is true whether fairness is operationalized as uniformity in the application of laws and standards or as low (or null) variance in payoffs; whether distributional fairness is assayed between individuals (studies 2a, 2c, S1a, S2a, S2b) or between groups (“the rich,” “the poor”; studies 2b, S1b, S2c, S2d); and whether allocational decisions are hypothetical (studies 2a, 2b, S1a, S1b, S2c, S2d) or consequential (studies 2c, S2a, S2b) (pg. 8423).
So, why do people support redistribution?
They care about the poor and want to help them (Compassion).
A new study suggests that when it comes to the early stages of economic development, education may not play that big of a role. From the ungated version:
The accumulation of human capital is considered as an important determinant in the process of economic growth. Despite a large literature there is still an ambiguity regarding its role in growth as a number of empirical studies have found an insignificant, in some cases even negative, impact of human capital on growth. However, the focus of these studies has been more on issues related to the use of data and methodology and they assume that the impact of human capital is the same across countries.
Using a dynamic threshold model, we show that the reason for the apparent irrelevance of human capital (proxied by average years of schooling) for generating growth in an economy lies with its level of development. This implies that human capital accumulation cannot assert its productive role in the process of growth until an economy crosses a threshold level of development. Our finding remains robust across various tests. What helps human capital to assert its productivity at a higher level of development provides an interesting opportunity for further work (pg. 9).
It seems like the institutions of growth–largely those associated with increased economic freedom–play the most vital role in getting economies off the ground.
A new study looks the demographics of hopefulness in the United States. As the author explains,
Hope is an important channel driving people’s willingness to invest in the future. My early research on well-being work highlights its particular importance for people with less means, for whom making such investments requires a greater sacrifice of current consumption than it does for the rich (Graham et al. 2004). In addition to widening gaps in opportunity, the prosperity gap in the US has led to rising inequality in beliefs, hopes, and aspirations, with those who are left behind economically the least hopeful and the least likely to invest in their futures.
The author points to multiple markers that divide America,
ranging from education levels and job quality to marriage and incarceration rates to life expectancy. Indeed, the starkest evidence of this lack of faith in the future is the marked increase in premature deaths – driven largely but not only by an increase in preventable deaths (such as via suicide and drug over-dose) among middle-aged uneducated whites, as described by Case and Deaton (2017). There are even differences in the words that these two Americas use. Common words in wealthy America reflect investments in health, knowledge acquisition, and the future: iPads and Baby Bjorns, foam rollers and baby joggers, cameras, and exotic travel destinations such as Machu Picchu. The words that are common in poor America – such as hell, stress, diabetes, guns, video games, and fad diets – reflect short-time horizons, struggles, and lack of hope (Leonhardt 2015).
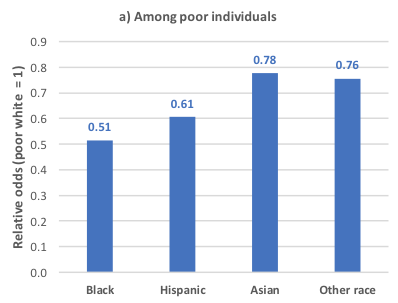
Surprisingly, “poor minorities – and blacks in particular – are much more hopeful than poor whites. Poor blacks are three times as likely to be a point higher on the ten-point optimism scale than are poor whites, while Hispanics are about one and a half times more likely than poor whites. Poor blacks are also half as likely to experience stress – a significant marker of ill-being – on a daily basis as are poor whites, while poor Hispanics are about two-thirds as likely.”
Figure 1: Odds of being on a higher level of optimism, by race group (relative to white), within each income groupFigure 2: Odds of experiencing stress, by race group (relative to white), within each income group
There are various reasons for this:
“One important one is that, despite substantial obstacles, minorities have been gradually narrowing the gaps with whites, at least in terms of education and life expectancy gaps. Minorities are also more likely to compare themselves with parents who were worse off than they are, while blue-collar whites are more likely to compare themselves with parents who were better off – a trend that has been increasing over the past decade, as found by Cherlin (2016).”
“Psychological research points to higher levels of resilience among minorities compared to whites. Assari et al. (2016) find that blacks and Hispanics are much less likely to report depression and/or commit suicide in the face of negative shocks than are whites.”
“More generally, urban places are more hopeful than are rural ones, as are places with higher levels of diversity. In recent research, Sergio Pinto and I find that the same places have healthier behaviours – such as more people who exercise and less who smoke (Graham and Pinto 2017).”
The study is very interesting to say the least. Check it out.
Toward the end of last year, I did a rundown of the data on racial bias and policing. A new study is worth adding to the list. According to its findings,
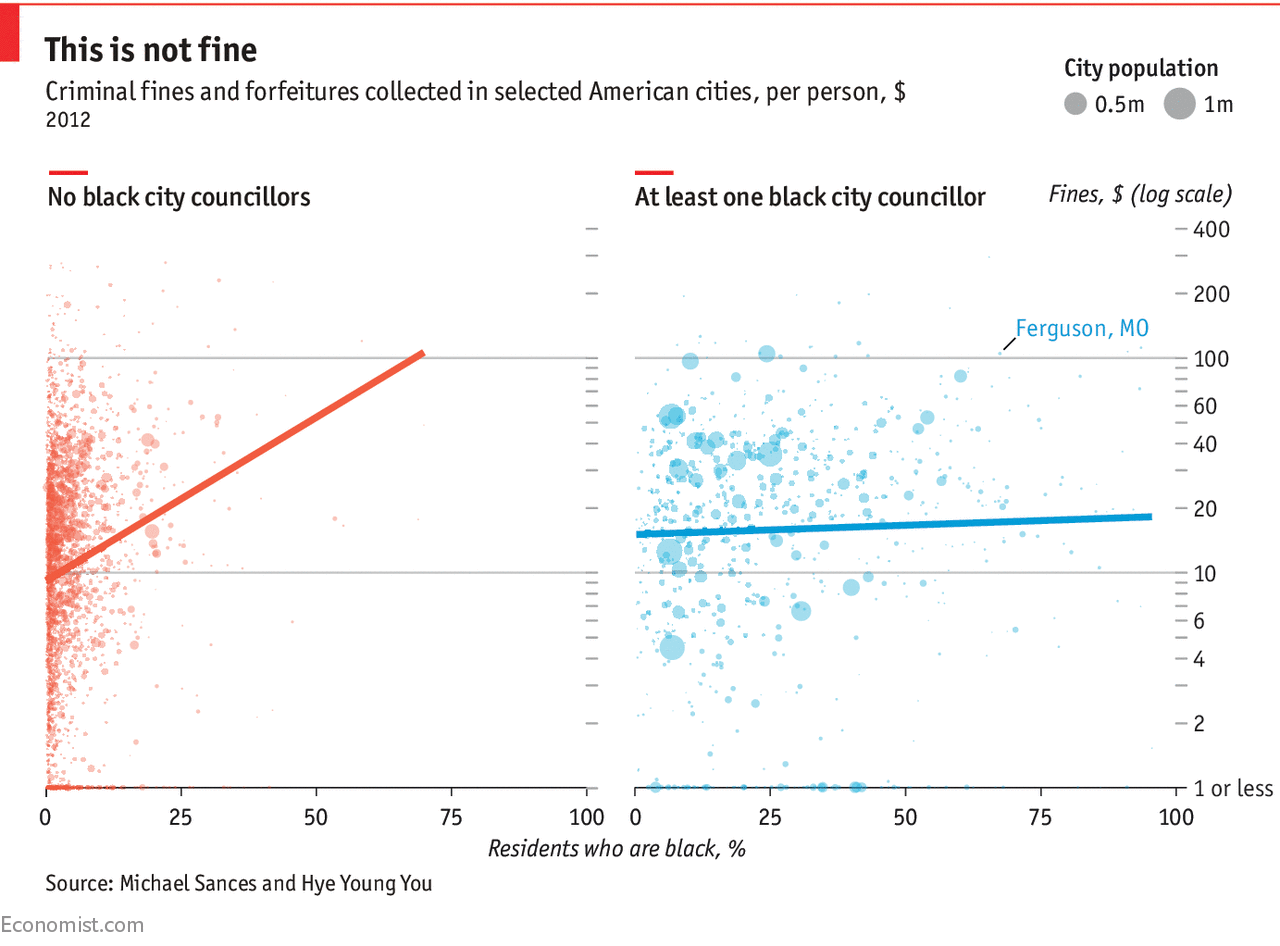
Ferguson was unlikely to be a unique outlier, and other cities engaging in similar practices might well have continued outside of the national spotlight. A new paper by Michael Sances of the University of Memphis and Hye Young You of Vanderbilt University published this month in the Journal of Politics found that Ferguson was indeed more of a rule than an exception. After examining data on 9,000 American cities, they found that those with more black residents consistently collected unusually high amounts of fines and fees—even after controlling for differences in income, education and crime levels. Cities with the largest shares (98%) of black residents collected an average of $12-$19 more per person than those with the smallest (0%) did.
However, there was one subgroup of cities that bucked the trend: the relationship between race and fines was only half as strong in places whose city councils included at least one black member. This may be because black politicians are likelier than white ones are to respond to complaints from black constituents. Black councillors might also intervene to stop certain policies, like increasing court fees, from going into effect to begin with.
What fines are we talking about exactly?
For example, in Peoria, Arizona, two people were jailed for not trimming weeds more than six inches tall. In Ferguson, a black man resting in his car after playing basketball in the public park was stopped by police and charged with, among other things, not wearing a seat belt in his (parked) car and making a false declaration after giving the officer a shortened name (like “Bob” instead of “Robert”). Such fines may fall disproportionately on the backs of black citizens, because they tend to be poorer and lack the resources to contest the penalties.
Despite the exhaustive controls the authors included in their study, the strong correlation they found does not demonstrate decisively that race is the ultimate cause of higher fines. However, it does put a very high burden of proof on researchers arguing that some other factor is responsible. Now that the pattern has been identified across the country, city governments that rely heavily on fines would be well-advised to consider more transparent sources of revenue, and ones that do not place an additional burden on a subset of residents who are already disadvantaged.
Portugal decriminalized the use of all drugs in 2001. Weed, cocaine, heroin, you name it — Portugal decided to treat possession and use of small quantities of these drugs as a public health issue, not a criminal one. The drugs were still illegal, of course. But now getting caught with them meant a small fine and maybe a referral to a treatment program — not jail time and a criminal record.
Whenever we debate similar measures in the U.S. — marijuana decriminalization, for instance — many drug-policy makers predict dire consequences. “If you make any attractive commodity available at lower cost, you will have more users,” former Office of National Drug Control Policy deputy director Thomas McLellan once said of Portugal’s policies. Joseph Califano, founder of the Center for Addiction and Substance Abuse at Columbia University, once warned that decriminalization would “increase illegal drug availability and use among our children.”
But in Portugal, the numbers paint a different story. The prevalence of past-year and past-month drug use among young adults has fallen since 2001, according to statistics compiled by the Transform Drug Policy Foundation, which advocates on behalf of ending the war on drugs. Overall adult use is down slightly too. And new HIV cases among drug users are way down.
Now, numbers just released from the European Monitoring Centre for Drugs and Drug Addiction paint an even more vivid picture of life under decriminalization: drug overdose deaths in Portugal are the second-lowest in the European Union.
Furthermore, “the use of “legal highs” — like so-called “synthetic” marijuana, “bath salts” and the like — is lower in Portugal than in any of the other countries for which reliable data exists. This makes a lot of intuitive sense: why bother with fake weed or dangerous designer drugs when you can get the real stuff? This is arguably a positive development for public health in the sense that many of the designer drugs that people develop to skirt existing drug laws have terrible and often deadly side effects.” In short, “[a]s the Transform Drug Policy Institute says in its analysis of Portugal’s drug laws, “The reality is that Portugal’s drug situation has improved significantly in several key areas. Most notably, HIV infections and drug-related deaths have decreased, while the dramatic rise in use feared by some has failed to materialise.””
Tamlin Conner, a researcher at the University of Otago in New Zealand, and two American researchers analyzed surveys from over 650 young adults who had filled out daily online diaries for 13 days. Among other things, the questions asked how much time they’d spent in creative endeavors each day, and about their well-being: their levels of positive emotion, negative emotion, and what the researchers called “flourishing”—an overall sense of meaning, purpose, engagement, and social connection in their lives.
To tease out what causes what, the researchers compared measures of creativity on one day to measures of well-being on the next day, and vice versa.
Results showed that people who were engaged in more creative activities than usual on one day reported increased positive emotion and flourishing the next day, while negative emotions didn’t change. However, the reverse effect did not seem to occur: People who experienced higher positive emotions on day one weren’t more involved in creative activities on day two, suggesting that everyday creativity leads to more well-being rather than the other way around.
The researchers also
found that people who were more creative on one day still experienced more flourishing and positive emotions like energy, enthusiasm, and excitement the next day (though not other positive emotions, like cheerfulness). This led Conner to conclude that engaging in small daily acts of creativity may influence overall well-being rather than simply making us feel good in the moment. But can everyone reap these benefits? Certain personality traits have been linked to creativity in the past, such as openness to experience. Yet, when Conner and her colleagues ran the analyses, they found that the benefits of engaging in creativity were similar across different personality types…Conner believes her findings suggest that people should incorporate more creativity into their week—perhaps learn to knit, take up cooking, sing in a group, paint, or play music. She also suggests tapping into creativity at work, by trying to come up with novel solutions to problems or writing creatively.
According to economist Nathan Nunn, the African slave trade (unsurprisingly) had numerous negative long-term effects, economically, socially and culturally. He writes,
An empirical literature has emerged that aims to supplement these historical accounts with quantitative estimates of the long-run impact of Africa’s slave trades. The first paper that attempted to provide such estimates was Nunn (2008). In the study, I undertook an empirical test, with the following logic. If the slave trades are partly responsible for Africa’s current underdevelopment, then, looking across different parts of Africa, one should observe that the areas that are the poorest today should also be the areas from which the largest number of slaves were taken in the past.
To undertake this study, I had to first construct estimates of the number of slaves taken from each country in Africa during the slave trades (i.e. between 1400 and 1900).
These estimates were constructed by combining data on the number of slaves shipped from each African port or region with data from historical documents that reported the ethnicity of over 106,000 slaves taken from Africa. Figure 1 provides an image showing a typical page from these historical documents. The documents shown are slave manumission records from Zanzibar. Each row reports information for one slave, including his/her name, ethnicity, age, and so on.
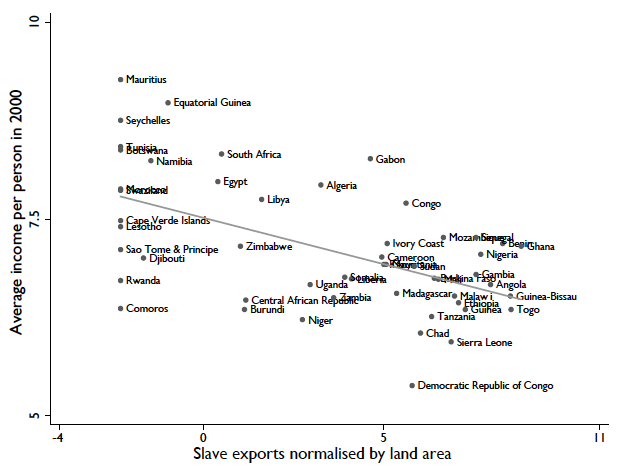
After constructing the estimates and connecting these with measures of modern day economic development, I found that, indeed, the countries from which the most slaves had been taken (taking into account differences in country size) were today the poorest in Africa. This can be seen in Figure 2, which is taken from Nunn (2008). It shows the relationship between the number of slaves taken between 1400 and 1900 and average real per capita GDP measured in 2000. As the figure clearly shows, the relationship is extremely strong. Furthermore, the relationship remains robust when many other key determinants of economic development are taken into account…According to the estimates from Nunn (2008), if the slave trades had not occurred, then 72% of the average income gap between Africa and the rest of the world would not exist today, and 99% of the income gap between Africa and other developing countries would not exist. In other words, had the slave trades not occurred, Africa would not be the most underdeveloped region of the world and it would have a similar level of development to Latin America or Asia.
“In a series of studies,” Nunn continues,
Whatley and Gillezeau (2011) and Whatley (2014) combine slave shipping records with ethnographic data and estimate the relationship between slave shipments and institutional quality and ethnic diversity in the locations close to the ports of shipment. Their analysis, consistent with Nunn (2008) and Green (2013), indicates that the slave trades did result in greater ethnic fractionalisation. In addition, their analysis also shows that the slave trades resulted in a deterioration of local ethnic institutions, measured in the late pre-colonial period.
Another subsequent study, undertaken by Nunn and Wantchekon (2011) asks whether the slave trades resulted in a deterioration of trust…In our study, Wantchekon and I extended the data construction efforts in Nunn (2008) and constructed estimates of the number of slaves taken from each ethnic group in Africa (rather than country). The ethnicity level estimates are displayed visually in Figure 3. The analysis combined the ethnicity-level slave export estimates with fine-grained household survey data, which reports individuals’ trust of those around them, whether neighbours, relatives, local governments, co-ethnics, or those from other ethnicities. The study documented a strong negative relationship between the intensity of the slave trade among one’s ethnic ancestors and an individual’s trust in others today.
The study then attempted to distinguish between the two most likely channels through which the slave trades could have adversely affected trust. One is that the slave trades made individuals and their descendants inherently less trusting. That is, it created a culture of distrust. In the insecure environment of the slave trade, where it was common to experience the betrayal of others, even friends and family, greater distrust may have developed, which could persist over generations even after the end of the slave trade.
Another possibility is that the slave trades may have resulted in a long-term deterioration of legal and political institutions, which are then less able to enforce good behaviour among citizens, and as a result people trust each other less today.
The study undertook a number of different statistical tests to identify the presence and strength of the two channels. They found that each of the tests generated the same answer: both channels are present. The slave trades negatively affected domestic institutions and governance, which results in less trust today. In addition, the slave trade also directly reduced the extent to which individuals were inherently trusting of others. We also found that, quantitatively, the second channel is twice as large as the first channel.
Guess what? The slave trade likely boosted the practice of polygyny in West Africa:
This is due to the fact that it was primarily males who were captured and shipped to the Americas, resulting in a shortage of men and skewed sex ratios within many parts of Africa. Interestingly, Dalton and Leung (2014) found that there is no evidence of such an impact for the Indian Ocean slave trade, where there was not a strong preference for male slaves. This has led the authors to conclude that Africa’s history of the slave trades is the primary explanation for why today polygyny is much more prevalent in West Africa than in East Africa.
Nunn concludes,
Although research understanding the long-term impacts of Africa’s slave trades is still in progress, the evidence accumulated up to this point suggests that this historic event played an important part in the shaping of the continent, in terms of not only economic outcomes, but cultural and social outcomes as well. The evidence suggests that it has affected a wide range of important outcomes, including economic prosperity, ethnic diversity, institutional quality, the prevalence of conflict, the prevalence of HIV, trust levels, female labour force participation rates, and the practice of polygyny. Thus, the slave trades appear to have played an important role in shaping the fabric of African society today.
Sociologist W. Bradford Wilcox testified before a committee put together by the National Academies of Sciences, Engineering, and Medicine on child poverty in the United States. The following comes from his testimony:[ref]The sources for Wilcox’s claims can be found in the full link.[/ref]
Research by Robert Lerman of the Urban Institute and Isabel Sawhill of the Brookings Institution, among others, suggests the growth of child poverty from the 1970s to the 1990s was driven, in part, by the rise of single-parent families and family instability over this time period. For instance, in 1970, 12% of children lived with a single parent; by 1990, 25% of children lived with a single parent. Their work indicates that more than half of the increase in child poverty over this period can be attributed to the decline of stable marriage as an anchor to family life in America. Since then, the retreat from marriage has slowed, which means that family structure has been less salient in the ebb and flow of child poverty. Nevertheless, this research suggests that child poverty would be markedly lower in the United States if more American parents were stably married.
In fact, the continuing relevance of marriage to economic well-being can be seen in two recent studies, both of which suggest that marriage per se is strongly related to poverty. My own recent research with the Institute for Family Study’s Wendy Wang indicates that Millennials who have formed a family by marrying first are significantly less likely to be poor than Millennials who have formed a family by having a child before or outside of marriage. After controlling for education, race, ethnicity, family-of-origin income, and a measure of intelligence/knowledge (AFQT scores), we find that Millennials who married before having any children are about 60% less likely to be poor than their peers who had a child out of wedlock. In fact, as shown in the figure below, 95% of Millennials who married first are not poor by the time they are in their late twenties or early thirties. So, even for the latest generation of young adults, it looks like marriage continues to matter.
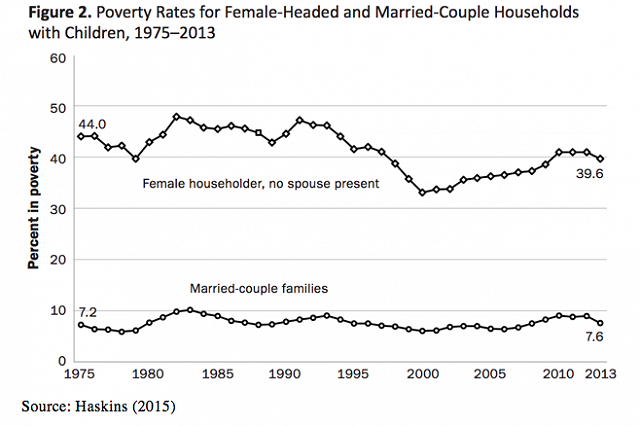
…[C]hildren in single-mother-headed families (who make up the clear majority of single-parent families) are over four times more likely to be poor, compared to children in married-parent families. And because more than one-quarter of American children are in single-parent families, this elevates the child poverty rate above what it would otherwise be if more children were living in married-parent families. Sawhill’s research suggests that if the share of children in female-headed families had remained steady at the 1970 level of 12.0%, then the 2013 child poverty rate would be at 16.4%, rather than a rate of 21.3%. In other words, the current child poverty rate would be cut by almost one-quarter if the nation enjoyed 1970-levels of married parenthood.
What about cohabiting parents?
One recent study finds, for instance, that children born to cohabiting parents are almost twice as likely to see their parents break up, compared to children born to married parents, even after controlling for a number of socioeconomic factors. This means that children in cohabiting families are more likely to end up in single-parent families or complex families without both their biological parents, which increases their risk of being in poverty. All this suggests that cohabitation does not protect children from poverty as much as marriage does.
What are the economic benefits of marriage for children?
“children raised by their married parents are much more likely to enjoy access to the economic support of their father over the course of their childhood, compared to children raised by single or cohabiting parents.”
“married parents are more likely to enjoy economies of scale, compared to single parents, and to pool their income, compared to other types of families.”
“stably married parents who do not have children with other partners do not incur child support obligations or legal expenses related to family dissolution that reduce their household income.”
“having stably married parents is worth about an extra $40,000 in annual family income to children while growing up, compared to children being raised by a single parent.”
What are his policy recommendations?
“On the educational front, strengthen vocational education and apprenticeship programs, so as to increase the vocational opportunities of the majority of young adults who will not get a four-year college degree.“
“On the policy front, work to minimize marriage penalties facing lower-income families, perhaps by offering newly married Americans a “honeymoon” period of three years where their eligibility for means-tested programs would not end if they marry—so long as their household income is below a threshold of $55,000.”
“On the cultural front, launch local, state, and federal campaigns on behalf of what Haskins and Sawhill have called the “success sequence,”where young adults are encouraged to get at least a high school degree, work full-time, and marry before having any children—in that order.”
“On the civic front, encourage secular and religious organizations to be more deliberate about targeting Americans without college degrees.”
This shouldn’t surprise anyone that has kept up with my posts. But it’s always nice to have some of the most updated research on the matter.
What is the science of diversity and creativity? According to an article in Harvard Business Review, it may be slightly surprising given how much of a buzzword “diversity” has become:
Generating vs. implementing ideas:Studies suggest that diversity is useful in generating ideas, but actually a hindrance when it comes to selecting and implementing them. “It would therefore make sense for organizations to increase diversity in teams that are focused on exploration or idea generation, and use more-homogeneous teams to curate and implement those ideas. This distinction mirrors the psychological competencies associated with the creative process: divergent thinking, openness to experience, and mind wandering are needed to produce a large number of original ideas, but unless they are followed by convergent thinking, expertise, and effective project management, those ideas will never become actual innovations. For all the talk about the importance of creativity, the critical piece is really innovation.”
Good leadership:Effective leadership can mitigate diversity-induced conflict. “It is the psychological process that enables individuals to set aside their selfish agendas to cooperate with others for the common benefit of the team, articulating the natural tension between our desire to get ahead of others and our need to get along with others.”
Moderate diversity is better: “recent evidence suggests that a moderate degree of diversity is more beneficial than a higher dose. This finding is consistent with the too-much-of-a-good-thing paradigm in management science, which provides compelling evidence for the idea that even the most desirable qualities have a dark side if taken to the extreme.”
Personality vs. demographic differences: “Most discussions about diversity focus on demographic variables (e.g., gender, age, and race). However, the most interesting and influential aspects of diversity are psychological (e.g., personality, values, and abilities), also known as deep-level diversity. Indeed, there are several advantages to focusing on deep-level variables as opposed to demographic factors. First, whereas demographic variables perpetuate stereotypical and prejudiced characterizations, deep-level diversity focuses on the individual, allowing a much more granular understanding of human diversity.”
Knowledge flows: Diversity doesn’t matter unless there is “a culture of sharing knowledge. Studies mapping the social networks of organizations have found higher levels of creativity in groups that are more interconnected, particularly when creative and intrapreneurial individuals are a central node in those networks.”
Skeptics: “diversity training is most effective with individuals who are skeptical of it. This is encouraging, though the challenge, of course, is to ensure that people who are cynical about diversity actually enroll in these training programs.”[ref]Diversity training has to be done properly to be effective.[/ref]
Non-diversity factors matter (and matter more): “As a seminal meta-analysis of 30 years of research showed, support for innovation, vision, task orientation, and external communication is the strongest determinant of creativity and innovation; most input variables, including team composition and structure, have much weaker effects. Likewise, developing expertise, assigning people to tasks that are meaningful and interesting, and improving creative thinking skills will produce higher gains in both individual and team creativity than focusing on diversity will.” Selecting employees based on their creativity also enhances overall creativity.
The article concludes, “In short, there are probably much better reasons for creating a diverse team and organization than boosting creativity. And if your actual goal is to enhance creativity, there are simpler, more effective solutions than boosting diversity.”
 I’m sure most of you have heard about the controversial Google Memo making the rounds throughout the media. Social psychologists Sean Stevens and Jonathan Haidt provide an excellent source[ref]Thanks to Megan Conley for linking to this on Facebook.[/ref] for those interested in browsing the academic literature on the subject. They provide both supportive and critical responses[ref]Update: Add this to the critical pile.[/ref] to the memo as well as highlight findings within the research that both agree and disagree with the memo’s assertions. Overall, they conclude,
 To test this prediction, we regressed participants’ support for redistribution simultaneously on their dispositional compassion, their dispositional envy, and their expected personal gain (or loss) from redistribution. As predicted, the three motives have positive, significant, and independent effects on support for redistribution. This is true in the four countries tested: the United States (US) (study 1a), India (IN) (study 1b), the United Kingdom (GB) (study 1c), and Israel (IL) (study 1d)—standardized regression coefficients (β values): compassion, 0.28–0.39; envy, 0.10–0.14; self-interest, 0.18–0.30. Jointly, these motives account for 13–28% of the variance in support for redistribution. Adding to the regression models age and gender, or age, gender, and S[ocio]E[conomic]S[tatus], does not appreciably alter the effect of the emotion/motivation triplet, or the total variance accounted for. We note that age did not have significant effects in any country. Gender had significant effects in the United States and the United Kingdom (females more opposed to redistribution), but not in India or Israel. SES had a significant (negative) effect in the United Kingdom, but not in the other countries (Ibid.).
 Participants in the United States, India, and the United Kingdom (studies 1a–c) were given two hypothetical scenarios and asked to indicate their preferred one. In one scenario, the wealthy pay an additional 10% in taxes, and the poor receive an additional sum of money. In the other scenario, the wealthy pay an additional 50% in taxes (i.e., a tax increment five times greater than in the first scenario), and the poor receive (only) one-half the additional amount that they receive in the first scenario. That is, higher taxes paid by the wealthy yielded relatively less money for the poor, and vice versa (63). To clarify the rationale for this trade-off, we told participants that the wealthy earned more when tax rates were low, thereby generating more tax revenue that could be used to help the poor. Fourteen percent to 18% of the American, Indian, and British participants indicated a preference for the scenario featuring a higher tax rate for the wealthy even though it produced less money to help the poor…We regressed this wealthy-harming preference simultaneously on support for redistribution, the emotion/motivation triplet, age, gender, and SES. Dispositional envy was the only reliable predictor (Ibid.).
 A
A 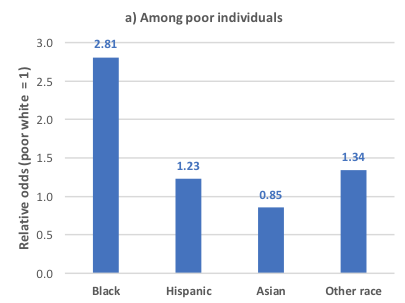

 So says a