A brand new paper from the Mission Foods Texas-Mexico Center at SMU:
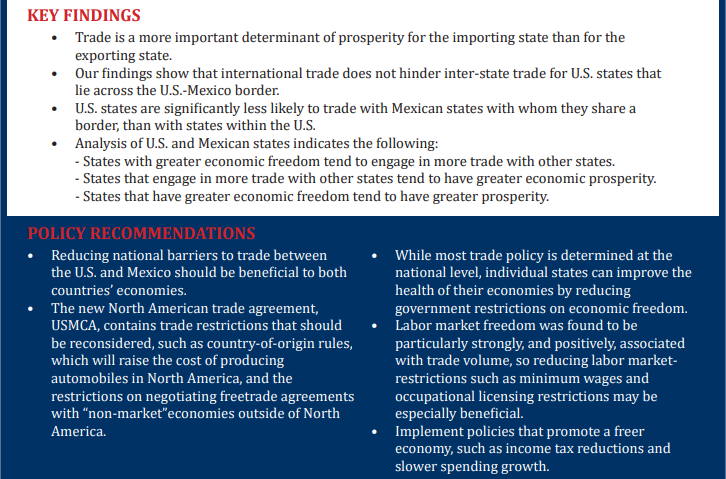
In this paper, we examine the relationship between institutional quality and bilateral trade patterns between Mexican states and U.S. states. We are contributing to the small, but growing, literature which uses gravity models to examine economic exchange at the subnational level (see Havranek and Irsova 2017 for a recent review of this literature). We are the first to explicitly incorporate institutional quality into a model of trade between the U.S. states and Mexican states, and the first to examine these sorts of relationships between the U.S. and Mexican states more generally. Poor institutions can be viewed as a cost for potential trading partners, and economic theory tells us that when an action becomes more costly, less of that action will be undertaken. Conversely, when an action becomes less costly, more of that action will be undertaken. We find that states with better institutional environments as measured by the Economic Freedom of North America index do, indeed, realize higher levels of trade. We also contribute to the literature examining trade border effects (Hillberry and Hummels 2002; Chen 2004; Head and Ries 2001) by examining the impact the border has on trade between the U.S. states and Mexican states. Finally, we use our dataset to examine the relationship between trade volume and three measures of economic prosperity (pg. 6).
The authors lay out their key findings and policy recommendations:
Ready for yet another post on the minimum wage? From a recent paper in the Journal of Public Economics:
Our empirical analysis uses the fact that the 2007 through 2009 increases in the federal minimum wage were differentially binding across states. We base our “bound” designation on whether a state’s January 2008 minimum wage was below $6.55, rendering it bound by the entirety of the July 2009 increase. In the states we describe as “unbound,” the effective minimum wage rose, on average, by $1.42 between 2006 and 2012. In the states we describe as “bound,” the effective minimum wage rose, on average, by $2.04. Of the long-run differential, $0.58 took effect on July 24, 2009.
We use monthly, individual-level panel data from the 2008 panel of the Survey of Income and Program Participation (SIPP) to implement a combination of difference-in-differences and triple difference research designs. Because we use longitudinal employment records with data on wage rates, our implementation of these research designs has two key advantages. First, we are able to pinpoint “target” groups more intensely affected by minimum wage increases than the analysis groups in many studies. Second, we are able to pinpoint workers who were not directly affected yet, as evidenced by their wage rates, were only moderately more skilled than the “target” workers. We incorporate this second group of workers into our analysis as a “within-state control” group. That is, we use this group to construct a set of counterfactuals that proxy for otherwise unobserved shocks to the low-skilled labor market (pg. 53).
What do they find?:
“We find that increases in the minimum wage significantly reduced the employment of low-skilled workers. By the second year following the $7.25 minimum wage’s implementation, we estimate that targeted individuals’ employment rates had fallen by 6.6 percentage points (9%) more in bound states than in unbound states. The implied elasticity of our target group’s employment with respect to the minimum wage is −1, which is large within the context of the existing literature” (pg. 54).
The average monthly incomes of low-skilled individuals decreased. “Relative to low-skilled workers in unbound states, targeted individuals’ average monthly incomes fell by $90 over the first year and by an additional $50 over the following 2 years. While surprising at first glance, we show that these estimates can be straightforwardly explained through our estimated effects on employment, the likelihood of working without pay, and subsequent lost wage growth associated with lost experience. We estimate, for example, that targeted workers experienced a 5 percentage point decline in their medium-run probability of reaching earnings greater than $1500 per month” (pg. 54).
The researchers conclude,
We use data from the SIPP to investigate the effects of the 2007 to 2009 increases in the federal minimum wage on the employment and income trajectories of low-skilled workers. We estimate that the minimum wage increases enacted during the Great Recession had negative effects on affected individuals’ employment, income, and income growth. The SIPP data suggest that this period’s minimum wage increases reduced aggregate employment rates by at least half of a percentage point in states that were fully bound by the federal minimum wage’s rise from $5.15 to $7.25 (pg. 67).
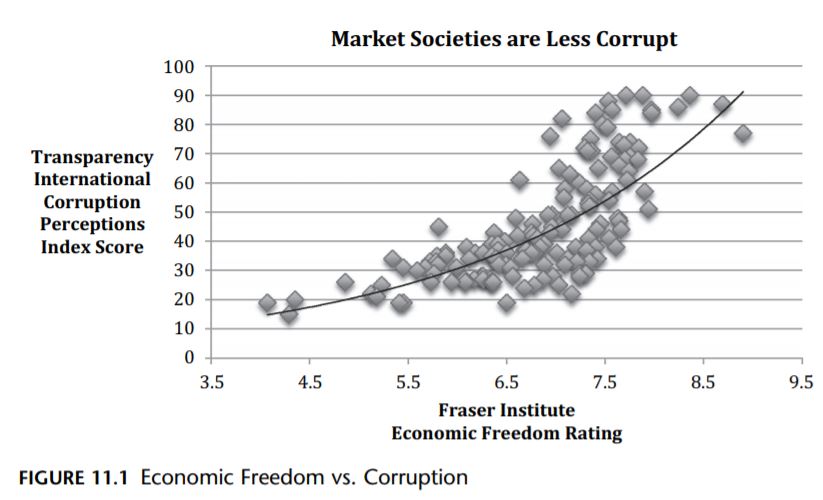
The Fraser Institute’s Economic Freedom of the World (EFW) Index, published in its annual Economic Freedom of the World reports, defines economic freedom based on five major areas: (1) size of the central government, (2) legal system and the security of property rights, (3) stability of the currency, (4) freedom to trade internationally, and (5) regulation of labour, credit, and business. According to its 2018 report (which looks at data from 2016), countries with more economic freedom have substantially higher per-capita incomes, greater economic growth, and lower rates of poverty. Drawing on the EFW Index, Georgetown political philosophers Jason Brennan and Peter Jaworski point to a strong positive correlation between a country’s degree of economic freedom and its lack of public sector corruption.
Granted, a lack of corruption could very well give rise to market reforms and increased economic freedom instead of the other way around. However, recent research on China’s anti-corruption reforms suggests that markets may actually pave the way for anti-corruption reforms. Summarizing the implications of this research, Lin et al. explain,
Reducing corruption creates more value where market reforms are already more fully implemented. If officials, rather than markets, allocate resources, bribes can be essential to grease bureaucratic gears to get anything done. Thus, non-[state owned enterprises’] stocks actually decline in China’s least liberalised provinces – e.g. Tibet and Tsinghai – on news of reduced expected corruption. These very real costs of reducing corruption can stymie reforms, and may explain why anticorruption reforms often have little traction in low-income countries where markets also work poorly. China has shown the world something interesting: prior market reforms clear away the defensible part of opposition to anticorruption reforms.Once market forces are functioning, bribe-soliciting officials become a nuisance rather than tools for getting things done. Eliminating pests is more popular than taking tools away … A virtuous cycle ensues – persistent anticorruption efforts encourage market-oriented behaviour, which makes anticorruption reforms more effective, which further encourages market oriented behaviour.
Interesting enough, there is some evidence that suggests that more government hands in the pies increases corruption. For example, a 2017 study found that larger municipality councils in Sweden result in more corruption problems. A 2009 study found that more government tiers and more public employees lead to more bribery. Finally, a 2015 study showed that high levels of regulation are associated with higher levels of corruption (likely because of regulatory capture).
I hear a lot about how “most Americans” are in favor of “Policy XYZ.” The problem is that the social science shows that most Americans don’t knowwhat they’re talking about. Do opinions change with more information or when costs are introduced? Two surveys from the Cato Institute seem to answer this in the affirmative.
The first is on federal paid leave. Seventy-four percent of the 1,700 Americans surveyed “a new federal government program to provide 12 weeks of paid leave to new parents or to people to deal with their own or a family member’s serious medical condition…Support slips and consensus fractures for a federal paid leave program, however, after costs are considered.” A 20 percentage point drop in support occurs when a $200 price tag is attached. Less than half are willing to pay $450 more in taxes for the program. When other potential costs are introduced (e.g., smaller future raises, reduction in other benefits, women less likely to be promoted,[ref]Ekins writes, “Research has found that government-provided paid leave programs may slow the pace of women’s career trajectories. Studies have found that government-provided paid leave may lead to fewer women getting promoted and becoming managers because they take longer leaves than they otherwise would. Other studies have noted that employers, particularly smaller companies that have difficulty accommodating workers taking leave, may be less willing to hire female employees to begin with. Some argue that American women’s corporate success is due to the fact that the United States does not provide generous family leave policies. Consistent with these findings, American women are more likely to rise up the corporate ladder than their European counterparts who have access to generous family social welfare programs. An analysis of OECD countries reveals that American women are 3 to 14 times as likely as Scandinavian women to be employed as managers with 14.6% of American women who are managers compared to 4.6% of Norwegian, 4.2% of Swedish, and 1% of Danish women. Americans women are also more likely than women in France (5.1%), the United Kingdom (7.8%), Germany (2.7%), and the Netherlands (3.6%) to hold managerial positions. The 20-First’s 2018 Global Gender Balance Scorecard finds that 53% of American companies compared to 14% of European companies have three or more women on company executive committees-the individuals who report directly to the CEO.”[/ref] cut funding to other government programs), the majority of Americans find themselves opposing the program.
Less than half of men would be willing to pay even $200 more, while 55% of women would still be willing to pay $450 more. Support for the program drops across all political parties as costs are introduced, with 60% of Democrats still willing to fork over $1,200 a year to implement it (but only 22% of Republicans and 45% of Independents). “In sum,” writes Cato researcher Emily Ekins, “Democrats have a much higher tolerance threshold for taxes than the average American.”
Another survey looked at support for the Affordable Care Act’s pre-existing condition regulation. Out of the 2,498 Americans questioned, 65% support this aspect of the ACA. However, when costs are introduced, support drops. Furthermore, wealthier Americans are more willing to entertain trade-offs than lower-income ones.
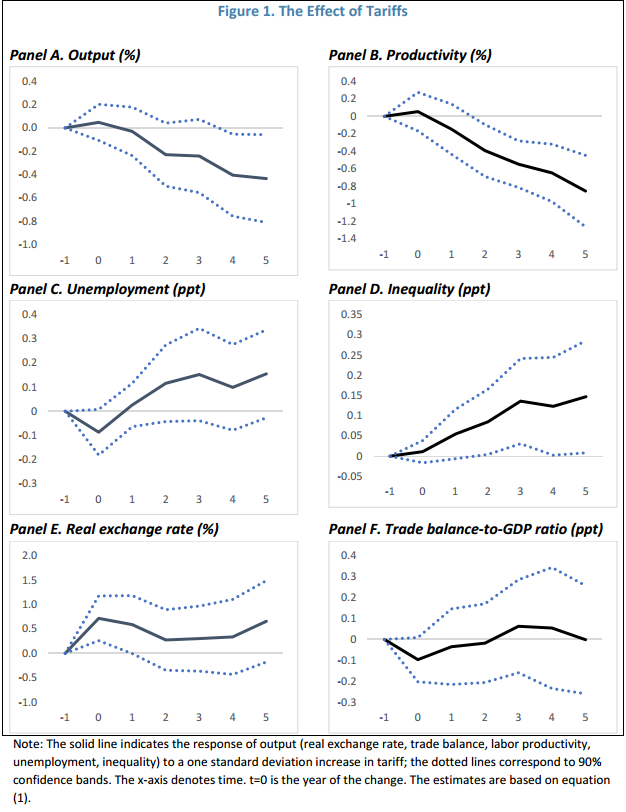
We use impulse response functions from local projections on a panel of annual data spanning 151 countries over 1963-2014. The main analysis on aggregate data is complemented with industry-level data.
Our results suggest that tariff increases have an adverse impact on output and productivity; these effects are economically and statistically significant. They are magnified when tariffs are used during expansions, for advanced economies, and when tariffs go up. We also find that tariff increases lead to more unemployment and higher inequality, further adding to the deadweight losses of tariffs. Tariffs have only small effects on the trade balance though, in part because they induce offsetting exchange rate appreciations. Finally, protectionism also leads to a decline in consumption; this, together with our findings, suggests that tariffs are bad for welfare.
All this seems eminently sensible and bolsters the arguments that mainstream economists make against tariffs; our results can be regarded as strong empirical evidence for the benefits of liberal trade. And given the current global context, we take special note of the negative consequences when advanced economies increase tariffs during cyclical upturns (pg. 25-26).
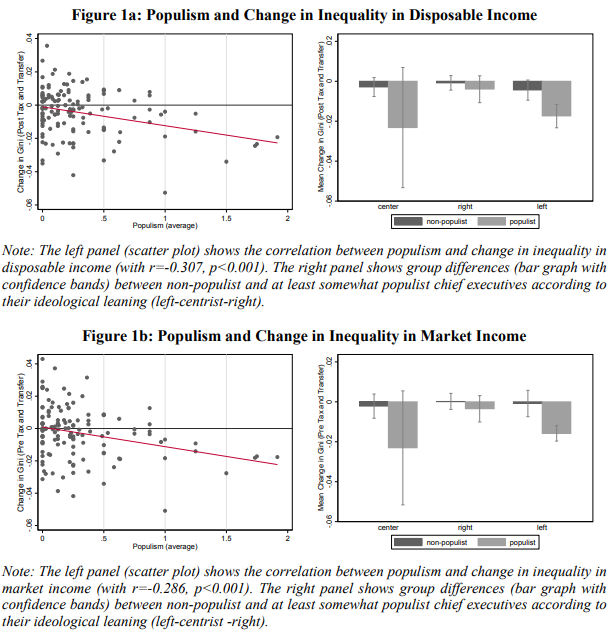
The above comes from a recent study of The New Populism project. This reduction in economic inequality may lead some populist supporters to feel vindicated. However, the study continues by pointing out that “the fiscal policies of populists are less progressive than non-populists. This is what we might have expected; they are not reducing inequality as a result of government taxation or welfare structures.” The mechanism remains unknown, “maybe minimum wage policies, maybe moves towards formalization of the labour force, or limits on income generation of the very wealthy (or even possibly in the case of Venezuela, the very wealthy leaving, thereby reducing overall levels of market inequality). But they do reduce overall levels of market inequality” (pg. 5).
Populism has no real impact on corruption, despite corruption often bringing populists to power.
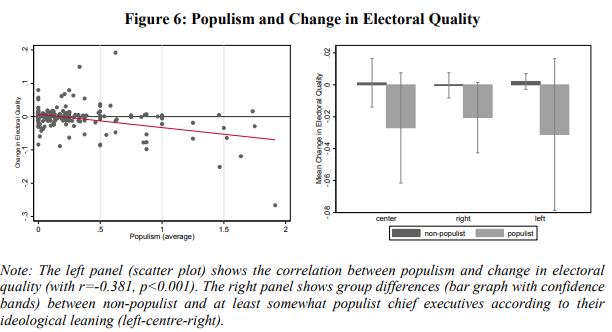
“[P]opulist chief executives are more likely to infringe on the freedom and fairness of the electoral process than their non-populist counterparts” (pg. 14).
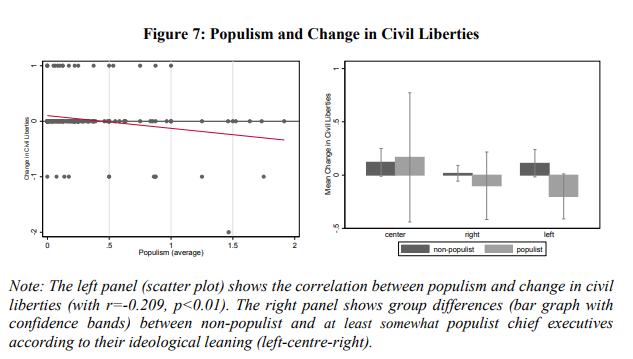
“[B]oth right and left populist chief executives seem more likely to embark on a mission to cut back on civil liberties” (pg. 15).
“We confirm a strong, negative effect of populism on press freedom. Not every decline can be attributed to populists, but almost every strong or moderate populist registers some decline” (pg. 17).
“Finally, populism in government is often associated with the centralization of power under the chief executive” and the erosion of executive constraints (pg. 18-19).
So giving power over to populist authoritarians who undermine democratic institutions and civil liberties is one successful avenue to economic equality. The others, according to historian Walter Scheidel, are “mass-mobilization warfare, violent and transformative revolutions, state collapse, and catastrophic epidemics. Hundreds of millions perished in their wake, and by the time these crises had passed, the gap between rich and poor had shrunk.”
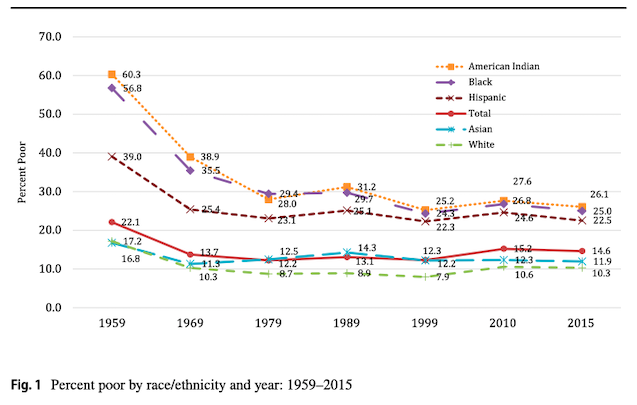
Using Census and ACS data, [John Iceland] shows that whites were the least likely of all groups to be poor throughout the decades studied (though, notably, their poverty rates inched up after 1980.) Although blacks and American Indians have become markedly less poor since 1959, they remain the groups with the highest— and fairly similar—odds of living in poverty. Hispanics never had poverty rates as high as those for American Indians and Blacks in the years studied, but their rates today, at 22.5%, are only marginally lower than those poorer groups (26.1 and 25%, respectively).
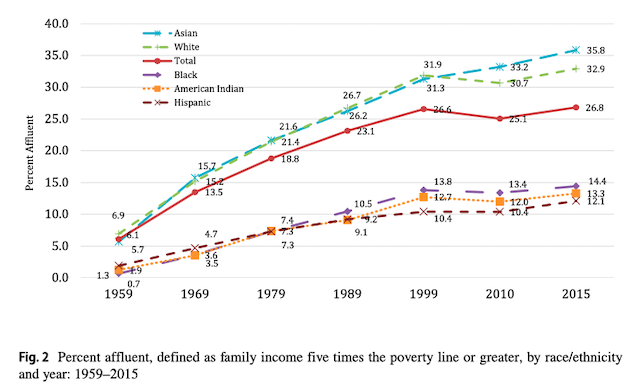
Iceland’s calculations also confirm that we are a much richer nation than we were in 1959. Affluence, defined as family income-to-poverty ratios five times the poverty threshold (or $120,180 as of 2015), has grown for all demographic categories, though at a faster pace for whites and Asians than others. (This “affluence” may strike New Yorkers and renters in other expensive cities as dubious, though the author checked his findings against alternative measures of poverty and affluence; they all showed the same basic trends.)
Despite the massive declines in poverty, what are the main factors behind continuing inequality?
Taking the groups as a whole, he finds immigrant status to be the characteristic that best correlates with poverty, and education the trait most associated with affluence. However, the features most closely related to poverty and affluence differ among groups in fascinating ways. At a time of renewed concerns about racial inequality, the most striking story is for blacks. African Americans are more than three times as likely to be poor than whites without controls. With controls, the gap declines considerably—to 1.71. Iceland estimates that female-headed households can now explain about one-third of the black-white poverty difference, age comes in second at 16%, and education at 15%; all-in-all, the three characteristics can explain two-thirds of the poverty gap between blacks and whites.
Iceland’s findings on trends in minority poverty and affluence are consistent with a narrative of progress in racial relations. In 1959, family structure, education, and age explained less than half of the poverty and affluence gap between blacks and whites, for example; most of the divide was due to “unobservables” like discrimination, neighborhood, and social networks. Iceland confirms earlier research showing black and American Indian poverty plummeting in the 1960s; 57% of African-Americans and 60.3% of Indians started that decade poor. By the 1970s the number was 35.5% and 35.5%. Because the strong economy of the 1960’s lifted all ethnic and racial boats during the 1960s, black, Hispanic, Asian, American Indian, and white, however, the decade ended with inequality between the various groups more or less unchanged. In sum, between civil rights laws and economic growth, minority groups were able to make substantial economic progress in the 1960s, though not enough to catch up with whites.
But as discriminatory barriers fell, individual and family characteristics became more crucial for economic mobility. The author shows that “observables,” including family structure, age, and education, have considerably more explanatory power for poverty and affluence gaps today than they did in 1959, while unobservable factors, like discrimination, though still significant for blacks and American Indians, have nevertheless become less so.
What about other groups?
Education differences have the largest effect on the Hispanic and white poverty gap and that effect has grown over time; age and immigrant status play strong supporting roles. Education has been the prime mover for affluent Hispanics and American Indians; intact families, fewer children, and relocation to metropolitan areas also helped the latter group improve their outcomes.
Asians are the most educated of any group as well as the most stably married. These traits help explain the 35.8% of Asians who are affluent (vs. 32.9% of second-place whites) as well as why, though they have higher poverty rates than whites mostly due to immigration, they are still somewhat “protected” against poverty.
Some limitations and cautions:
It could be that family structure itself is partly a proxy for discrimination. If black men have trouble finding jobs because of prejudice, they are inevitably less “marriageable.” He notes as well that the data available has serious limitations. “Asian” was not a Census category until 1980; before that, people checked the Chinese, Japanese, Filipino, or Hawaiian box. It’s worth noting that Asian remains an awkward grouping, encompassing people of very different histories and cultures; in measuring affluence, Iceland shows, the Vietnamese don’t look at all like other Asians. “Hispanic” is similarly problematic. With controls, Cubans are as likely as whites to be affluent; that’s far from the case with other Hispanic subgroups.
Alexis de Tocqueville argues that the active involvement of American citizens in civil society distinguishes America from Europe and helps to prevent American government from becoming over centralized. In fact, civil society not only prevents Big Government from taking over, but enlarges each citizen’s life, helping them overcome the natural tendency of democratic citizens to isolate from each other. Contemporary social observers, like Robert Putnam and Marc Dunkelman, have seen trends of disengagement from civil society in their recent studies (and more engagement in virtual communities via technology). Discuss the significance of civil society from Tocqueville’s perspective and whether these recent trends of disengagement should be viewed as a cause of some alarm.
The Stuff I Said
Tocqueville’s view of civil society is very organic; a kind of pre-state network guided by cultural norms and both individual and communal pursuits. The bottom-up, arguably emergent nature of Tocqueville’s perception is likely why many classical liberal writers quote him so favorably. The ability of private individuals to organize to advance societal goals rather than relying on the coercion of the state appears to be deeply encouraged by Tocqueville. This makes public engagement a necessity to avoid “despotism.” This makes the decline in social capital potentially problematic.
However, there are a few points worth noting about the claims of social capital decline and the march toward despotism:
First and foremost, government has grown significantly since the mid 1800s. Democracy in America was written 20-30 years prior to the outbreak of the Civil War. My own state of Texas had not even been annexed yet. For all we know, Tocqueville might think we’ve been in the era of Big Government for over a century.
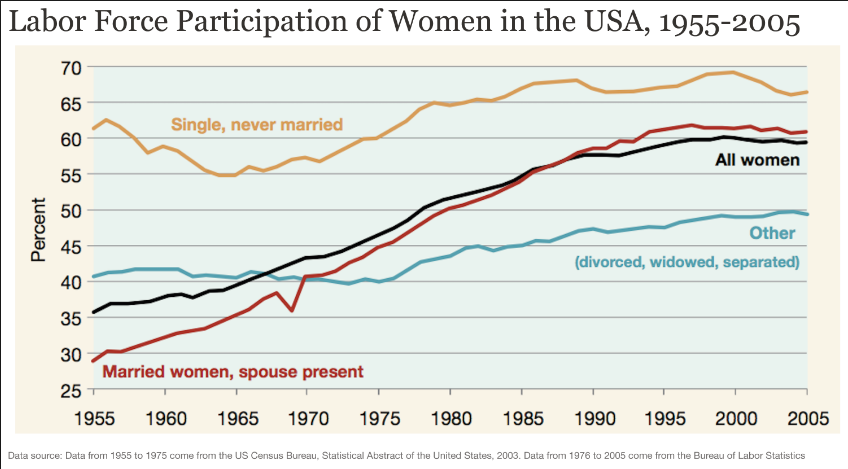
Next, economists Dora Costa and Matthew Kahn find that declines in social capital (i.e., volunteering and organization membership, entertainment of friends and relatives at home) between 1952 and 1998 were largely among women due to their increased participation in the labor force. Other contributors were income inequality and increasing ethnic heterogeneity. While income inequality can be a problem (it tends to erode trust), increasing diversity and female labor participation are, in my view, not negative developments.
Parents also appear to be spending more time with their children. For example, a 2016 study of 11 Western countries found that “the mean time the average mother in the 11 countries spent daily on child care in 1965 was calculated to be about 54 minutes, it increased to a predicted 104 minutes by 2012. For fathers, the estimates increased from a scant 16 minutes daily in 1965 to 59 minutes in 2012” (pg. 1090). Engaged parenting results in better child outcomes. So while parents may not be entertaining friends or bowling with buddies as much, they are giving their kids more attention. Considering Tocqueville’s focus on family, I think he would find this a plus (especially in the midst of the family fragmentation that has occurred over the last few decades).
But even with these declines, a majority of Americans still participate in various organizations. Drawing on the 2007 Baylor National Religious Survey, sociologist Rodney Stark finds that while 41% of Americans have no membership in non-church organizations, 48% had 1-3 memberships and 11% had 4-5 memberships. “About six Americans out of ten belong to at least one voluntary organization. Add in church organizations and the number rises to more than seven out of ten, and the median becomes two memberships” (pg. 122-123).
Finally, the labor market was dominated by agriculture (76.2% in 1800; 53.6% in 1850) during the period that Tocqueville wrote. By the turn of the 20th century, however, most of the labor force could be found in manufacturing (35.8%) and service sectors (23.6%). By the 21st century, service had come to dominate the labor market (73% in 1999). While social capital in the form of organizational participation may have declined over the last half century, the kind of work we do has changed drastically. This includes our workplace experience. We actually have co-workers that we spend hours each day cooperating with and customers that we are obligated to respect day in and day out. The relationships (and social capital) we establish through the workplace are very different from 19th-century farms or even industrial-era factories. The late Peter Drucker believed that today’s business institutions “are increasingly the means through which individual human beings find their livelihood, find their access to social status, to community and to individual achievement and satisfaction” (pg. 16). I don’t think we should underestimate the long-run impact of commerce on social capital. Numerous studies find that markets foster socially-desirable traits like trust, cooperation, and tolerance.[ref]Another classmate pointed out that it’s likely too soon to tell whether or not internet-based communities can fulfill the same civic functions as older forms. I think his point about the internet is really important. The concern over “echo chambers” may in fact be faroverblown. Granted, there is evidence that suggests social media does increase things like politicalpolarization. But we may really be underselling the benefits of greater connectivity via technology (especially through social media and mobile phones).[/ref]
In short, I think Tocqueville might find some of our over-reliance on government distasteful, but overall would be impressed with how incredibly adaptive the American people have been over the course of nearly two centuries of rapid change and development. This latter point would confirm many of the observations he made about the underlying mores of American civil society.
Although scholars generally agree on the timing of of the first few critical elections/realignments, consensus breaks down on the timing of the 6th and 7th party systems. Do you think the 6th party system began in 1968, 1980, or sometime later? What about the 7th party system? Please think critically and resist giving the answer you hope to be true.
The Stuff I Said
Political psychologist Lilliana Mason argues that over the last 50 years or so, parties have become “more homogeneous in ideology, race, class, geography, and religion,” causing “partisans on both sides [to feel] increasingly connected to the groups that [divide] them” (pg. 40). In other words, political partisanship has become associated with other forms of social identity and therefore has itself become an identity. For example, “party identity is strongly predicted by racial identity, not racial-policy positions (Mangum 2013). The parties have grown so divided by race that simple racial identity, without policy content, is enough to predict party identity. The policy division that began the process of racial sorting is no longer necessary for Democrats and Republicans to be divided by race. Their partisan identities have become firmly aligned with their racial identities, and decoupled from their racial-policy positions” (pg. 33, italics mine). It is this fusion of social and political identity that leads me to lean in favor of those scholars that identify the 1980s with the emergence of the 6th party system. I lean this way largely due to the rise of the Religious Right in the 1970s (I’d add the rise of “neoliberal” ideology associated with Reagan and Thatcher and solidified by the fall of the Berlin Wall, the collapse of the Soviet Union, and the ending of the Cold War). While Jimmy Carter was popular among religious conservatives, many of his policy stances alienated these same voters, paving the way for Reagan and the Republican identification with conservative Christians. By 1992, the religious divide between Democrats and Republicans had, in Mason’s words, “cracked open…The difference between the parties on the percentage of weekly churchgoers had increased to an 11 percentage point gap, with Republicans more churchgoing than Democrats. Connected to this new divide, Democrats in 1992 were only 2 percent more Catholic than Republicans. Twenty years earlier the difference had been 13 percentage points. The conservative religious were moving toward the Republican Party” (pg. 36). By 2012, “parties differed by 14 percentage points in how many attend religious services each week” (pg. 37).
I’m unsure if a firm 7th political system has arisen. However, I think we’re beginning to see the crumbling of the 6th party system. The identity politics mentioned above will likely increase in the era of globalization and social media. The election of Trump may be the first inklings of an identity politics party system, along with the recent uptick in student activism and fragility on college campuses. What’s worse, having more extreme political views actually increases one’s happiness. From a recent study:
Results show that congruence of political affiliations of national politicians, especially the president, with individual party affiliation has an effect on reported happiness while there is no effect of state, gubernatorial or legislative, party congruence. Individuals report being happier when the president is a member of their own party. Throughout all specifications, republicans and those holding conservative political values report higher happiness. Shockingly, regardless of liberal or conservative political values, those who hold extreme political values report higher levels of happiness. The large effect of partisanship and extreme views on reported happiness support the view that partisanship is a result of social identity and provides a psychological need for certainty and structure (pg. 10).
Economist Arthur Brooks, current president of the American Enterprise Institute, made this point years ago in his book Gross National Happiness:
Americans who describe themselves as holding extreme political views–somewhere between 10 and 20 percent of the population–are among the happiest people in America. All of those angry protesters who denounce Dick Cheney as a murderer; all of the professional political pundits who use the rhetoric of rage and misery to get on cable television–it turns out they’re not miserable at all. On the contrary, they’re enjoying themselves rather a lot.
In 2004, 35 percent of people who said they were extremely liberal were very happy (versus 22 percent of people who were just liberal). At the same time, a whopping 48 percent of people who were extremely conservative gave this response (compared with 43 percent of nonextreme conservatives). Indeed, the gusto with which Bill Clinton’s attackers in 1998 went after him was really a clue that they were having a grand old time. George W. Bush’s harshest critics–those who have felt the predations of the Bush administration to the very depths of their soul–are quite likely to be a great deal happier than more moderate liberals.
Why are ideologues so happy? The most plausible reason is religion–not real religion, but rather, a secular substitute in which they believe with perfect certainty in the correctness of their political dogmas. People want to hold the truth; questioning is uncomfortable. It is easy to live by the creed that our nation’s ills are because of George W. Bush; it is much harder to acknowledge that no administration is perfect–or perfectly awful. True political believers are martyrs after a fashion willing to shout slogans in public for causes they are sure are good, or against causes they are convinced are evil. They are happy because–unlike you, probably–they are positive they are right. No data could change their minds (pgs. 33-34).
In other words, being a political hooligan feels really good, which makes change unlikely once you’ve discovered the One True Party. Unfortunately, as Brooks points out,
the happiness of political extremists is an unhappy fact for America. They may themselves be happy, but they make others unhappy–that is, they actually lower our gross national happiness. In many cases, extremists actually intend to upset people–it is part of their strategy…Extremists are happy to stir up their own ranks, but they are even happier when they cause misery for their political opponents. For people on the far left and right, people who do not share their views are not just mistaken, but bad people, who are also stupid and selfish. They deserve to be unhappy…Extremists thrive on dehumanizing their opponents (pgs. 34-35).
I’m going to bring in some resources that push back against Rodrik.
A 2008 paper finds that Rodrik’s “analysis does not adequately address a significant factor that is important in accounting for China’s superior export performance. This factor is the regional trade and production integration mediated by foreign direct investment (FDI) in East and Southeast Asian economies. A close look at the role of FDI in connecting China with other Asian countries to form a regional trading network would improve the understanding of the characteristics of China’s trade structure and the challenges China faces in international trade” (pg. 100). In my view, Liang’s paper actually highlights the importance of trade and integration contra Rodrik’s somewhat dismissive attitude toward it. Yet, this may still be overestimating the “specialness” of China’s exports. A 2010 paper also points out that Rodrik relies on China’s average per capita GDP (PCGDP) to determine the “specialness” of its exports, yet “China’s coastal provinces, which account for over 90% of China’s exports, have an average PCGDP level 1.5 to 2 times that of China’s overall PCGDP. Without taking this into account, one would underestimate the export capability against which the relative export sophistication is evaluated.” What’s more, “although many of China’s exported goods belong to sophisticated categories, they may well be the low-quality varieties” (pg. 483). When these factors are controlled for, the “specialness” of China’s exports declines.
Rodrik is right to point out that China’s growth has largely been under what many call “state capitalism.” Yuen Yuen Ang’s work has traced the co-evolutionary development between markets and institutions within China. But as one of her book’s reviewers notes, the bureaucratic corruption that played a role in spurring market-oriented growth may end up holding it back. (The good thing is that recent evidence suggests that market reforms and anti-corruption reforms create a virtuous cycle.) However, what I find so odd about Dani Rodrik’s somewhat heterodox position on globalization is that he seems to think that because China has experience incredible growth in the midst of its government’s heavy-handedness, the answer for development is state intervention. He basically watches communist China grow once it begins to liberalize its markets and his response is, “Developing countries need more state intervention.”
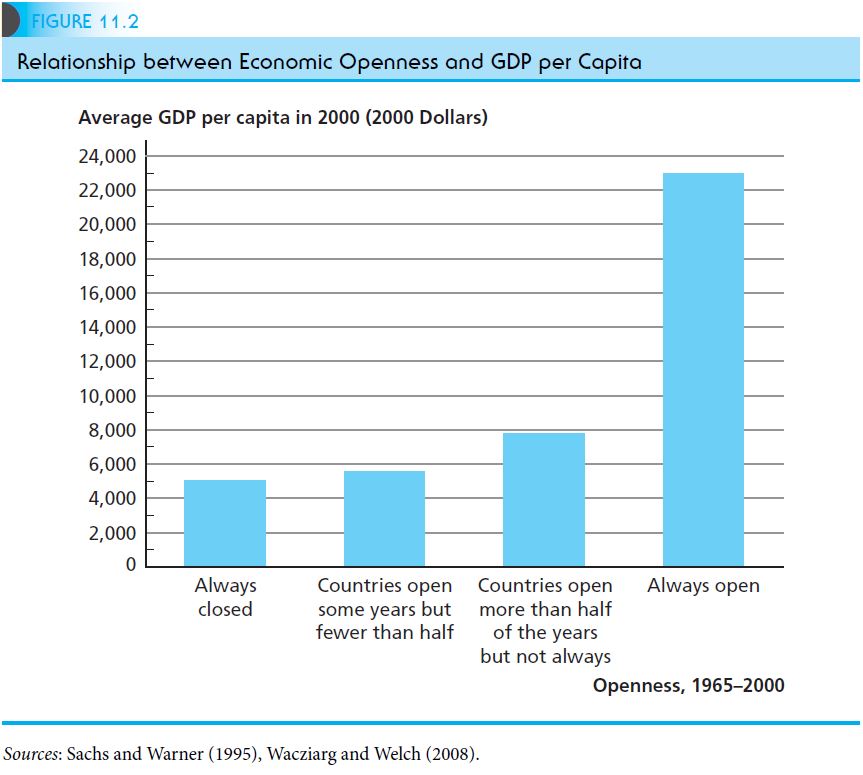
Economists like Acemoglu and Robinson don’t deny that economic growth can occur under extractive institutions. It’s just that it can’t last in the long run. This is why openness is so important. As David Weil demonstrates,
Our first approach is to see how growth rates compare in open and closed countries…First, the average growth rate of income in the closed group, 1.5% per year, was significantly lower than in the open group, 3.1% per year. Second, among the economies that were closed some or all of the time, there is no observable relationship between the initial level of a country’s GDP and its subsequent rate of growth. Among the countries open to trade, by contrast, we find strong evidence of convergence:Poorer countries that are open tend to grow faster than richer countries. Putting the results in the two figures together, we can see that poor countries that are open to trade grow faster than rich countries, and poor countries that are closed to trade grow more slowly than rich countries. Our second approach to exploring the effect of openness on growth is to consider how changes in a country’s degree of openness affect growth rates. If within a particular country, a change in trade policy (a trade liberalization or the imposition of new trade restrictions) is followed by a change in the growth rate of output, this pattern can supply us with evidence about the way trade affects income.One of the most sweeping examples of trade liberalization comes from 19th-century Japan. In the 12 years after Japan ended its self-imposed economic isolation in 1858, the value of Japanese trade with the rest of the world rose by a factor of 70. The opening to trade is estimated to have raised Japanese real income by 65% over two decades, and put the country on a path of growth that would eventually cause it to catch up to European levels of income…This same effect of trade liberalization has occurred in the 20th century as well. In South Korea, following a sweeping liberalization of trade in 1964–1965, income grew rapidly, doubling in the next 11 years. Similarly, Uganda and Vietnam experienced rapid growth in the 1990s, following their integration into the world economy.In all these examples, increased openness led to higher growth. Conversely,when we look at cases in which openness decreased, we see evidence that lower growth followed. For example, the trade embargo instituted by President Thomas Jefferson in 1807–1809 spawned widespread unemployment and bankruptcy in the United States. Similarly, the wave of tariff increases throughout the world in 1930, including the U.S. Smoot-Hawley tariff, contributed to the severity of the Great Depression of the 1930s (pg. 327-329).
Weil, 2013, pg. 307.
Given the evidence above, I think China and other developing countries would do well to open their economies more.