The Demographics of Hope

A new study looks the demographics of hopefulness in the United States. As the author explains,

Hope is an important channel driving people’s willingness to invest in the future. My early research on well-being work highlights its particular importance for people with less means, for whom making such investments requires a greater sacrifice of current consumption than it does for the rich (Graham et al. 2004). In addition to widening gaps in opportunity, the prosperity gap in the US has led to rising inequality in beliefs, hopes, and aspirations, with those who are left behind economically the least hopeful and the least likely to invest in their futures.

The author points to multiple markers that divide America,

ranging from education levels and job quality to marriage and incarceration rates to life expectancy. Indeed, the starkest evidence of this lack of faith in the future is the marked increase in premature deaths – driven largely but not only by an increase in preventable deaths (such as via suicide and drug over-dose) among middle-aged uneducated whites, as described by Case and Deaton (2017). There are even differences in the words that these two Americas use. Common words in wealthy America reflect investments in health, knowledge acquisition, and the future: iPads and Baby Bjorns, foam rollers and baby joggers, cameras, and exotic travel destinations such as Machu Picchu. The words that are common in poor America – such as hell, stress, diabetes, guns, video games, and fad diets – reflect short-time horizons, struggles, and lack of hope (Leonhardt 2015).

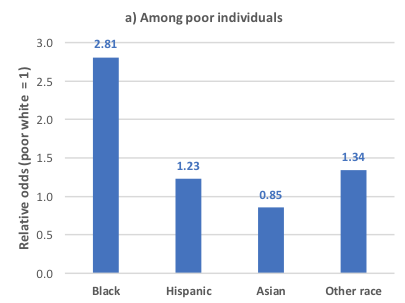
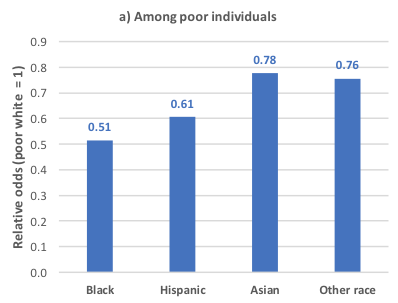
Surprisingly, “poor minorities – and blacks in particular – are much more hopeful than poor whites. Poor blacks are three times as likely to be a point higher on the ten-point optimism scale than are poor whites, while Hispanics are about one and a half times more likely than poor whites. Poor blacks are also half as likely to experience stress – a significant marker of ill-being – on a daily basis as are poor whites, while poor Hispanics are about two-thirds as likely.”

Figure 1: Odds of being on a higher level of optimism, by race group (relative to white), within each income group
Figure 2: Odds of experiencing stress, by race group (relative to white), within each income group

There are various reasons for this:

  • “One important one is that, despite substantial obstacles, minorities have been gradually narrowing the gaps with whites, at least in terms of education and life expectancy gaps. Minorities are also more likely to compare themselves with parents who were worse off than they are, while blue-collar whites are more likely to compare themselves with parents who were better off – a trend that has been increasing over the past decade, as found by Cherlin (2016).”
  • “Psychological research points to higher levels of resilience among minorities compared to whites. Assari et al. (2016) find that blacks and Hispanics are much less likely to report depression and/or commit suicide in the face of negative shocks than are whites.”
  • “More generally, urban places are more hopeful than are rural ones, as are places with higher levels of diversity. In recent research, Sergio Pinto and I find that the same places have healthier behaviours – such as more people who exercise and less who smoke (Graham and Pinto 2017).”

The study is very interesting to say the least. Check it out.

The Effects of Immigrants: Miami Edition

Economist Michael Clemens has an excellent article in Vox discussing some of his most recent research on immigration and in turn responds to Harvard’s George Borjas, the most prominent anti-immigration economist around:

Do immigrants from poor countries hurt native workers? It’s a perpetual question for policymakers and politicians. That the answer is a resounding “Yes!” was a central assertion of Donald Trump’s presidential campaign. When a study by an economist at Harvard University recently found that a famous influx of Cuban immigrants into Miami dramatically reduced the wages of native workers, immigration critics argued that the debate was settled.

…But there’s a problem. The study is controversial, and its finding — that the Cuban refugees caused a large, statistically unmistakable fall in Miami wages — may be simply spurious. This matters because what happened in Miami is the one historical event that has most shaped how economists view immigration.

In his article, Borjas claimed to debunk an earlier study by another eminent economist, David Card, of UC Berkeley, analyzing the arrival of the Cubans in Miami. The episode offers a textbook case of how different economists can reach sharply conflicting conclusions from exactly the same data.

Yet this is not an “on the one hand, on the other” story: My own analysis suggests that Borjas has not proved his case. Spend a few minutes digging into the data with me, and it will become apparent that the data simply does not allow us to conclude that those Cubans caused a fall in Miami wages, even for low-skill workers.

An influential 1990 study found “no difference in wage or employment trends between Miami — which had just been flooded with new low-skill workers — and other cities” following the arrival of 125,000 Cuban immigrants.

Two new studies reexamined the 1990 study. “Borjas, instead, focuses on workers who did not finish high school — and claimed that the Boatlift caused the wages of those workers, those truly at the bottom of the ladder, to collapse. The other new study (ungated here), by economists Giovanni Peri and Vasil Yasenov, of the UC Davis and UC Berkeley, reconfirms Card’s original result: It cannot detect an effect of the boatlift on Miami wages, even among workers who did not finish high school.” Clemens suggests looking at

certain subgroups that may have competed more directly with the newly-arrived Cubans. For example, the Mariel migrants were mostly men. They were Hispanic. Many of them were prime-age workers (age 25 to 59). So we should look separately at what happened to wages for each of those groups of low-skill workers who might compete with the immigrants more directly: men only, non-Cuban Hispanics only, prime-age workers only…Here again, if anything, wages rose for each of these groups of low-skill workers after 1980, relative to their previous trend. There isn’t any dip in wages to explain. And, again, the same is true if you compare wage trends in Miami to trends in other, similar cities. Peri and Yasenov showed that there is still no dip in wages even when you divide up low-skill workers by whether or not they finished high school. About half of the Mariel migrants had finished high school, and the other half hadn’t. So you might expect negative wage effects on both groups of workers in Miami. Here is what the wage trends look like for those two groups.

The wages of Miami workers with high school degrees (and no more than that) jump up right after the Mariel boatlift, relative to prior trends. The wages of those with less than a high school education appear to dip slightly, for a couple of years, although this is barely distinguishable amid the statistical noise. And these same inflation-adjusted wages were also falling in many other cities that didn’t receive a wave of immigrants, so it’s not possible to say with statistical confidence whether that brief dip on the right is real. It might have been — but economists can’t be sure. The rise on the left, in contrast, is certainly statistically significant, even relative to corresponding wage trends in other cities.

So how did Borjas come to different conclusions? He “starts with the full sample of workers of high school or less — then removes women, and Hispanics, and workers who aren’t prime age (that is, he tosses out those who are 19 to 24, and 60 to 65). And then he removes workers who have a high school degree. In all, that means throwing out the data for 91 percent of low-skill workers in Miami in the years where Borjas finds the largest wage effect. It leaves a tiny sample, just 17 workers per year.” Borjas’ conclusions involve a lot of statistical noise and, as Clemens notes, “if we’re willing to take low-skill workers in Miami and hand-pick small subsets of them, we can always find small groups of workers whose wages rose during a particular period, and other groups whose wages fell. But at some point we’re learning more about statistical artifacts than about real-world events.”

But there is another factor at work:

it turns out that the CPS sample includes vastly more black workers in the data used for the Borjas study after the boatlift than before it.

Because black men earned less than others, this change would necessarily have the effect of exaggerating the wage decline measured by Borjas. The change in the black fraction of the sample is too big and long-lasting to be explained by random error. (This is my own contribution to the debate. I explore this problem in a new research paper that I co-authored with Jennifer Hunt, a professor of economics at Rutgers University.)

Around 1980, the same time as the Boatlift, two things happened that would bring a lot more low-wage black men into the survey samples. First, there was a simultaneous arrival of large numbers of very low-income immigrants from Haiti without high school degrees: that is, non-Hispanic black men who earn much less than US black workers but cannot be distinguished from US black workers in the survey data. Nearly all hadn’t finished high school.

That meant not just that Miami suddenly had far more black men with less than high school after 1980, but also that those black men had much lower earnings. Second, the Census Bureau, which ran the CPS surveys, improved its survey methods around 1980 to cover more low-skill black men due to political pressure after research revealed that many low-income black men simply weren’t being counted.

You can see what happened in the graph below, which has a point for each year’s group of non-Hispanic men with less than high school, in the data used by Borjas (ages 25 to 59). The horizontal axis is the fraction of the men in the sample who are black. The vertical axis is the average wage in the sample. Because black men in Miami at this skill level earned much less than non-blacks, it’s no surprise that the more black men are covered by each year’s sample, the lower the average wage.

But here’s the critical problem: The fraction of black workers in this sample increased dramatically between the years just before the boatlift (in red) and the years just after the boatlift (in blue). That demographic shift would make the average wage in this group appear to fall right after the boatlift, even if no one’s wages actually changed in any subpopulation. What changed was who was included in the sample.

“When the statistical results in the Borjas study are adjusted to allow for changing black composition of the sample in each city,” Clemens continues, “the result becomes fragile. In the dataset Borjas focuses on, the result suddenly depends on which set of cities one chooses to compare Miami to. And in the other, larger CPS dataset that covers the same period, there is no longer a statistically significant dip in wages at all.” And once “you’ve discarded women, and Hispanics, and workers under 25, and workers over 59, and anyone who finished high school— and blacks, you’ve thrown away 98 percent of the data on low-skill workers in Miami. There are only four people left in each year’s survey, on average, during the years that the Borjas study finds the largest effect. With samples that small, the statistical confidence interval (represented by the dotted lines) is huge, meaning we can’t infer anything general from the results. We can’t distinguish large declines in wages from large rises in wages — at least until several years after the boatlift happened, and those can’t be plausibly attributed to the boatlift.”

In conclusion, “[t]here is no clear evidence that wages fell (or that unemployment rose) among the least-skilled workers in Miami, even after a sudden refugee wave sharply raised the size of that workforce. This does not by any means imply that large waves of low-skill immigration could not displace any native workers, especially in the short term, in other times and places. But politicians’ pronouncements that immigrants necessarily do harm native workers must grapple with the evidence from real-world experiences to the contrary.”
 

Predatory Fines

Toward the end of last year, I did a rundown of the data on racial bias and policing. A new study is worth adding to the list. According to its findings,

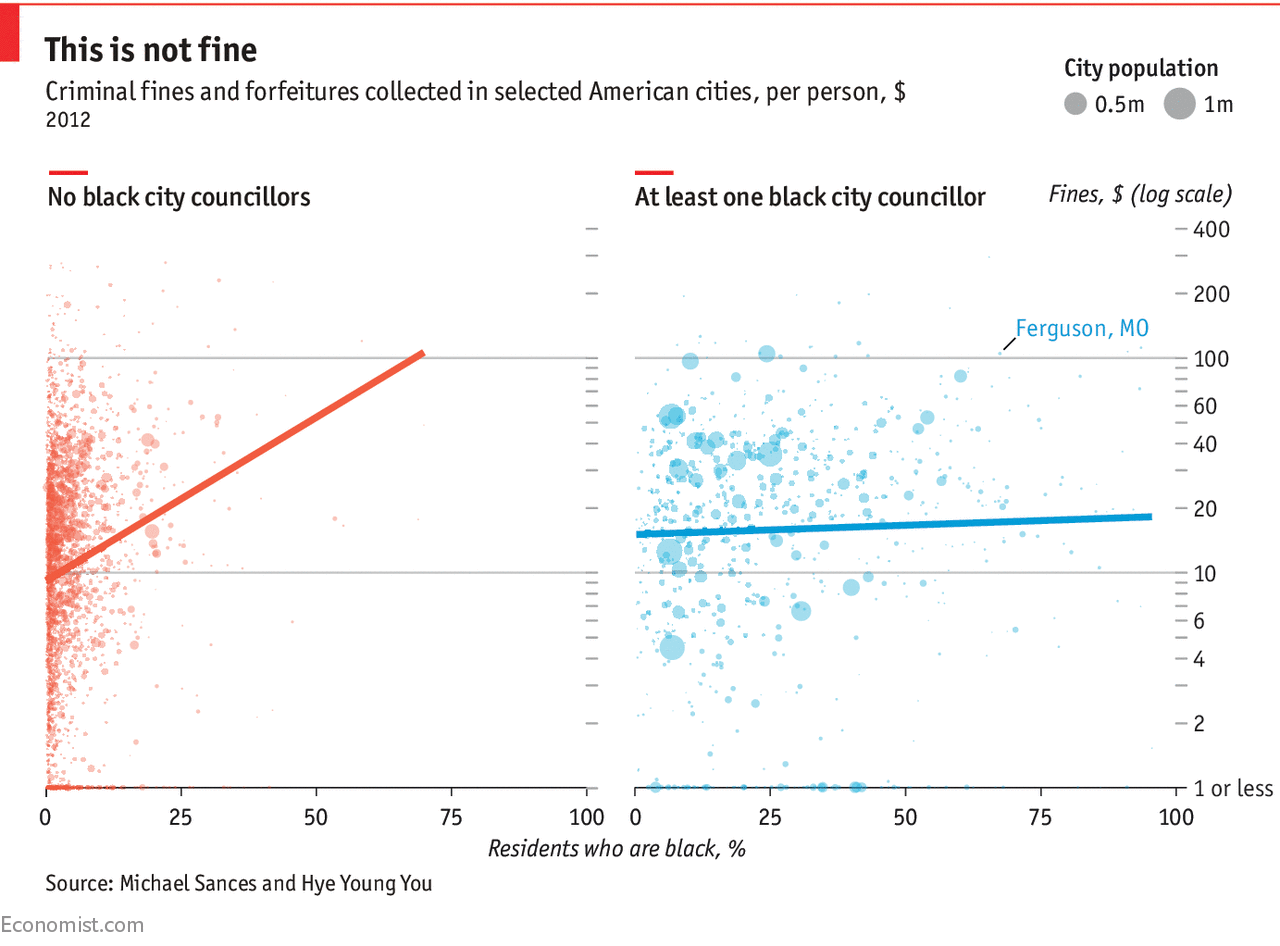
Ferguson was unlikely to be a unique outlier, and other cities engaging in similar practices might well have continued outside of the national spotlight. A new paper by Michael Sances of the University of Memphis and Hye Young You of Vanderbilt University published this month in the Journal of Politics found that Ferguson was indeed more of a rule than an exception. After examining data on 9,000 American cities, they found that those with more black residents consistently collected unusually high amounts of fines and fees—even after controlling for differences in income, education and crime levels. Cities with the largest shares (98%) of black residents collected an average of $12-$19 more per person than those with the smallest (0%) did.

However, there was one subgroup of cities that bucked the trend: the relationship between race and fines was only half as strong in places whose city councils included at least one black member. This may be because black politicians are likelier than white ones are to respond to complaints from black constituents. Black councillors might also intervene to stop certain policies, like increasing court fees, from going into effect to begin with.

What fines are we talking about exactly?

For example, in Peoria, Arizona, two people were jailed for not trimming weeds more than six inches tall. In Ferguson, a black man resting in his car after playing basketball in the public park was stopped by police and charged with, among other things, not wearing a seat belt in his (parked) car and making a false declaration after giving the officer a shortened name (like “Bob” instead of “Robert”). Such fines may fall disproportionately on the backs of black citizens, because they tend to be poorer and lack the resources to contest the penalties.

Despite the exhaustive controls the authors included in their study, the strong correlation they found does not demonstrate decisively that race is the ultimate cause of higher fines. However, it does put a very high burden of proof on researchers arguing that some other factor is responsible. Now that the pattern has been identified across the country, city governments that rely heavily on fines would be well-advised to consider more transparent sources of revenue, and ones that do not place an additional burden on a subset of residents who are already disadvantaged.

Check it out.

Drug Overdose in Portugal

This is encouraging. From The Washington Post:

Portugal decriminalized the use of all drugs in 2001. Weed, cocaine, heroin, you name it — Portugal decided to treat possession and use of small quantities of these drugs as a public health issue, not a criminal one. The drugs were still illegal, of course. But now getting caught with them meant a small fine and maybe a referral to a treatment program — not jail time and a criminal record.

Whenever we debate similar measures in the U.S. — marijuana decriminalization, for instance — many drug-policy makers predict dire consequences. “If you make any attractive commodity available at lower cost, you will have more users,” former Office of National Drug Control Policy deputy director Thomas McLellan once said of Portugal’s policies. Joseph Califano, founder of the Center for Addiction and Substance Abuse at Columbia University, once warned that decriminalization would “increase illegal drug availability and use among our children.”

But in Portugal, the numbers paint a different story. The prevalence of past-year and past-month drug use among young adults has fallen since 2001, according to statistics compiled by the Transform Drug Policy Foundation, which advocates on behalf of ending the war on drugs. Overall adult use is down slightly too. And new HIV cases among drug users are way down.

Now, numbers just released from the European Monitoring Centre for Drugs and Drug Addiction paint an even more vivid picture of life under decriminalization: drug overdose deaths in Portugal are the second-lowest in the European Union.

From Mark Perry

Furthermore, “the use of “legal highs” — like so-called “synthetic” marijuana, “bath salts” and the like — is lower in Portugal than in any of the other countries for which reliable data exists. This makes a lot of intuitive sense: why bother with fake weed or dangerous designer drugs when you can get the real stuff? This is arguably a positive development for public health in the sense that many of the designer drugs that people develop to skirt existing drug laws have terrible and often deadly side effects.” In short, “[a]s the Transform Drug Policy Institute says in its analysis of Portugal’s drug laws, “The reality is that Portugal’s drug situation has improved significantly in several key areas. Most notably, HIV infections and drug-related deaths have decreased, while the dramatic rise in use feared by some has failed to materialise.””

Still think the Drug War is a good idea?

Persuasion in the Economy

Over 20 years ago, economists Deirdre (then Donald) McCloskey and Arjo Klamer argued that a quarter of GDP is due to “persuasion”: the sweet talk that is inherent in economic activity and transactions. A 2013 report by the Australian Treasury updates their findings and concludes that 30% of U.S. GDP is persuasion:

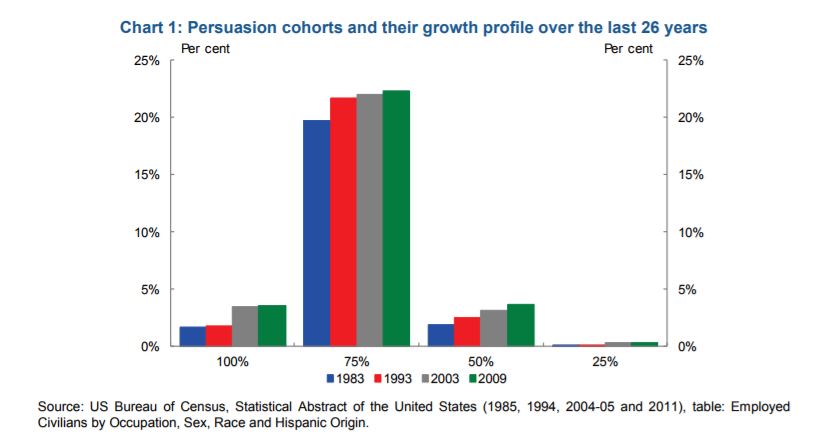
Chart 1 displays the steady rise of persuasion content in US employment. To focus on the biggest grouping — those having a persuasion content of three-quarters — in 1983, they accounted for 19.7 per cent of total employment and grew by two percentage points to 21.8 per cent by 1993. And again, from 22.1 per cent in 2003 the proportion of these workers increased to 22.3 per cent in 2009. Overall persuasion employment appears to have settled at around the 30 per cent mark.

How much of national output is attributable to persuasion? McCloskey and Klamer derive an estimate through the production measure of GDP: the ‘more obviously “talkie” parts of production are a large part of production for final consumption, and much of it is persuasion rather than information or command’. And since these ‘talkie’ parts, such as wholesale and retail trade, finance and general government, add up to 58 per cent of US GDP in 1991, they conjecture that ‘it would not be hard to see … a figure of about a quarter (of GDP) devoted to persuasion’ (p. 193).

An alternative guess could be made from the income side of the national accounts — GDP(I). Since the persuasion content of employment is 30 per cent and the proportion of national income accruing to labour is around 60 per cent in the US (Jacobson and Occhino (2012)), that gives the labour income component of persuasion in the national accounts of around 18 per cent. If a fifth to one-quarter of capital income represents persuasive activity, that accounts for another 8-10 per cent (that is 20-25 per cent x (1-0.6)) of persuasion in GDP(I).7 The digital economy’s rapid advance has meant that brand names, commercial trademarks and other intellectual property are playing a bigger role in economic transactions and by their nature may not be well reflected in the national accounts. Therefore it is quite possible that the persuasion content of GDP may now be closer to 30 per cent.

While it is likely that persuasion GDP has risen above one quarter, it also bears entertaining the possibility that some of that effort could be dissipated by economic contests and positioning à la Skaperdas and Vaidya (2009).

The report concludes,

Since the inspired guesstimate of McCloskey and Klamer, the economics profession launched itself into modelling many aspects of persuasion. Insights are to be had for sure, particularly in how regulators might mandate minimum product or service disclosure standards or how persuasion is deployed in economic contests. There might even be lessons as to how to communicate difficult economic reform proposals and how to navigate tricky political economy landscapes.

But as McCloskey (2011) suggests, some research effort may be falling back into the trap of treating persuasion as just another factor in formal optimisation exercises. In that sense, McCloskey and Klamer’s (1995) original hope remains unrealised. They had hoped that a renewed awareness of the importance of persuasion might encourage the modern economist to augment her technical tools of trade by taking seriously the potential of language in economic discourse and by utilising the power of interpretation in distinguishing between competing ‘hard results’. In this way, McCloskey’s agenda goes beyond evidence-based policy evaluations, useful and necessary as they are in policy discourse.

On a positive note, might it be time to update the McCloskey-Klamer catch phrase to ’30 per cent of GDP is persuasion’? Such renewed speculation would of course merely inform because the persuading was eloquently done by McCloskey and Klamer.

The Long-Term Effects of the African Slave Trade

According to economist Nathan Nunn, the African slave trade (unsurprisingly) had numerous negative long-term effects, economically, socially and culturally. He writes,

An empirical literature has emerged that aims to supplement these historical accounts with quantitative estimates of the long-run impact of Africa’s slave trades. The first paper that attempted to provide such estimates was Nunn (2008). In the study, I undertook an empirical test, with the following logic. If the slave trades are partly responsible for Africa’s current underdevelopment, then, looking across different parts of Africa, one should observe that the areas that are the poorest today should also be the areas from which the largest number of slaves were taken in the past.

To undertake this study, I had to first construct estimates of the number of slaves taken from each country in Africa during the slave trades (i.e. between 1400 and 1900).

These estimates were  constructed  by  combining  data   on   the   number   of   slaves shipped from each African port or region  with  data  from  historical documents that reported the ethnicity of over 106,000 slaves taken from  Africa. Figure 1 provides an image showing a typical page from these historical documents. The documents shown are slave manumission records from Zanzibar. Each row reports information for one slave, including his/her name, ethnicity, age, and so on.

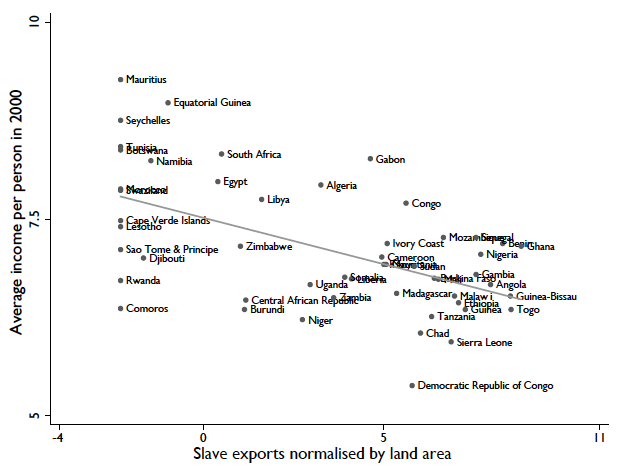
After constructing the estimates and connecting these with measures of modern day economic development, I found that, indeed, the countries from which the most slaves had been taken (taking into account differences in country size) were today the poorest in Africa. This can be seen in Figure 2, which is taken from Nunn (2008). It shows the relationship between the number of slaves taken between 1400 and 1900 and average real per capita GDP measured in 2000. As the figure clearly shows, the relationship is extremely strong. Furthermore, the relationship remains robust when many other key determinants of economic development are taken into account…According to the estimates from Nunn (2008), if the slave trades had not occurred, then 72% of the average income gap between Africa and the rest of the world would not exist today, and 99% of the income gap between Africa and other developing countries would not exist. In other words, had the slave trades not occurred, Africa would not be the most underdeveloped region of the world and it would have a similar level of development to Latin America or Asia.

“In a series of studies,” Nunn continues,

Whatley and Gillezeau (2011) and Whatley (2014) combine slave shipping records with ethnographic data and estimate the relationship between slave shipments and institutional quality and ethnic diversity in the locations close to the ports of shipment. Their analysis, consistent with Nunn (2008) and Green (2013), indicates that the slave trades did result in greater ethnic fractionalisation. In addition, their analysis also shows that the slave trades resulted in a deterioration of local ethnic institutions, measured in the late pre-colonial period.

Another subsequent study, undertaken by Nunn and Wantchekon (2011) asks whether the slave trades resulted in a deterioration of trust…In our study, Wantchekon and I extended the data construction efforts in Nunn (2008) and constructed estimates of the number of slaves taken from each ethnic group in Africa (rather than country). The ethnicity level estimates are displayed visually in Figure 3. The analysis combined the ethnicity-level slave export estimates with fine-grained household survey data, which reports individuals’ trust of those around them, whether neighbours, relatives, local governments, co-ethnics, or those from other ethnicities. The study documented a strong negative relationship between the intensity of the slave trade among one’s ethnic ancestors and an individual’s trust in others today.

The study then attempted to distinguish between the two most likely channels through which the slave trades could have adversely affected trust. One is that the slave trades made individuals and their descendants inherently less trusting. That is, it created a culture of distrust. In the insecure environment of the slave trade, where it was common to experience the betrayal of others, even friends and family, greater distrust may have developed, which could persist over generations even after the end of the slave trade.

Another possibility is that the slave trades may have resulted in a long-term deterioration of legal and political institutions, which are then less able to enforce good behaviour among citizens, and as a result people trust each other less today.

The study undertook a number of different statistical tests to identify the presence and strength of the two channels. They found that each of the tests generated the same answer: both channels are present. The slave trades negatively affected domestic institutions and governance, which results in less trust today. In addition, the slave trade also directly reduced the extent to which individuals were inherently trusting of others. We also found that, quantitatively, the second channel is twice as large as the first channel.

Guess what? The slave trade likely boosted the practice of polygyny in West Africa:

This is due to the fact that it was primarily males who were captured and shipped to the Americas, resulting in a shortage of men and skewed sex ratios within many parts of Africa. Interestingly, Dalton and Leung (2014) found that there is no evidence of such an impact for the Indian Ocean slave trade, where there was not a strong preference for male slaves. This has led the authors to conclude that Africa’s history of the slave trades is the primary explanation for why today polygyny is much more prevalent in West Africa than in East Africa.

Nunn concludes,

Although research understanding the long-term impacts of Africa’s slave trades is still in progress, the evidence accumulated up to this point suggests that this historic event played an important part in the shaping of the continent, in terms of not only economic outcomes, but cultural and social outcomes as well. The evidence suggests that it has affected a wide range of important outcomes, including economic prosperity, ethnic diversity, institutional quality, the prevalence of conflict, the prevalence of HIV, trust levels, female labour force participation rates, and the practice of polygyny. Thus, the slave trades appear to have played an important role in shaping the fabric of African society today.

Corporations, People, and Taxes

I was reviewing some old blog posts and such and came across the following. Remember this beautiful exchange?


Awww, yes. The “evil corporations” trope, i.e. the “confusion between abstract categories and flesh-and-blood human beings.”[ref]Thomas Sowell, Economic Facts and Fallacies, 2nd ed. (New York: Basic Books, 2011), 153.[/ref] Explaining the fallacious nature of this thinking, Thomas Sowell writes,

Abstract people can be aggregated into statistical categories such as households, families, and income brackets, without the slightest concern for whether those statistical categories contain similar people, or even the same number of people, or people who differ substantially in age, much less in such finer distinctions as whether or not they are working or whether they are the same people in the same categories over time. Abstract people have an immortality which flesh-and-blood people have yet to achieve.[ref]Thomas Sowell, Intellectuals and Society (New York: Basic Books, 2009), 112-113.[/ref]

What Romney’s hecklers (affiliates of Iowa Citizens for Community Improvement) and critics seem to have missed is the abstract nature of “greedy corporations.” The rhetoric invoked by these individuals often describes corporations as quasi-personal, transcendent entities that exist above and beyond flesh-and-blood people. As one writer notes, “Romney doesn’t mean that corporations are entitled to some of the legal rights of people in the Citizens United sense. He means it in the sense that the money made by corporations flows in and out of human hands—or pockets, in the language of the heckler who hoisted himself on his own metaphorical petard.” The abstractions of “corporations” and “the rich” are frequently linked, if not synonymous. Yet, empirical evidence suggests that corporate taxes negatively impact actual people. And not the rich ones you would hope for.[ref]See Matthew H. Jensen, Aparna Mathur, “Corporate Tax Burden on Labor: Theory and Evidence,” Tax Notes (June 6, 2011) for a nice rundown of the literature.[/ref]

A 2010 working paper explored international tax rates and manufacturing wages across 65 countries over 25 years. It suggests that a 1 percent increase in corporate tax rates decreases wage rates by 0.5-0.6 percent. “These results also hold for effective marginal and average tax rates” (pg. 22). A 2012 study[ref]Ungated working paper version here.[/ref] looked at over 55,000 companies in 9 European countries between 1996 and 2003. It found that every $1 increase in tax liability leads to a $0.49 decline in wages. This suggests that about 50% of the increased tax burden is passed on to the labor force over the long run. A 2007 Kansas City Fed working paper used cross-country data between 1979 and 2002 to find that a 1 percentage point increase in the average corporate tax rate led to a 0.7% decrease in annual gross wages; a decrease that was more than 4 times the amount of the corporate tax revenue collected. Furthermore, the “burden of the corporate tax on wages is shared equally across skill-level, suggesting that the corporate tax may not be as progressive as many politicians assume. Also, as the economy becomes more global, raising the corporate tax may result in lower than predicted corporate revenue increases due to the ability of firms to avoid taxes more effectively” (pg. 22). Another 2007 paper looked at a panel of U.S. multinationals across 50 countries over a 15-year period. The authors found that 45-75% of the corporate tax is shouldered by labor, with the rest falling on capital. Similarly, a 2013 study finds that a $1 increase in corporate tax liability leads to decreases in wages by about $0.60. The authors conclude,

Our findings suggest that labor shares a significant part of the burden of corporate income taxes. A direct calculation of the mean marginal effect of the corporate income tax from our estimates suggests that a 10 percent increase in the tax rate would decrease the average wage rate by 0.28–0.38 percent. Labor shares at least 42 percent of the burden of the corporate tax and possibly more. The average labor share of the corporate tax burden is around 60–80 percent (pg. 233).

A 2016 study[ref]Earlier, ungated version here.[/ref] of state corporate tax rates concluded that 25-30% fell on landowners and 30-35% fell on workers. A 2016 paper for the Federal Reserve looked at 131 tax increases and 140 tax cuts across 45 states going back to 1969. It found that “a one percentage-point increase in the top marginal corporate income tax rate reduces employment by between 0.3% and 0.5% and income by between 0.3% and 0.6%, measured relative to neighboring counties on the other side of the state border. These estimates are remarkably stable: they remain essentially unchanged regardless of local characteristics such as the flexibility of local labor markets, income levels, population density, or the prevalence of small businesses in a county. They are also stable across the business cycle and little changed when we control for localized industry-level shocks by comparing employment and income in bordering counties within the same industry” (pg. 3). A 2009 study by economist Robert Carroll found that across state lines “a one percent drop in the average tax rate leads to a 0.014 percent rise in real wages five years later.” In other words, wages rise $2.50 for every dollar reduction in the state-local corporate income taxes. The opposite also occurs: every dollar increase in tax rates leads to a $2.50 loss in wages. Drawing on recent research, Carroll suggests that “the least mobile factor of production is likely to bear the burden of a tax. In an increasingly global economy, labor is the least mobile because capital can flow freely across borders…When workers have more capital to work with, their labor productivity and wages will rise” (pg. 1). An abstraction is unable to pay its demanded “fair share” and instead places the economic burden on individuals. “After all, businesses are merely convenient ways of organizing economic activity,” writes Carroll, “so while businesses write checks to pay the corporate tax (and other taxes), the burden of those taxes falls ultimately on the individuals who depend on the corporations, in their roles as investors, workers, or consumers” (pg. 2). This is why Carroll finds numerous benefits to cutting corporate taxes, including higher long-term growth, higher wages and living standards, lowered tax burdens on low-income taxpayers and seniors, and boosted entrepreneurship, investment, and productivity.


The point of this review is to remind us that policy is complicated and often counterintuitive. We need to look at the empirical evidence. And if there isn’t much, perhaps we should wait until there is. The effects are real and they impact real people. The problem is that rarely will you achieve a utopian outcome. As I’m fond of saying, “There are no solutions; there are only trade-offs.”[ref]Sowell, The Vision of the Anointed: Self-Congratulation as a Basis for Social Policy(New York: Basic Books, 1995), 142.[/ref]

World Bank: Immigrants & Productivity

A new World Bank policy brief reviews the effects of immigrants on productivity:

For a sense of net effects –positive or negative, we looked at 22 primary studies. Explicit analysis on skilled versus unskilled immigrants is rare. So, most of the econometric results pertain to the effects of total immigrants. They remain instructive, given the overwhelming direction of migrant flows from less educated to more educated countries.

…In our RPB, broken down to the three components of labor productivity, positive effects from total immigrants are especially apparent through TFP. There is no statistically significant impact on physical capital per worker suggesting that capital accumulation need not be adversely affected. Human capital per worker is somewhat negatively affected, indicating that immigrants’ compositional effect on skills tends to outweigh the effect on natives’ skills upgrading. In the studies that analyze labor productivity alongside all its three components, positive immigrant effects on TFP more than offset the effects on physical capital and human capital per worker.

Outcomes vary across countries. Positive productivity effects from total immigrants are obvious for the U.S. – analysis using state-level data links task specialization of less-educated natives, induced by unskilled immigrant inflows, to TFP growth. Studies suggest that the complementarity and scale channels operate in Malaysia, but also that automation is somewhat hindered. Actual empirical evidence of net productivity effects seems mixed, and not representative enough of the economy as a whole, tending to focus on the manufacturing sector. In contrast, there is also the unique example of a large influx of skilled immigrants into Israel (fleeing the collapse of the Soviet Union) not having positive effects on productivity in the manufacturing sector.

More than anything, the cross-country evidence highlights that underlying the likelihood of positive net productivity effects is how immigrants link to specific gaps in the economy – regardless of skill level. And the response of agents, markets and institutions in host countries.

In fact, the report found that “on balance, total immigrant effects on labor productivity are statistically insignificant to positive” with “statistically significant positive effects” for total factor productivity (pg. 2). In short, “The economic case for an outright ban on unskilled immigrant workers is weak.”

And now I’ll leave you with the Hamilton Mixtape.

2017: The Best Year Ever

I know I said the same thing about 2016. And 2015. Even 2013. But that’s because things continue to get better. Nicholas Kristof writes in The New York Times, “There’s a broad consensus that the world is falling apart, with every headline reminding us that life is getting worse. Except that it isn’t. In fact, by some important metrics, 2016 was the best year in the history of humanity. And 2017 will probably be better still…Polls show that about 9 out of 10 Americans believe that global poverty has worsened or stayed the same.” And yet,

Every day, an average of about a quarter-million people worldwide graduate from extreme poverty, according to World Bank figures. Or if you need more of a blast of good news, consider this: Just since 1990, more than 100 million children’s lives have been saved through vaccinations, breast-feeding promotion, diarrhea treatment and more. If just about the worst thing that can happen is for a parent to lose a child, that’s only half as likely today as in 1990. When I began writing about global poverty in the early 1980s, more than 40 percent of all humans were living in extreme poverty. Now fewer than 10 percent are. By 2030 it looks as if just 3 or 4 percent will be. (Extreme poverty is defined as less than $1.90 per person per day, adjusted for inflation.) For nearly all of human history, extreme poverty has been the default condition of our species, and now, on our watch, we are pretty much wiping it out. That’s a stunning transformation that I believe is the most important thing happening in the world today — whatever the news from Washington.

What’s more is that “global income inequality is…declining. While income inequality has increased within the U.S., it has declined on a global level because China and India have lifted hundreds of millions from poverty.”[ref]Nathaniel and I covered global poverty and inequality in our 2014 SquareTwo article.[/ref] Today “some 40 countries are now on track to eliminate elephantiasis. When you’ve seen the anguish caused by elephantiasis — or leprosy, or Guinea worm, or polio, or river blindness, or blinding trachoma — it’s impossible not to feel giddy at the gains registered against all of them.” In “the 1960s, a majority of humans had always been illiterate; now, 85 percent of adults are literate. And almost nothing makes more difference in a society than being able to read and write.”

For me, this was the clincher in Kristof’s piece:

On a recent trip to Madagascar to report on climate change, I was struck that several mothers I interviewed had never heard of Trump, or of Barack Obama, or even of the United States. Their obsession was more desperate: keeping their children alive. And the astonishing thing was that those children, despite severe malnutrition, were all alive, because of improvements in aid and health care — reflecting trends that are grander than any one man.

He concludes, “The most important thing happening is not a Trump tweet. What’s infinitely more important is that today some 18,000 children who in the past would have died of simple diseases will survive, about 300,000 people will gain electricity and a cool 250,000 will graduate from extreme poverty.”

How’s that for a little pick-me-up?

Image result for you're welcome gif moana

Marriage and the Economic Well-Being of Children

Sociologist W. Bradford Wilcox testified before a committee put together by the National Academies of Sciences, Engineering, and Medicine on child poverty in the United States. The following comes from his testimony:[ref]The sources for Wilcox’s claims can be found in the full link.[/ref]

Research by Robert Lerman of the Urban Institute and Isabel Sawhill of the Brookings Institution, among others, suggests the growth of child poverty from the 1970s to the 1990s was driven, in part, by the rise of single-parent families and family instability over this time period. For instance, in 1970, 12% of children lived with a single parent; by 1990, 25% of children lived with a single parent. Their work indicates that more than half of the increase in child poverty over this period can be attributed to the decline of stable marriage as an anchor to family life in America. Since then, the retreat from marriage has slowed, which means that family structure has been less salient in the ebb and flow of child poverty. Nevertheless, this research suggests that child poverty would be markedly lower in the United States if more American parents were stably married.

In fact, the continuing relevance of marriage to economic well-being can be seen in two recent studies, both of which suggest that marriage per se is strongly related to poverty. My own recent research with the Institute for Family Study’s Wendy Wang indicates that Millennials who have formed a family by marrying first are significantly less likely to be poor than Millennials who have formed a family by having a child before or outside of marriage. After controlling for education, race, ethnicity, family-of-origin income, and a measure of intelligence/knowledge (AFQT scores), we find that Millennials who married before having any children are about 60% less likely to be poor than their peers who had a child out of wedlock. In fact, as shown in the figure below, 95% of Millennials who married first are not poor by the time they are in their late twenties or early thirties. So, even for the latest generation of young adults, it looks like marriage continues to matter.

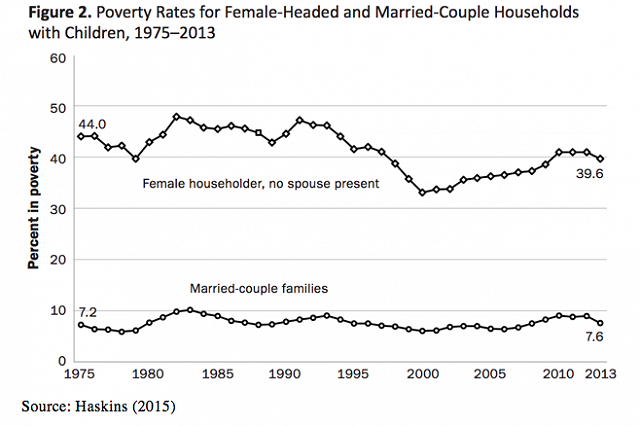
…[C]hildren in single-mother-headed families (who make up the clear majority of single-parent families) are over four times more likely to be poor, compared to children in married-parent families. And because more than one-quarter of American children are in single-parent families, this elevates the child poverty rate above what it would otherwise be if more children were living in married-parent families. Sawhill’s research suggests that if the share of children in female-headed families had remained steady at the 1970 level of 12.0%, then the 2013 child poverty rate would be at 16.4%, rather than a rate of 21.3%. In other words, the current child poverty rate would be cut by almost one-quarter if the nation enjoyed 1970-levels of married parenthood.

What about cohabiting parents?

One recent study finds, for instance, that children born to cohabiting parents are almost twice as likely to see their parents break up, compared to children born to married parents, even after controlling for a number of socioeconomic factors. This means that children in cohabiting families are more likely to end up in single-parent families or complex families without both their biological parents, which increases their risk of being in poverty. All this suggests that cohabitation does not protect children from poverty as much as marriage does.

What are the economic benefits of marriage for children?

  • “children raised by their married parents are much more likely to enjoy access to the economic support of their father over the course of their childhood, compared to children raised by single or cohabiting parents.”
  • “married parents are more likely to enjoy economies of scale, compared to single parents, and to pool their income, compared to other types of families.”
  • “stably married parents who do not have children with other partners do not incur child support obligations or legal expenses related to family dissolution that reduce their household income.”
  • “having stably married parents is worth about an extra $40,000 in annual family income to children while growing up, compared to children being raised by a single parent.”

What are his policy recommendations?

  1. “On the educational front, strengthen vocational education and apprenticeship programs, so as to increase the vocational opportunities of the majority of young adults who will not get a four-year college degree.
  2. “On the policy front, work to minimize marriage penalties facing lower-income families, perhaps by offering newly married Americans a “honeymoon” period of three years where their eligibility for means-tested programs would not end if they marry—so long as their household income is below a threshold of $55,000.”
  3. “On the cultural front, launch local, state, and federal campaigns on behalf of what Haskins and Sawhill have called the “success sequence,” where young adults are encouraged to get at least a high school degree, work full-time, and marry before having any children—in that order.”
  4. “On the civic front, encourage secular and religious organizations to be more deliberate about targeting Americans without college degrees.”

This shouldn’t surprise anyone that has kept up with my posts. But it’s always nice to have some of the most updated research on the matter.