You may have heard that air quality in Beijing is hitting an all-time, low. Here are the photos to prove it.
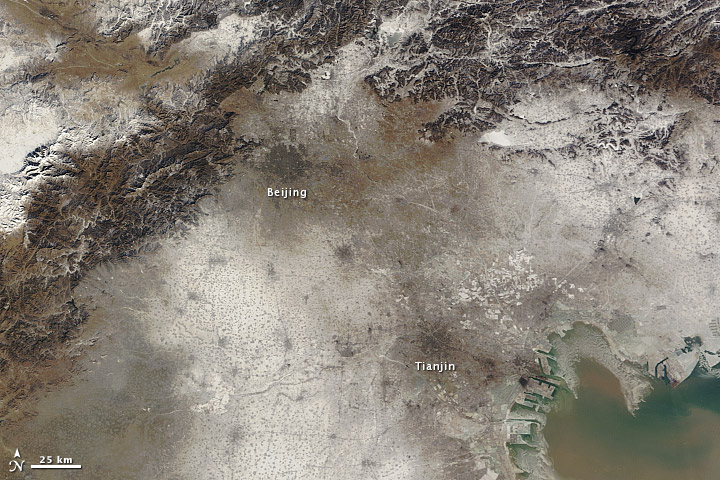
For reference, the photo above is from before the spike in pollution. Now, here’s what Beijing looked like on Jan 14, 2013 during the middle of the smog spike:
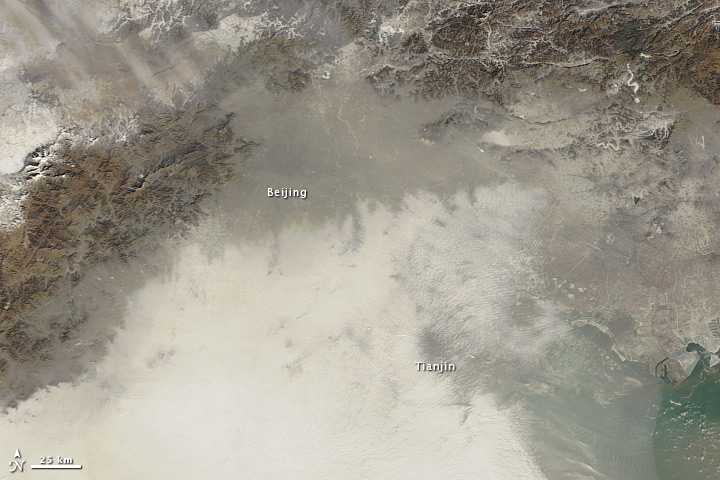
The US has its own sensors at their embassy, and so we can get some idea of just how bad the air quality really is. According to the article at NASA, Beijing had 291 micrograms of fine particulate matter (tiny particles small enough to get into the passageways of your lungs) per cubic meter of air. The safe level is considered to be 25. The air quality index at the time of the second satellite image was 341, while anything above 100 is considered dangerous to all human beings (not just those already sick), and a level of below 50 is considered healthy. That’s bad enough, but the peak was actually on Jan 12 (two days before the second satellite image) when there were 886 micrograms per cubic meter and the AQ was 775, which isn’t even on the scale the EPA uses.