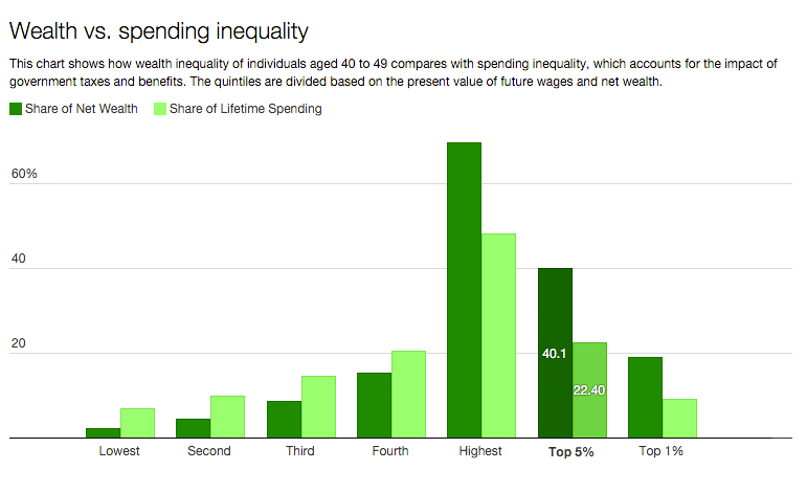
Over at The New Republic, a pair of economists report,
In a just-released study, we provide the first picture of actual U.S. inequality. We account for inequality in labor earnings and wealth, as Thomas Piketty and many others do. And we get to the bottom line: what does inequality in spending look like after accounting for government taxes and benefits? Our findings dramatically alter the standard view of inequality and inform the debate on whether and how best to reduce it. Our study focuses on lifetime spending inequality because economic well being depends not just on what we spend this minute, hour, week or even year. It depends on what we can expect to spend through the rest of our lives.[ref]Similar studies have been done in their measurement of poverty.[/ref]
The results?
First, spending inequality—what we should really care about—is far smaller than wealth inequality. This is true no matter the age cohort you consider. Take 40-49 year-olds. Those in the top 1 percent of our resource distribution have 18.9 of net wealth but account for only 9.2 percent of the spending. In contrast, the 20 percent at the bottom (the lowest quintile) have only 2.1 percent of all wealth but 6.9 percent of total spending. This means that the poorest are able to spend far more than their wealth would imply—though still miles away from the 20 percent they would spend were spending fully equalized.
The authors conclude,
The facts revealed in our study should change views. Inequality, properly measured, is extremely high, but is far lower than generally believed. The reason is that our fiscal system, properly measured, is highly progressive. And, via our high marginal taxes, we are providing significant incentives to Americans to work less and earn less than they might otherwise. Finally, traditional static measures of inequality, fiscal progressivity and work disincentives that a) focus on immediate incomes and net taxes rather than lifetime spending and lifetime net taxes and b) lump the old together with the young create highly distorted pictures of all three issues.
Check it out.

Interesting! I find the basic approach fascinating, but some of the assumptions really problematic. For example, they assume that everyone has access to credit sufficient to smooth out their lifetime earnings, but that seems highly implausible. Furthermore, they assume all spending is equal, but one if the major problems of inequality is that it’s so expensive to be poor. If you can’t pay one of your bills this month, you’ll pay a penalty next month, but that spending doesn’t get you any additional heat, water, or medical care. So the efficiency of spending is likely quite a bit greater for those with greater wealth.
So it seems to me like a pretty interesting method has been put to use with some rather troubling assumptions about the ideal tax system and with surprisingly poor attention to contrary effects. Still a neat idea, though.