Like a lot of #NeverTrumpers, I was really excited when Nate Silver’s 538 ran articles like How Evan McMullin Could Win Utah And The Presidency and Polls May Be Underestimating Evan McMullin’s Chances in Utah in late October. Trump’s “Mormon problem” had been an ongoing feature of the 2016 campaign[ref]See McKay Coppins Donald Trump’s Mormon Problem at the NYT for an overview.[/ref] and–back when I was sure Hillary Clinton would win–I wanted nothing more than for Utah to buck the trend and refuse to go for Trump.
It didn’t happen. When the dust settled, not only had Trump carried the presidency, but he’d also carried Utah by a wide margin: he took 46.8% of the vote, compared to 27.8% for Clinton and 20.4% for McMullin. So much for the “Mormon problem,” I guess.
Not so fast.
As my friend Nate Oman wrote a couple of days ago, one way to look at how Trump fared in Utah this year is to compare how much of the vote he got in 2016 vs. how much the Republican candidate (Mitt Romney) got in 2012. You could call this gap the “vote swing,” and if you really want to know if there’s any substance to the idea of a “Mormon problem,” you’ve got to compare Utah’s vote swing to the vote swings for the rest of the country. This is how that looks:
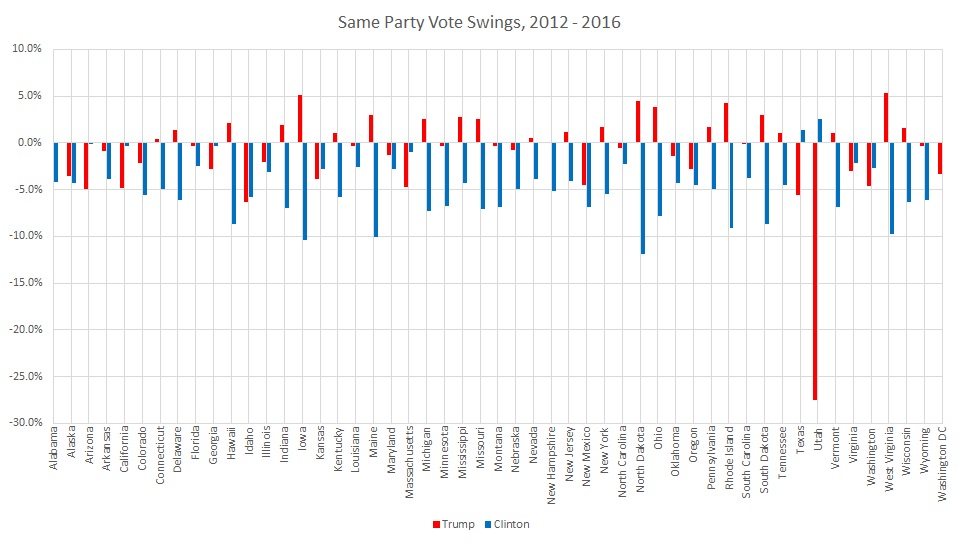
This is definitely an interesting chart. You can see, for example, that Clinton had a negative swing in almost every single state, whereas Trump had a mixture of positive and negative swings. But–for the question at hand–we can see quite clearly that Trump’s negative swing in Utah is unlike anything else (for either candidate) in this election.
Quick technical note before we move on. If there were only two candidates in 2016 and in 2012, then one candidate’s negative swing would equal another candidate’s positive swing, but that’s not the case. Although third parties didn’t have a major impact on the national level, McMullin took over 20% of Utah’s votes. That’s why Trump has such a starkly negative swing for 2016, but Clinton’s positive swing is quite small.
Now, before we move on, you might be suspicious. After all, Mitt Romney wasn’t just any Republican candidate in 2012. He was a specifically Mormon candidate, so maybe it’s not so much that Trump has a huge Mormon problem as it is that Mitt Romney just did unusually well in 2012. Well, based on the data, that’s not really the case. Romney took 74.6% of Utah’s votes in 2012 and McCain took only 64.5% in 2008, but in 2004 Bush did just about as well as Romney with 73.3% of the votes, and he also did quite well in 200 with 68.3%. So the Romney-Trump swing was 27.6%, but if we used the average of non-Romney Republican candidates over the previous few elections, the swing is still 21.7%, much higher than any other swing in 2016. In short: Mormons disliked Trump a lot more than they liked Romney.
Nate was curious to get a bit more historical context, however, and so he sent me a data set containing the electoral results for every presidential election going back to 1828. I ran some very quick analysis at the time, and he posted an addendum here. I’ve had a bit more time to go through the data since then, however, and so I want to share a few more observations of my own.
First, a couple more notes. I couldn’t actually use all of the data from 2016-1828 because in several cases there were third parties (or even fourth parties) that attracted significant votes. The whole idea of “vote swing” only works if you’re dealing with basically two candidates from the same parties. So I only included pairs of consecutive elections where:
- Third parties captured 5% or less of the national vote in both elections
- The candidates from the primary two parties were from the same party in both elections
Doing this left me with 20 pairs of elections to look at. Since the data is older than some states, I ended up with 971 individual elections. Finally, to keep things a little simpler, I only used one vote swing for each year. In those years where there were no third party candidates at all, this was simple, because whatever votes one candidate gains come from the other candidate, and so the vote swings are equal anyways. (One is positive, one is negative.) Since I included some elections where third party candidates took up to 5%, I couldn’t rely on the vote swings being identical, so instead I just took the absolute value of the maximum vote swing.
OK, methodological notes aside, here’s what the histogram of vote swings looks like for all the eligible elections between 2016 and 1828:
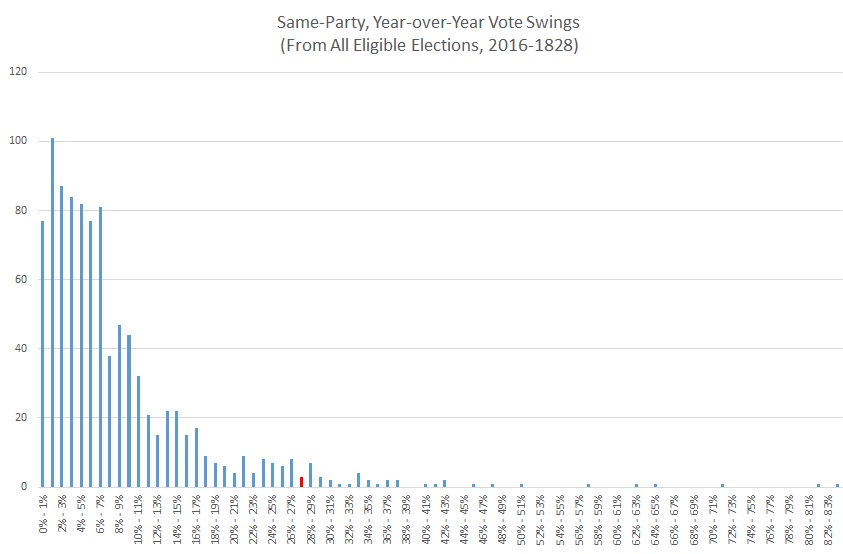
From this chart, you can see that the vast majority of vote swings are less than 10%, and that a vote swing of over 27% is very rare but not unprecedented. To be exact, there were 932 vote swings less than Utah’s 2016 swing and 38 vote swings more than Utah’s 2016 swing. That puts Utah’s vote swing this year in the 96th percentile.[ref]If we use the average of the last 4 elections without Romney and get a Utah swing of 21.7% instead of 27.6%, that’s still in the 92nd percentile.[/ref]
So that makes the 2016 defection from Trump very unusual, but far from unprecedented. There were larger swings than Utah’s 2016 swing in elections from 1976, 1964, 1952, 1948, 1932, 1920, and 1900. However, when we look at those years, something else pops out of the data that makes the Utah swing this year even more unusual.
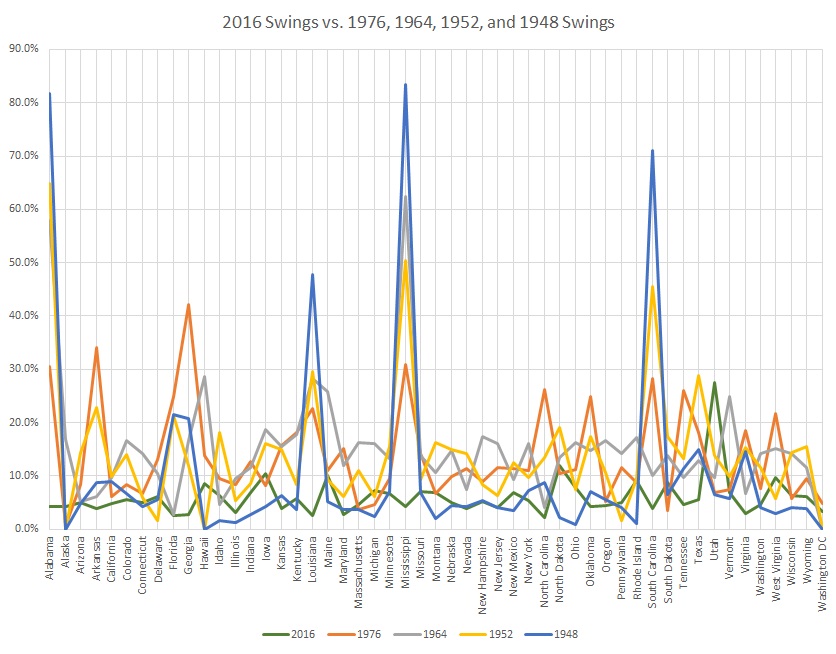
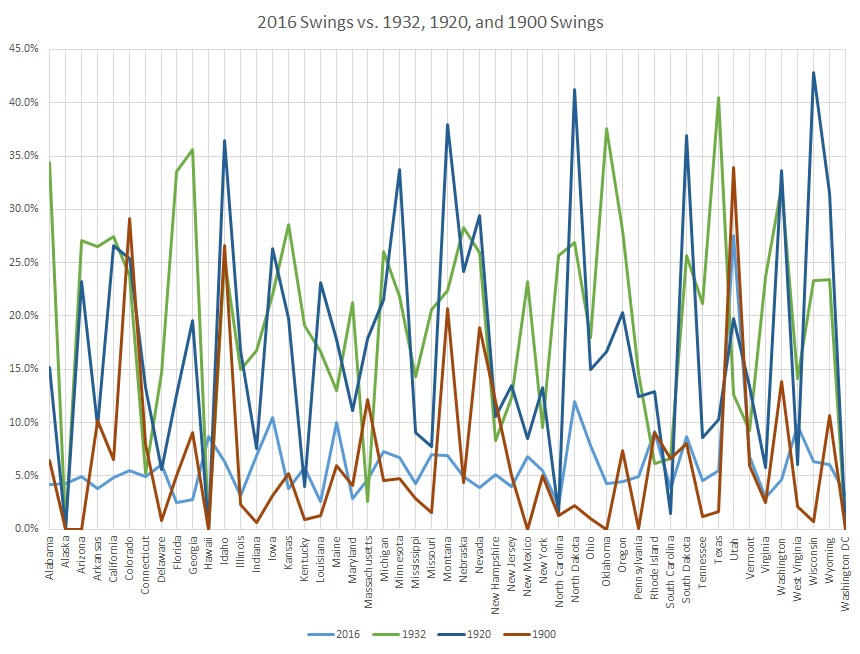
So the thing that should be sticking out in both of these charts is that in the other years with major vote swings, these were national or regional phenomena. I’ll make a few annotations to see if I can draw that out:
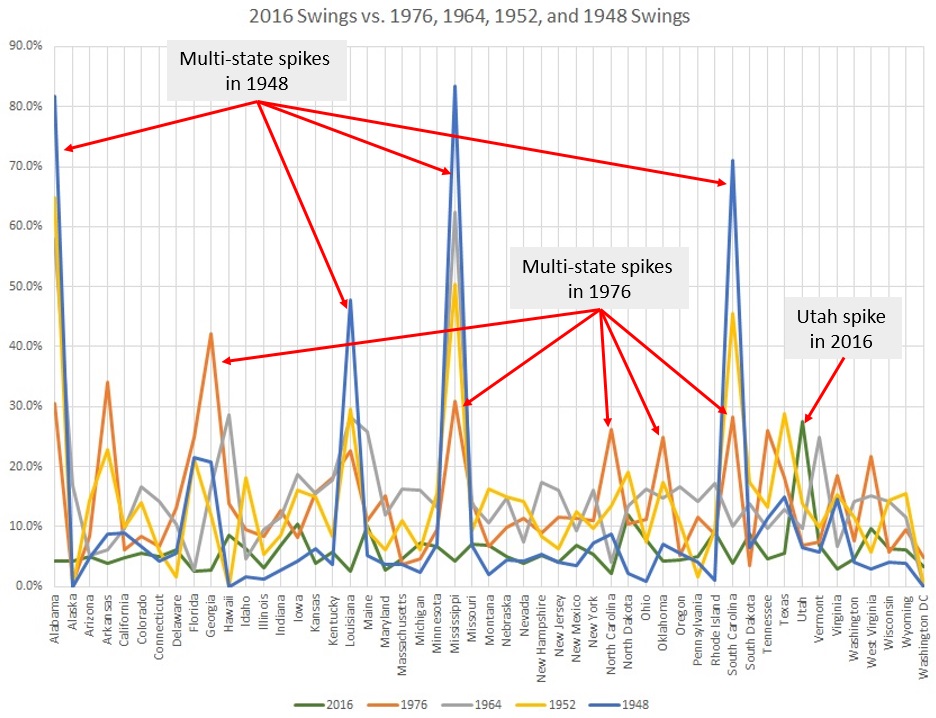
So, in the years where there were bigger vote swings than Utah’s in 2016, there were much bigger vote swings across the nation as a whole and there were significant spikes in multiple states (usually states in the Deep South, for obvious historical reasons.) What sets Utah apart is not just that the anti-Trump vote swing was very high, but also that it happened in a year where the rest of the vote swing was actually pretty mild and that it was localized in just a single state.
There’s another way to measure that, by the way, which is to look at the difference between the maximum vote swing and the 2nd highest vote swing. So the all-time greatest vote swing was in Mississippi in 1948 at 83.5%, but during the same election Alabama had a vote swing of 81.7%.[ref]Other states were involved as well: South Carolina with a vote swing of 71.0% and Louisiana with a vote swing of 47.9%.[/ref] So the gap between the highest vote swing and the second-highest was really small: just 1.8 percentage points.
Contrast that with 2016. Utah had a 27.6% swing and the next-highest was 11.9% in North Dakota. The gap between the two was 15.6%. It turns out, that was higher than the gap between the largest and second-largest swing in any other election year.
So that “Mormon problem” that everyone was talked about? Even though Trump managed to take Utah, it’s still totally a thing. He suffered a historically large election-over-election vote swing as Utah voters abandoned the GOP for third parties, for the Democrats, or to just stay home. It’s not the resounding repudiation I’d hoped for with an Evan McMullin win, but it’s still a pretty clear signal.
And, before we wrap this up, it’s worth noting that when it comes to Mormons’ anti-Trump sentiment, the feeling is mutual. Just yesterday, Trump picked Steve Bannon as his senior adviser (think: Karl Rove). Bannon was the CEO of Trump’s campaign and, before that, he took over Breitbart after founder Andrew Breitbart passed away and turned it into the alt-right mouthpiece it is today. Along the way, he’s taken pot-shots at Mormons more than once, including calling Mitt Romney’s sons out for serving full-time missions and running an anti-Mormon, anti-immigration piece from Tom Tancredo. With Evan McMullin continuing his conservative insurgency and Trump placing anti-Mormon advisers in top positions, the Mormon/Republican rift is unlikely to narrow–let alone heal completely–any time soon.[ref]Jonah Goldberg of the National Review has some cogent thoughts on this one.[/ref]
Do you think it is consistent with your interpretation to say that what was unique here was a 3rd party candidate with local appeal that lacked national appeal?
Beautiful charts, great statistical analysis! Really, really nice job on this.