Look How Far We’ve Come

Oxford’s Max Roser has provided a much-needed ray of sunshine given the past week’s events. Roser writes,

A recent survey asked “All things considered, do you think the world is getting better or worse, or neither getting better nor worse?”. In Sweden 10% thought things are getting better, in the US they were only 6%, and in Germany only 4%. Very few people think that the world is getting better.

What is the evidence that we need to consider when answering this question? The question is about how the world has changed and so we must take a historical perspective. And the question is about the world as a whole and the answer must therefore consider everybody. The answer must consider the history of global living conditions – a history of everyone.

Roser tackles several issues, but I’ve selected just four:

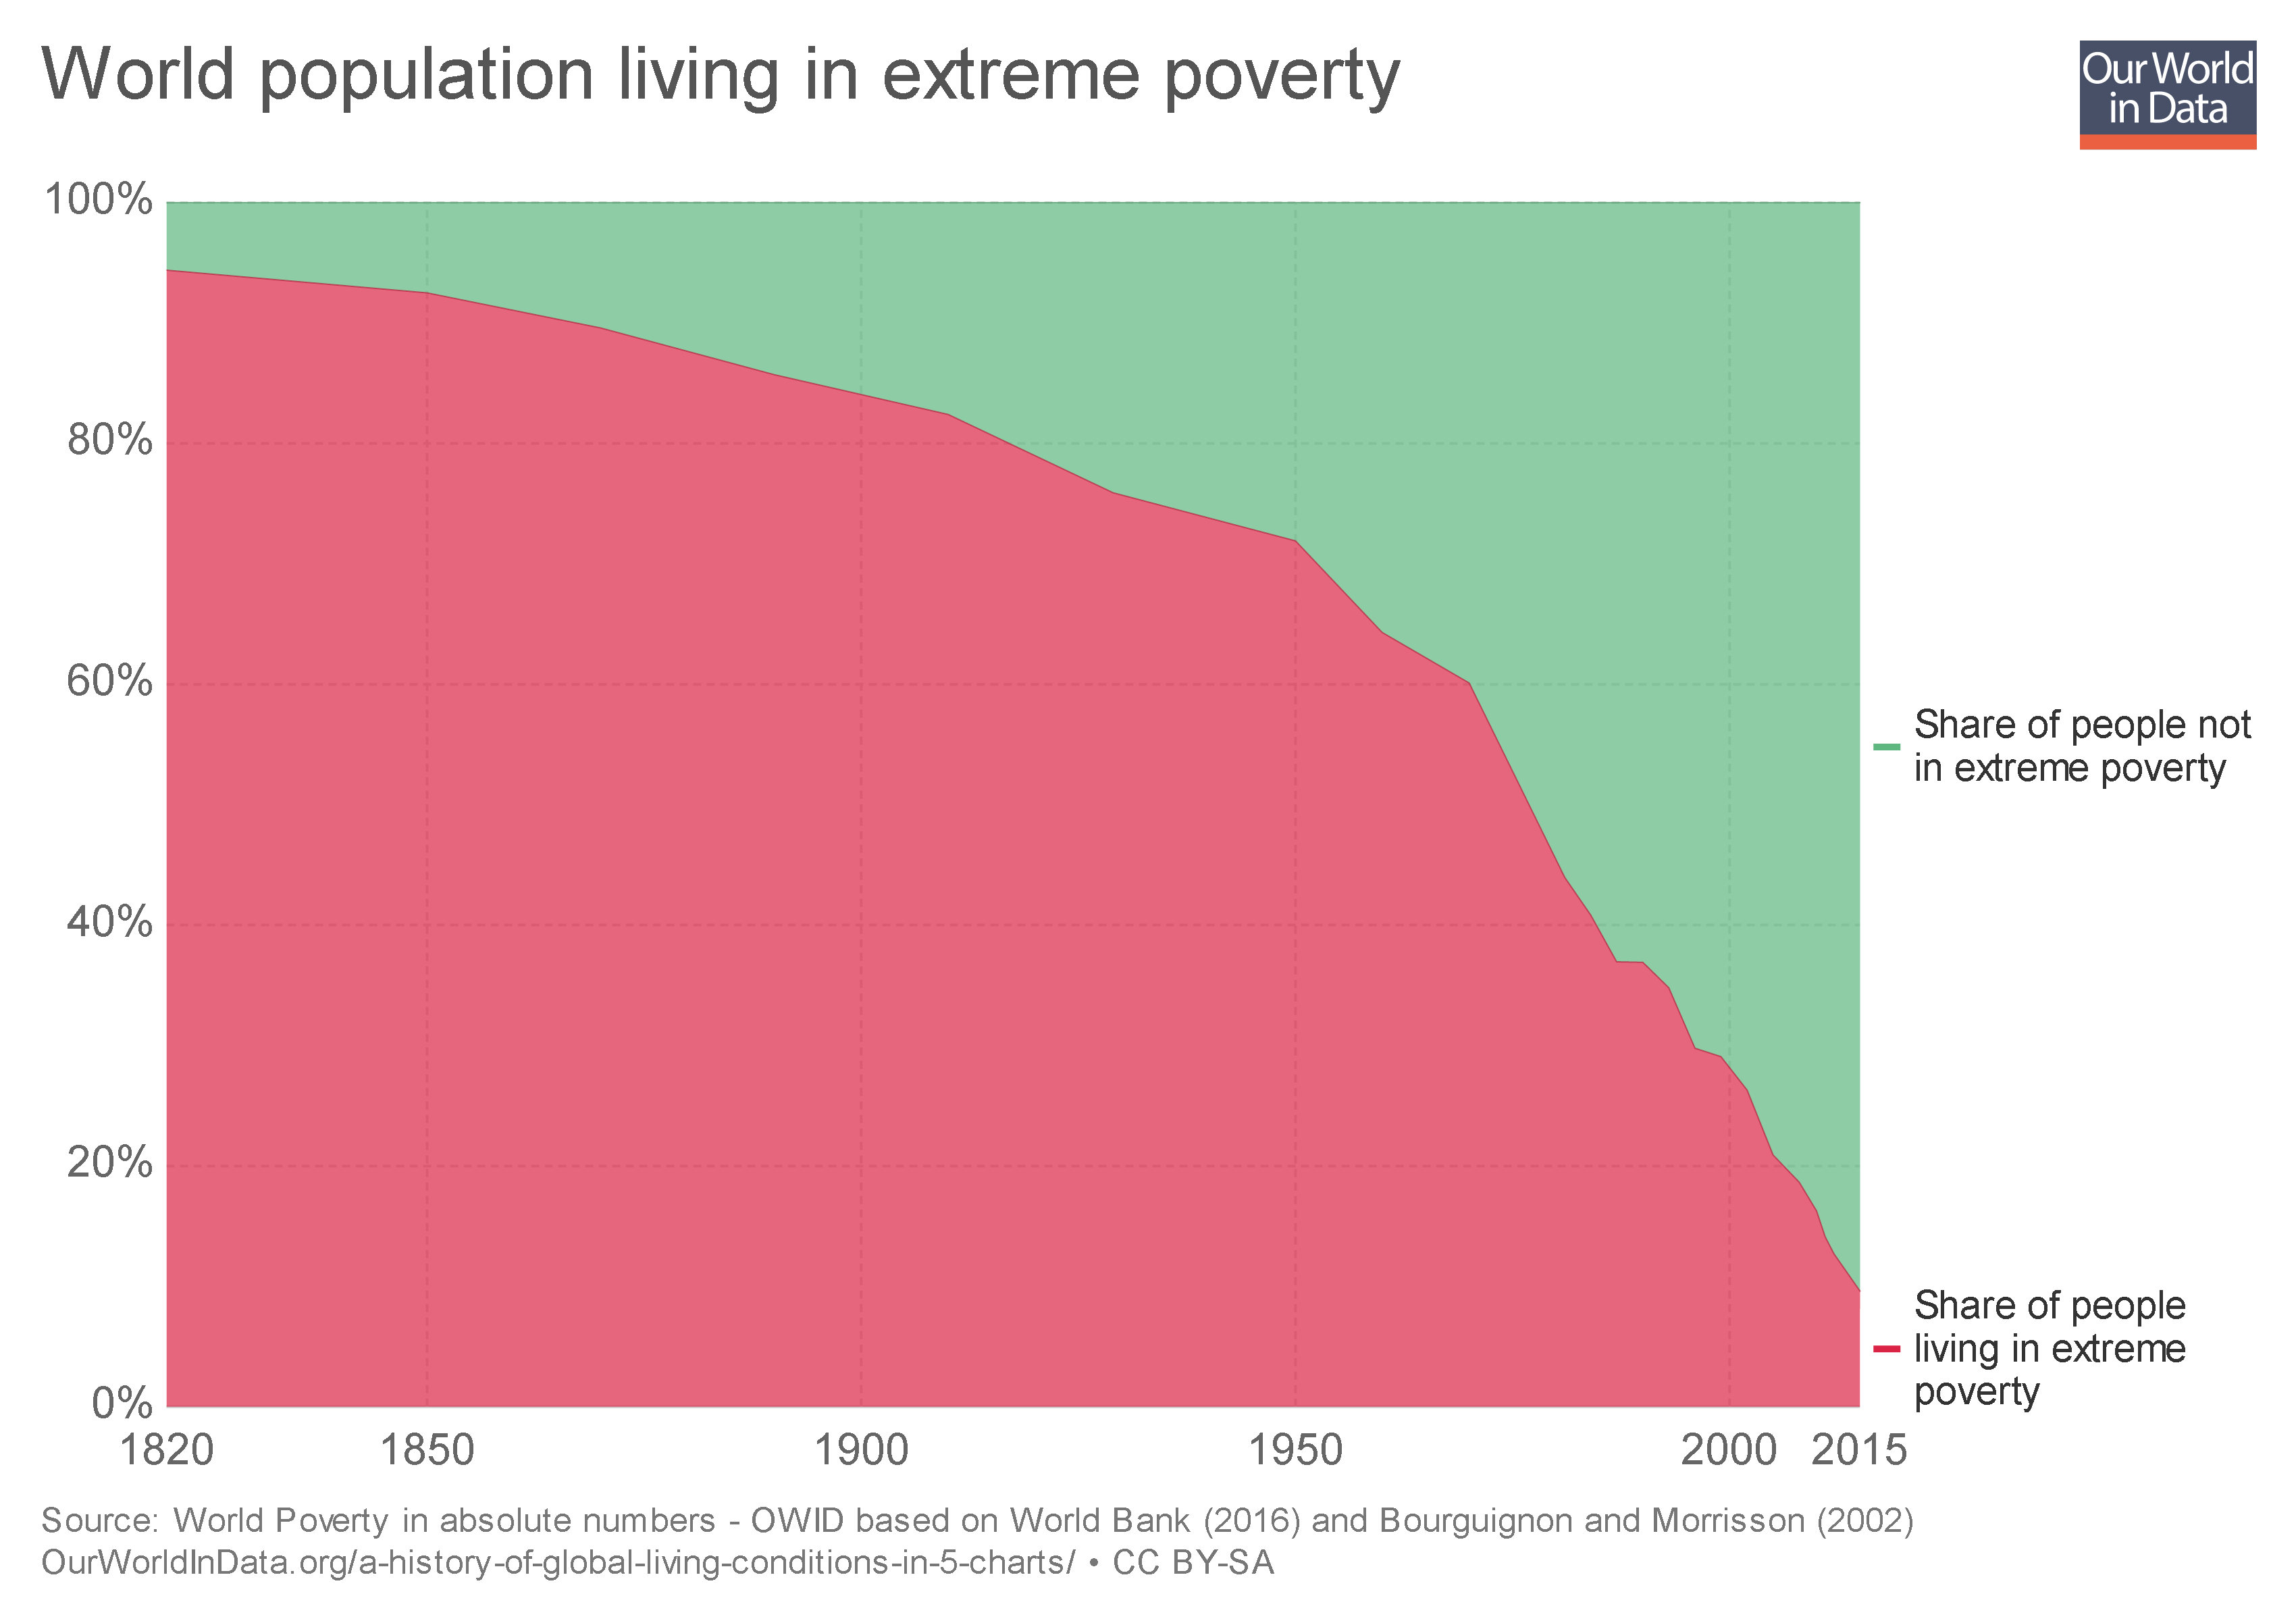
  • Poverty: “Take a longer perspective and it becomes very clear that the world is not static at all. The countries that are rich today were very poor just very recently and were in fact worse off than the poor countries today. To avoid portraying the world in a static way – the North always much richer than the South – we have to start 200 years ago before the time when living conditions really changed dramatically…The first chart shows the estimates for the share of the world population living in extreme poverty. In 1820 only a tiny elite enjoyed higher standards of living, while the vast majority of people lived in conditions that we would call extreme poverty today. Since then the share of extremely poor people fell continuously. More and more world regions industrialised and thereby increased productivity which made it possible to lift more people out of poverty: In 1950 three-quarters of the world were living in extreme poverty; in 1981 it was still 44%. For last year research suggests that the share in extreme poverty has fallen below 10%.”

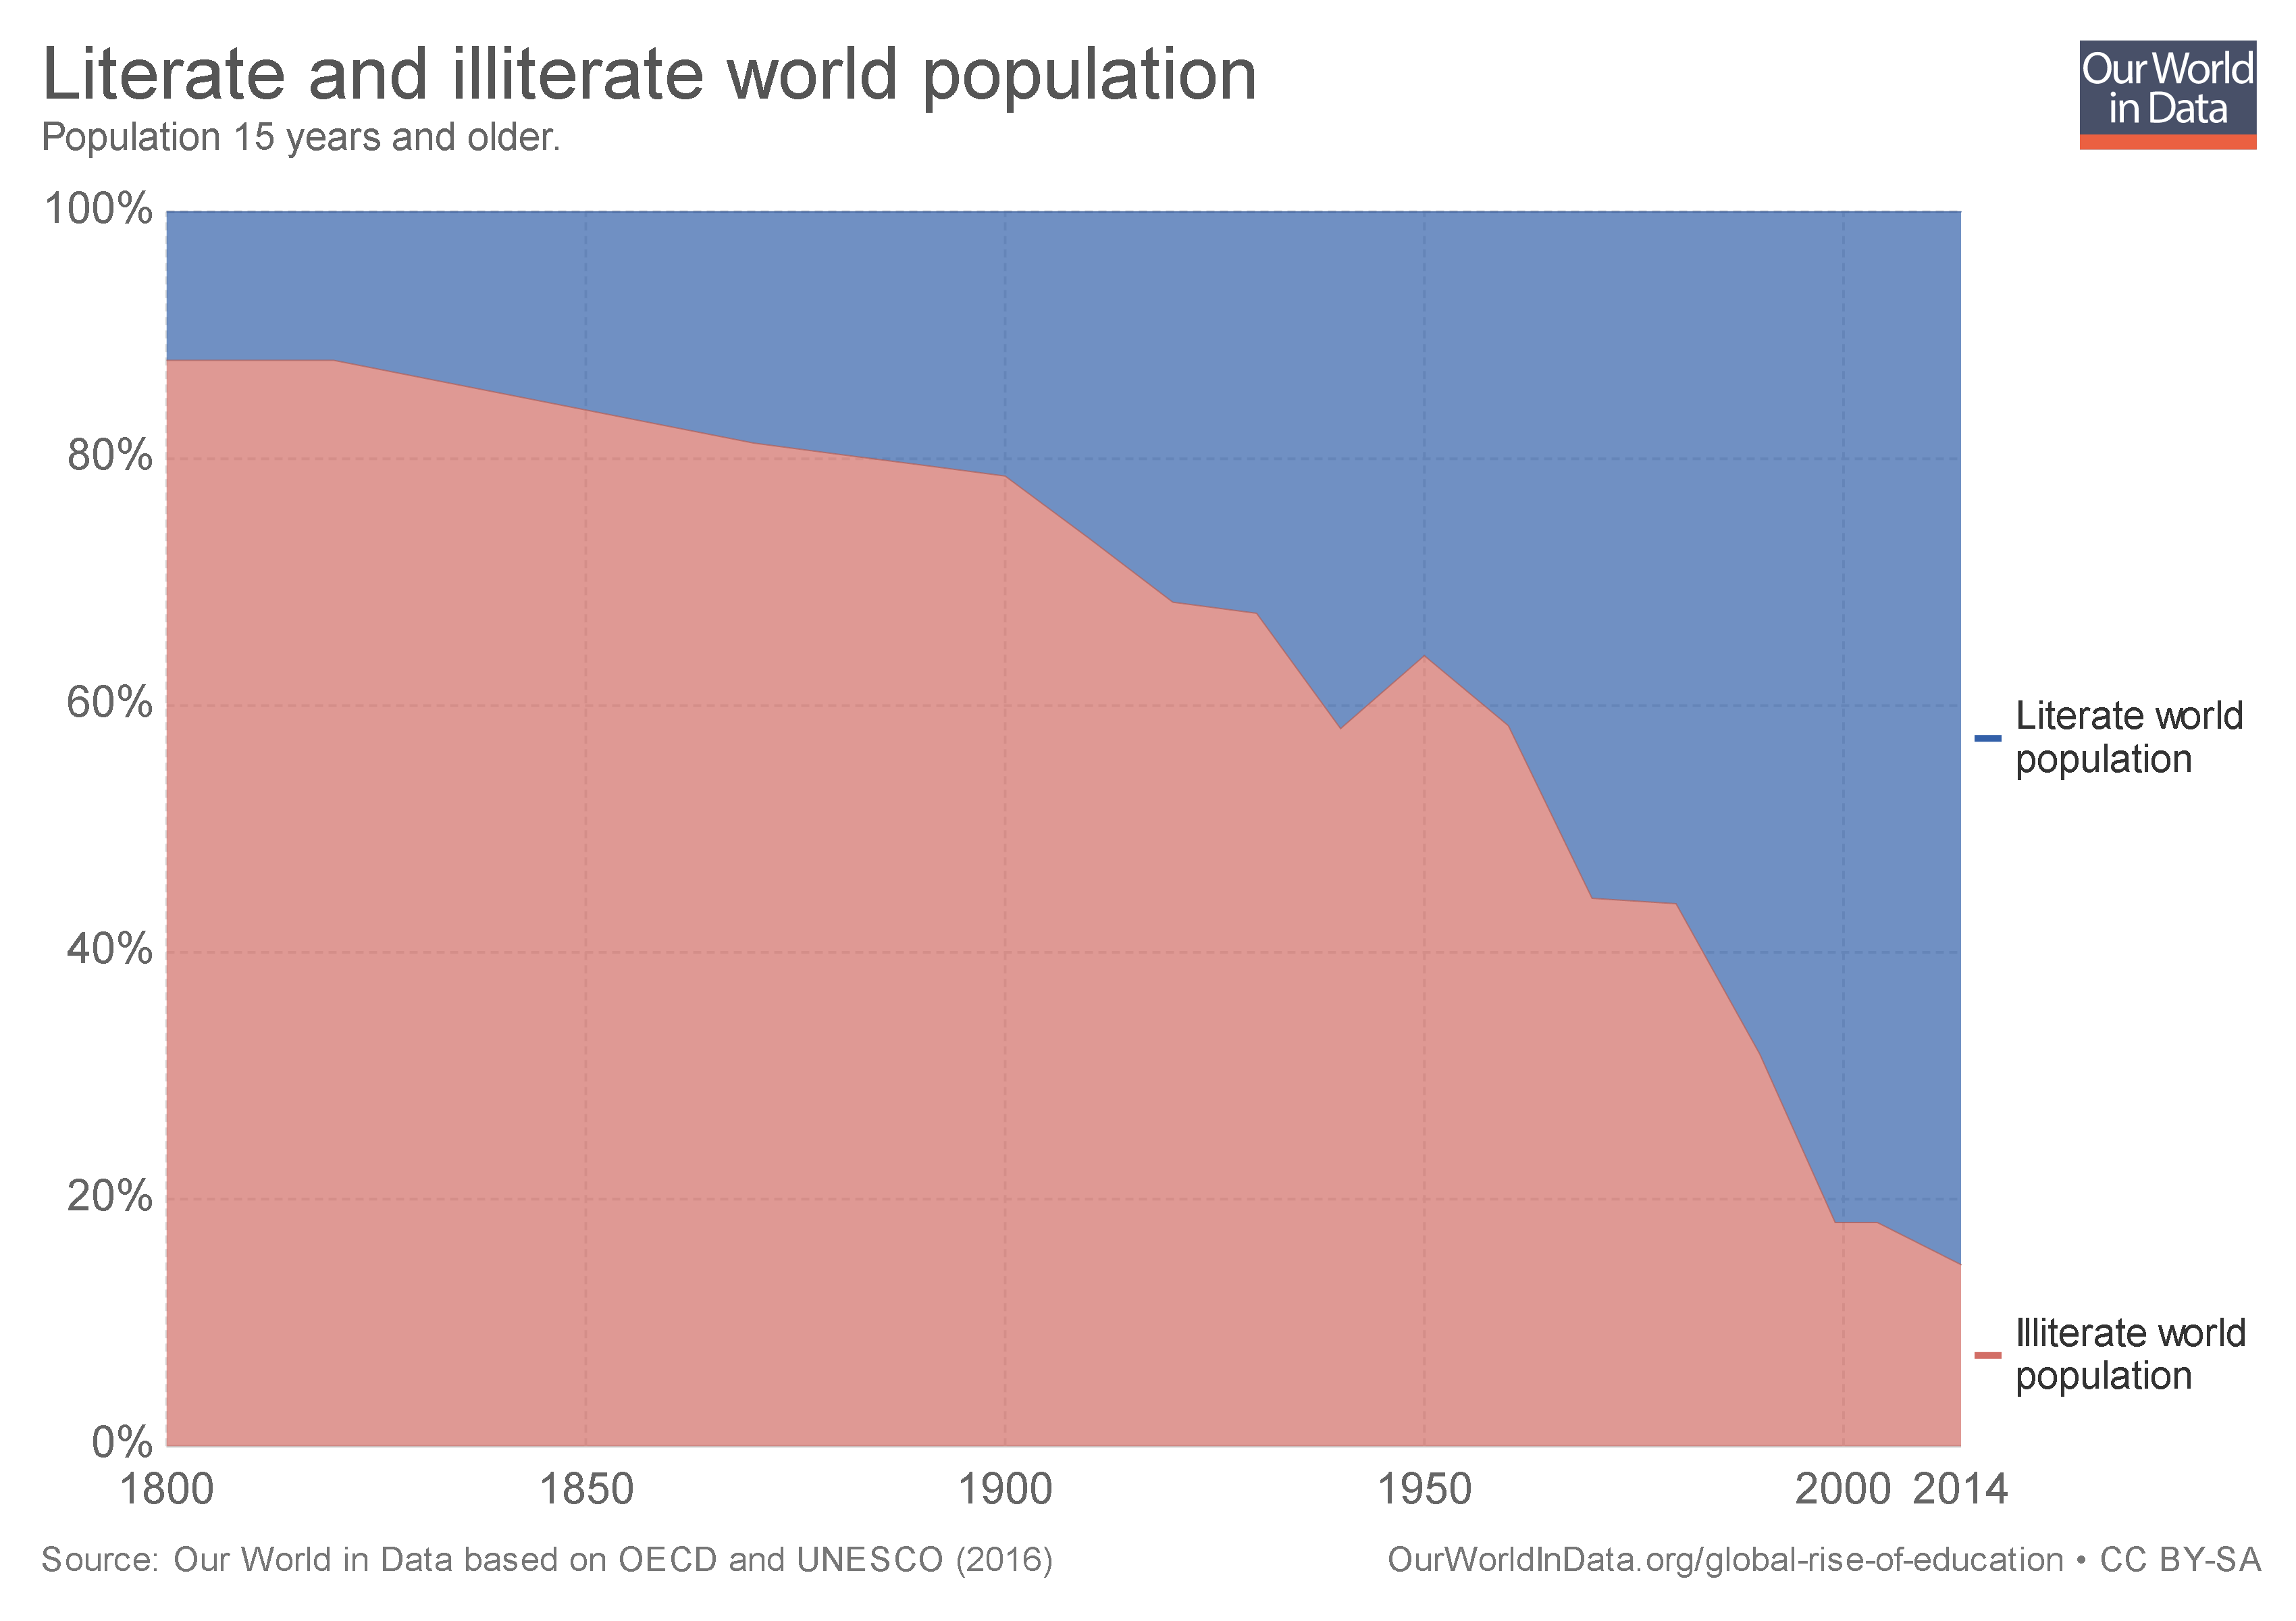
  • Literacy: “How did the education of the world population change over this period? The chart below shows the share of the world population that is literate over the last 2 centuries. In the past only a tiny elite was able to read and write. Today’s education – including in today’s richest countries – is again a very recent achievement. It was in the last two centuries that literacy became the norm for the entire population.”

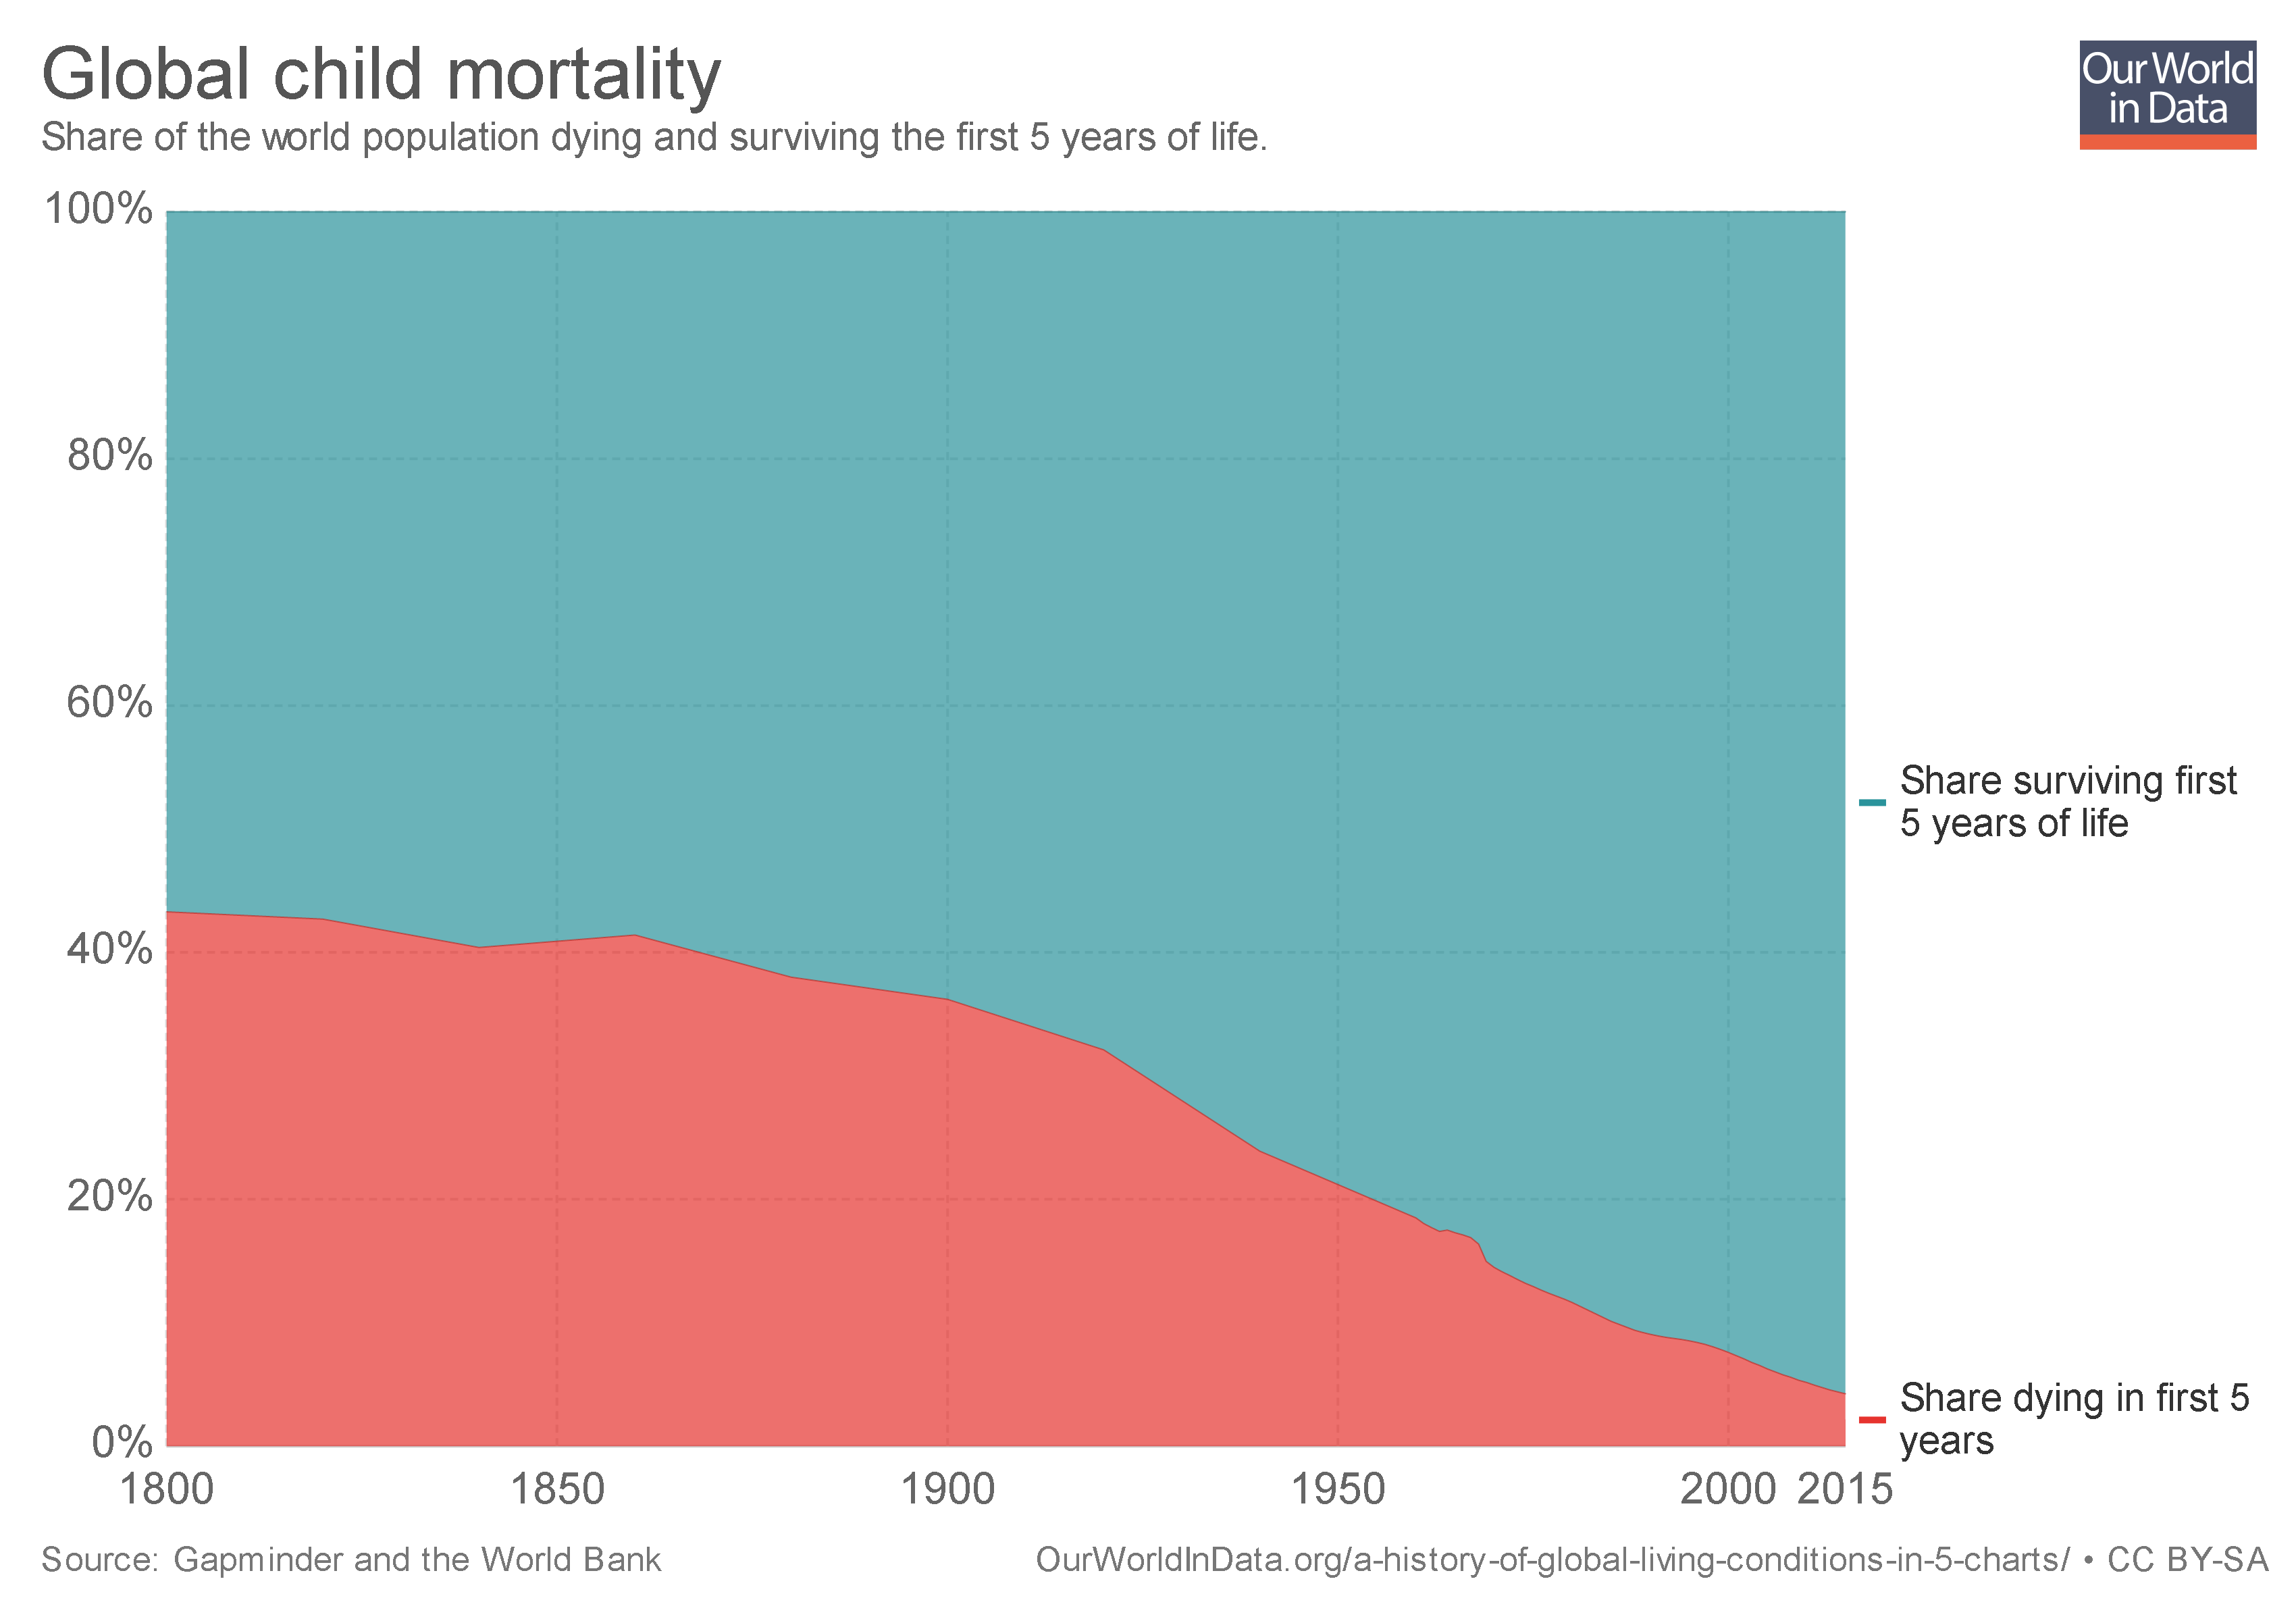
  • Health: “In 1800 the health conditions of our ancestors were such that around 43% of the world’s newborns died before their 5th birthday. The historical estimates suggest that the entire world lived in poor conditions; there was relatively little variation between different regions, in all countries of the world more than every third child died before it was 5 years old…In 2015 child mortality was down to 4.3% – 10-fold lower than 2 centuries ago. You have to take this long perspective to see the progress that we have achieved.”

  • Freedom: “Political freedom and civil liberties are at the very heart of development – as they are both a means for development and an end of development…The chart shows the share of people living under different types of political regimes over the last 2 centuries. Throughout the 19th century more than a third of the population lived in colonial regimes and almost everyone else lived in autocratically ruled countries. The first expansion of political freedom from the late 19th century onward was crushed by the rise of authoritarian regimes that in many countries took their place in the time leading up to the Second World War. In the second half of the 20th century the world has changed significantly: Colonial empires ended, and more and more countries turned democratic: The share of the world population living in democracies increased continuously – particularly important was the breakdown of the Soviet Union which allowed more countries to democratise. Now more than every second person in the world lives in a democracy. The huge majority of those living in an autocracy – 4 out of 5 – live in one autocratic country: China. Human rights are similarly difficult to measure consistently over time and across time. The best empirical datashow that after a time of stagnation human right protection improved globally over the last 3 decades.”

Roser concludes,

For our history to be a source of encouragement we have to know our history. The story that we tell ourselves about our history and our time matters. Because our hopes and efforts for building a better future are inextricably linked to our perception of the past it is important to understand and communicate the global development up to now. A positive lookout on the efforts of ourselves and our fellow humans is a vital condition to the fruitfulness of our endeavors. Knowing that we have come a long way in improving living conditions and the notion that our work is worthwhile is to us all what self-respect is to individuals. It is a necessary condition for self-improvement.

Freedom is impossible without faith in free people. And if we are not aware of our history and falsely believe the opposite of what is true we risk losing faith in each other.

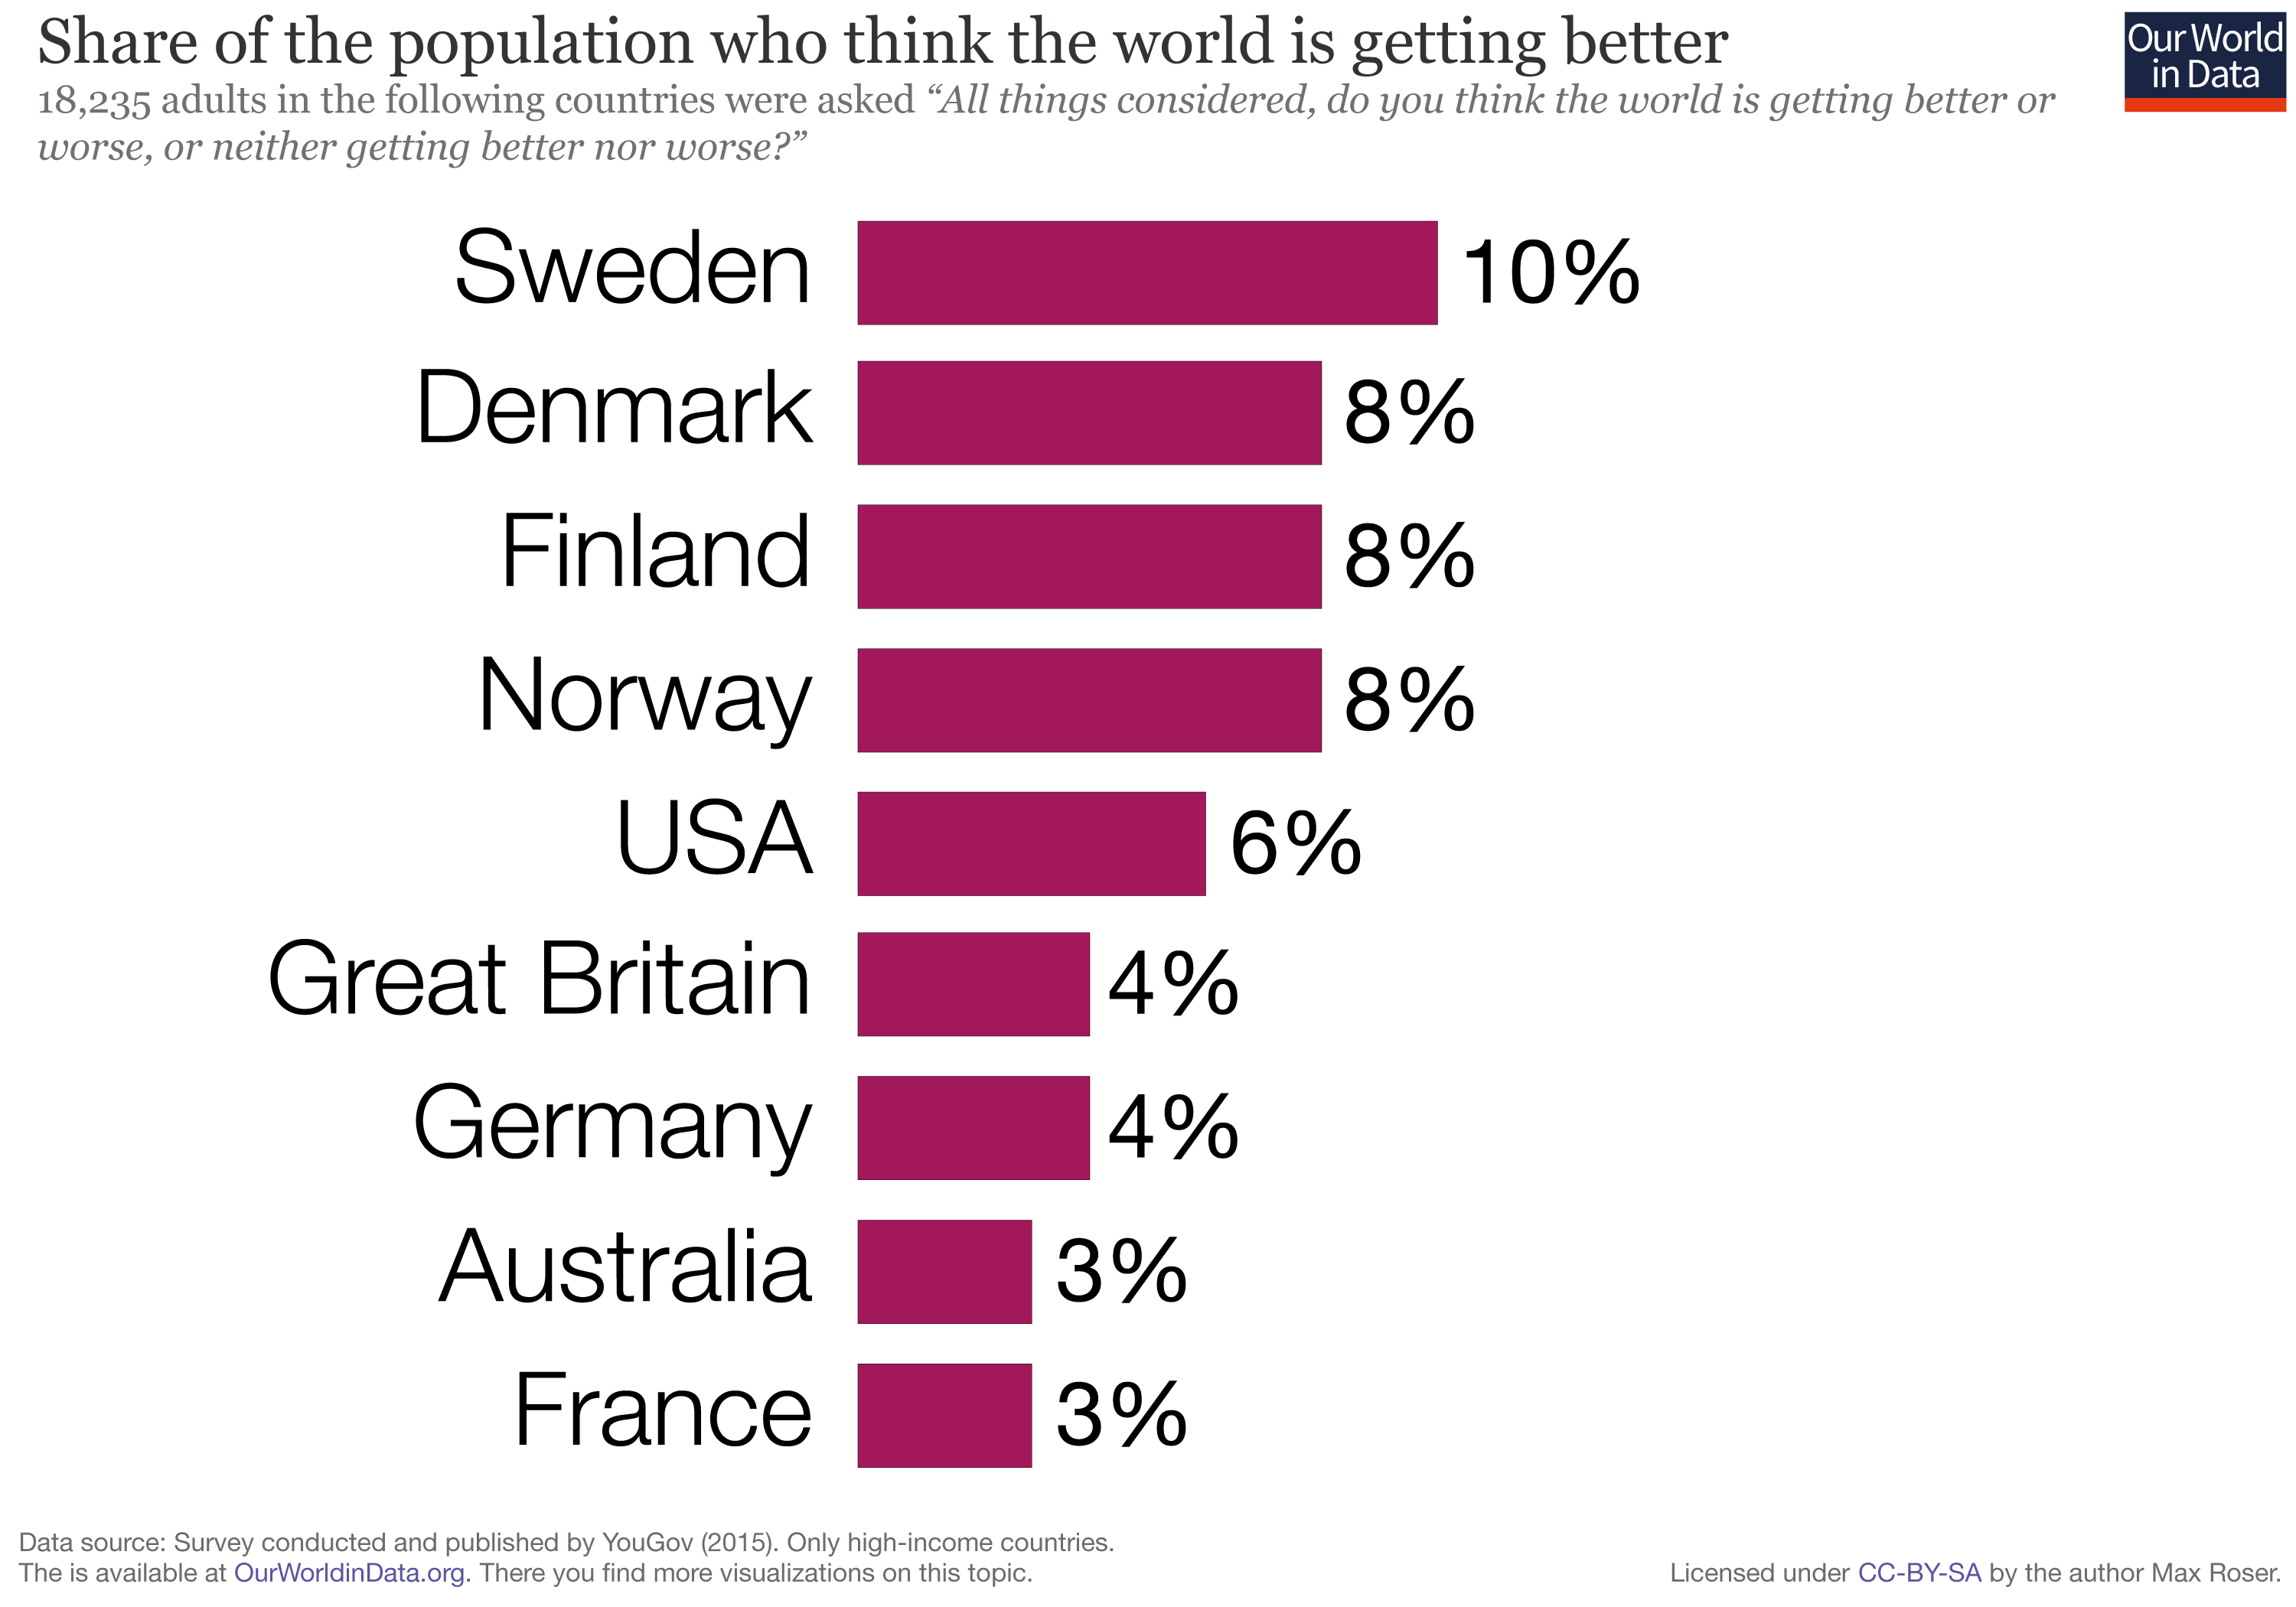
Image result for look around at how lucky we are to be alive gif

Should government food assistance programs have nutritional requirements?

Some of the foods you can purchase through WIC.

Probably.

There’s good reason to believe that adding nutritional requirements to government food programs is a better use of money and leads to better health outcomes for the people in said programs.

WIC (Women, Infants, and Children) is a state-run program that helps low-income women and children purchase healthy food. WIC has specific guidelines for the quantities and types of food recipients can purchase, all of which have to meet certain health standards. In this program there is no way to purchase soda, candy, pizza, baked sweets, ice cream, etc. SNAP (Supplemental Nutrition Assistance Program, often referred to as “food stamps”) is a federally-funded program helping low-income people purchase almost any food.

The USDA explains that SNAP is for purchasing any food or food product for home consumption and that this definition includes “soft drinks, candy, cookies, snack crackers, and ice cream” and similar items. Data suggest these types of purchases make up at least 17% of SNAP spending .[ref]To get this number I added the percentages for the following categories: soft drinks, candy – packaged, frozen pizza, ice cream ice milk & sherberts, cookies, cakes, bacon, baked sweet goods, candy – checklane, sweet goods, ramen, frozen desserts, popcorn, dry mix desserts, pies, cookie/cracker multi packs, cocoa mixes, sweet goods & snacks, salty snacks, refrigerated desserts, single serve sweet goods, single serve cookie/cracker, and cake decor. There were many other categories that could arguably be categorized as unhealthy food or “junk food,” but if they were debatable I left them out.[/ref] In 2017, about 42 million people used SNAP at an average of $125.79 per person per month, meaning the government spent about $11.3 billion that year buying junk food for low-income people. What are the arguments for spending so much on junk rather than using those funds to ensure low-income people have high quality food?

Opponents of SNAP nutritional requirements give many reasons for why nutritional requirements are not feasible or effective: we can’t come up with clear standards for what is “healthy,” it would be too complicated and costly to implement such standards, restrictions wouldn’t stop people from buying unhealthy food with their own money, and people in higher income brackets purchase similar amounts of unhealthy food.[ref]Whether this last argument is true or not is a bit tangential. Research shows lower SES people have poorer nutrition and health outcomes than people with higher income. Improving nutrition is one (important) approach to bridging that gap.[/ref]

Yet WIC has managed to define what constitutes healthy food and implement a program based on those boundaries. In fact the USDA describes WIC as “one of the nation’s most successful and cost-effective nutrition intervention programs.” There is evidence to suggest people participating in WIC (especially children) have better nutrition and health outcomes than their peers. Conversely, there is evidence to suggest people who receive SNAP benefits have worse nutrition than income-eligible people who don’t participate in SNAP. For example:

Changing WIC changes what children eat – May 2013

Comparing July to December in 2008 and 2011, increases were observed in breastfeeding initiation (72.2-77.5%); delaying introduction of solid foods until after 4 months of age (90.1-93.8%); daily fruit (87.0-91.6%), vegetable (78.1-80.8%), and whole grain consumption (59.0-64.4%) by children aged 1-4 years; and switches from whole milk to low-/nonfat milk by children aged 2-4 years (66.4-69.4%). In 1-year-old children, the proportion ≥95th percentile weight-for-recumbent length decreased from 15.1 to 14.2%; the proportion of children 2- to 4-year-old with body mass index (BMI) ≥95th percentile decreased from 14.6 to 14.2%.

Trends in Obesity Among Participants Aged 2–4 Years in the Special Supplemental Nutrition Program for Women, Infants, and Children – November 2016

The prevalence of obesity among young children from low-income families participating in WIC in U.S. states and territories was 14.5% in 2014. This estimate was higher than the national estimate (8.9%) among all U.S. children in a slightly different age group (2–5 years) based on data from the 2011–2014 National Health and Nutrition Examination Survey (7). Since 2010, statistically significant downward trends in obesity prevalence among WIC young children have been observed overall, in all five racial/ethnic groups, and in 34 of the 56 WIC state agencies, suggesting that prevention initiatives are making progress, potentially by impacting the estimated excess of calories eaten versus energy expended for this vulnerable group (8).

The Supplemental Nutrition Assistance Program – September 2015

Child SNAP recipients consume more sugary beverages, processed meats, and high-fat dairy products, but fewer nuts, seeds, and legumes than income-eligible nonparticipants. Similarly, adult SNAP recipients consume more fruit juice, potatoes, red meat, and sugary beverages, but fewer whole grains than income-eligible nonparticipants. In another study, SNAP participants had lower dietary quality scores overall, and consumed significantly fewer fruits, vegetables, seafood, and plant proteins, but significantly more added sugar than income-eligible nonparticipants.

The study specifically compares SNAP nutrition to WIC nutrition:

In one study comparing the grocery store purchases of SNAP and WIC households in New England, SNAP households purchased more than double the amount of sugary beverages per month (399 ounces) than WIC households (169 ounces), 72% of which were paid for with SNAP dollars. In a 3-month study, new SNAP participants significantly increased their consumption of refined grains compared with low-income people who did not join. In a study of Hispanic Texan women, SNAP participants consumed 26% more sugary beverages and 38% more sweets and desserts than low-income nonparticipants.

Furthermore, most of the people who use SNAP believe the program should not allow recipients to purchase unhealthy food:

54% of SNAP participants supported removing sugary drinks from SNAP eligibility. In another survey of 522 SNAP stakeholders, 78% of respondents agreed that soda, and 74% agreed that “foods of low nutritional value” such as candy and sugar-sweetened fruit drinks should not be eligible for purchase with benefits. Seventy-seven percent of respondents believed that SNAP benefits should be consistent with the DGAs [Dietary Guidelines for Americans], and 54% thought that SNAP should be reformulated into a defined food package similar to WIC.

I want to live in a society where people are healthy and no one goes hungry. SNAP can and should serve both goals.

48 Rules of Life

Image result for 12 rules of lifeThe controversial Canadian psychologist Jordan Peterson has a new book out titled 12 Rules of Life: An Antidote to Chaos. His rules are:
  1. Stand up straight with your shoulders back.
  2. Treat yourself like you would someone you are responsible for helping.
  3. Make friends with people who want the best for you.
  4. Compare yourself with who you were yesterday, not with who someone else is today.
  5. Do not let your children do anything that makes you dislike them.
  6. Set your house in perfect order before you criticise the world.
  7. Pursue what is meaningful (not what is expedient).
  8. Tell the truth – or, at least, don’t lie.
  9. Assume that the person you are listening to might know something you don’t.
  10. Be precise in your speech.
  11. Do not bother children when they are skate-boarding.
  12. Pet a cat when you encounter one on the street.

The “12 rules” has become a kind of meme. Here are economist Tyler Cowen’s 12 rules (more in the link):

  1. Assume your temperament will always be somewhat childish and impatient, and set your rules accordingly, knowing that you cannot abide by rules for rules sake.
  2. Study the symbolic systems of art, music, literature. and religion, if only to help yourself better understand alternative points of view in political and intellectual discourse.
  3. When the price goes up, buy less.
  4. Marry well.
  5. Organize at least some significant portion of your knowledge of the world in terms of place, whether by country, region, or city.
  6. When shooting the basketball, give it more arc than you think is necessary.  Consistently.
  7. Learn how to learn from those who offend you.
  8. Cultivate mentors, and be willing to serve as mentors to others.  This never loses its importance.
  9. I don’t know.
  10. Heed Cowen’s Three Laws.
  11. Do not heed Cowen’s Three Laws.
  12. Every now and then read or reread Erasmus, Montaigne, Homer, Shakespeare, or Joyce’s Ulysses, so that you do not take any rules too seriously.

From economist Russ Roberts (more in the link):

  1. Learn to enjoy saying “I don’t know.”
  2. Find something healthy to worship.
  3. Make Shabbat.
  4. Eat dinner with your family as often as possible and always without devices.
  5. Read. Read. Read.
  6. Tithe (wisely) to help create community and care for others.
  7. Don’t take the job that pays the most money.
  8. Give up a lot to be at a funeral.
  9. If your child offers you a hand to hold, take it.
  10. Know yourself.
  11. Hold your anger for a day.
  12. Be kind–everyone is in a battle.

From Megan McArdle (more in the link):

  1. Be kind.
  2. Politics is not the most important thing in the world.
  3. Always order one extra dish at a restaurant, an unfamiliar one.
  4. Give yourself permission to be bad.
  5. Go to the party even when you don’t want to.
  6. Save 25 percent of your income.
  7. Don’t just pay people compliments; give them living eulogies.
  8. That thing you kinda want to do someday? Do it now.
  9. [H]uman beings are often splendid, the world is often glorious, and nature, red in tooth and claw, also invented kindness, charity and love. Believe in that.
  10. Don’t try to resolve fundamental conflicts with your spouse or roommates.
  11. Be grateful.
  12. Always make more dinner rolls than you think you can eat.

Glean what you will.

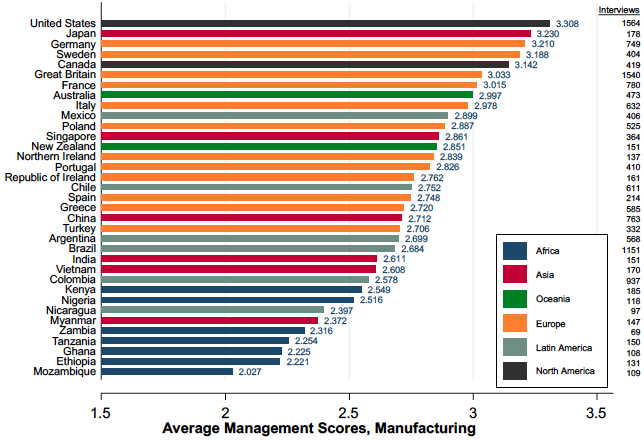
What’s the Connection Between Management Practices and the Wealth of Nations?

The graph above comes from a recent post by MIT economist John Van Reenen, who has been doing research on the economics of management for the last 15+ years.[ref]Reenen’s work was the foundation of my GBR article.[/ref] He explains,

Many case studies illustrate the importance of management. For example, one I was involved with was Gokaldas Exports (Bloom et al. 2013), a family-owned business founded in 1979 that had grown into India’s largest apparel exporter by 2004. It had 35,000 workers, was valued at approximately $215 million, and exported nearly 90% of its production. Its founder, Jhamandas H Hinduja, had bequeathed control of the company to three sons, each of whom brought in his own son. Nike, a major customer, wanted Gokaldas to introduce lean management practices and put the company in touch with consultants who could help to make this happen. But the CEO was resistant. It took rising competition from Bangladesh, multiple demonstration projects, and finally the intervention of other family members (one of whom I taught in business school) to overcome this resistance. The new practices led to greatly enhanced performance.

Reenen’s work on the World Management Survey has shown that “large, persistent gaps in basic managerial practices…are associated with large, persistent differences in firm performance. Better-managed firms are more productive, grow at a faster pace, and are less likely to die…We performed a simple accounting exercise to evaluate the importance of management for the cross-country differences in productivity. We found that management accounted for about 30% of the unexplained TFP differentials driving the large differences in the wealth of nations.” He concludes,

As our Gokaldas case study mentioned above illustrated, many firms in developing countries may not even realise how weak their management practices are. Or, even when they do they realise this, they may not know how to improve things. Tools such as benchmarking and training can help spread information and knowledge in both of these dimensions. Governments and NGOs often do this, but such programmes are rarely evaluated in a rigorous way (for a survey, see McKenzie and Woodruff 2017). Doing so may be able to raise management and ultimately the wealth of emerging nations.

Once again, management matters.

Are STEM Fields Discriminatory Toward Women?

Image result for negative ghost rider

At least according to a 2015 study:

Our experimental findings do not support omnipresent societal messages regarding the current inhospitability of the STEM professoriate for women at the point of applying for assistant professorships (4122629). Efforts to combat formerly widespread sexism in hiring appear to have succeeded. After decades of overt and covert discrimination against women in academic hiring, our results indicate a surprisingly welcoming atmosphere today for female job candidates in STEM disciplines, by faculty of both genders, across natural and social sciences in both math-intensive and non–math-intensive fields, and across fields already well-represented by women (psychology, biology) and those still poorly represented (economics, engineering). Women struggling with the quandary of how to remain in the academy but still have extended leave time with new children, and debating having children in graduate school versus waiting until tenure, may be heartened to learn that female candidates depicted as taking 1-y parental leaves in our study were ranked higher by predominantly male voting faculties than identically qualified mothers who did not take leaves.

Our data suggest it is an auspicious time to be a talented woman launching a STEM tenure-track academic career, contrary to findings from earlier investigations alleging bias (313), none of which examined faculty hiring bias against female applicants in the disciplines in which women are underrepresented. Our research suggests that the mechanism resulting in women’s underrepresentation today may lie more on the supply side, in women’s decisions not to apply, than on the demand side, in antifemale bias in hiring. The perception that STEM fields continue to be inhospitable male bastions can become self-reinforcing by discouraging female applicants (2629), thus contributing to continued underrepresentation, which in turn may obscure underlying attitudinal changes. Of course, faculty members may be eager to hire women, but they and their institutions may be inhospitable to women once hired. However, elsewhere we have found that female STEM professors’ level of job satisfaction is comparable to males’, with 87%-plus of both genders rating themselves “somewhat to very” satisfied in 2010 (figure 19 in ref. 14). Also, it is worth noting that female advantages come at a cost to men, who may be disadvantaged when competing against equally qualified women. Our society has emphasized increasing women’s representation in science, and many faculty members have internalized this goal. The moral implications of women’s hiring advantages are outside the scope of this article, but clearly deserve consideration.

Real-world data ratify our conclusion about female hiring advantage. Research on actual hiring shows female Ph.D.s are disproportionately less likely to apply for tenure-track positions, but if they do apply, they are more likely to be hired (163034), sometimes by a 2:1 ratio (31). These findings of female hiring advantage were especially salient in a National Research Council report on actual hiring in six fields, five of which are mathematically intensive, at 89 doctoral-granting universities (encompassing more than 1,800 faculty hires): “once tenure-track females apply to a position, departments are on average inviting more females to interview than would be expected if gender were not a factor” (ref. 16, p. 49). [See SI Appendix for descriptions of other audits of actual hiring that accord with this view, some dating back to the 1980s. Many studies have argued (see ref. 14) that because only the very top women persist in math-intensive fields, their advantage in being hired is justified because they are more competent than the average male applicant. This is why an accurate evaluation of gender preference in hiring depends on data from an experiment in which competence is held constant.] Thus, real-world hiring data showing a preference for women, inherently confounded and open to multiple interpretations because of lack of controls on applicant quality, experience, and lifestyle, are consistent with our experimental findings.

Does Collective Bargaining Lead to More Police Misconduct?

Image result for footloose police

That seems to be the case, according to a new study. The researchers explain,

There has been significant scholarly attention recently to the issue of excessive law enforcement violence (Fryer 2016; Legewie and Fagan 2016; Shjarback 2015; Shane, Lawton, and Swenson 2017; Stickle 2016), some of which has trained on the role of collective bargaining (Huq and McAdams 2016; Rushin 2017). No previous work, however, has offered empirical evidence of the causal role that unionization or collective bargaining play in the performance of law enforcement. We offer such evidence by exploiting a January 2003 change in Florida labor law. By a judicial decision that month (Williams), county sheriffs’ deputies won for the first time the right to organize for collective bargaining. Before and after that date, municipal police officers had the right to engage in collective bargaining. We examine how Williams affected complaints of misconduct against law enforcement personnel at these two types of agencies.

Our analysis uses a dataset on Florida law enforcement agencies – covering both county sheriffs’ offices (SOs) and city police departments (PDs) – that begins in 1997 (our primary tests use data for 1997-2010). This dataset combines annual Criminal Justice Agency Profile (CJAP) surveys conducted by the Florida Department of Law Enforcement (FDLE) with administrative data from the FDLE on law enforcement officers and on complaints and disciplinary actions against officers. We analyze in particular the number of complaints at the agency-year level against officers affiliated with each agency. Our empirical strategy involves the use of a difference-indifference framework, in which the treatment group consists of SOs (that were affected by Williams) and the control group consists of PDs (that were unaffected). Officers assigned to agencies in the treatment and control groups perform similar job functions (Pynes and Corley 2006, p. 299). Likewise, similar pools of applicants seek employment with SOs and PDs, and there is lateral movement by officers between the agency types (Baker 2017a).

We begin by showing that Williams led to substantial unionization among SOs. This occurred over a three-year period following the decision, and then stabilized; thus, our primary specifications use a three-year lag of the variable of interest (an interaction between the post-2003 years and an indicator for SOs). Our baseline analysis uses a Poisson maximum-likelihood model in order to accommodate count data on complaints. We control for agency and year fixed effects and for an extensive set of controls (including demographic variables, local economic conditions, and local crime rates). The central result is that collective bargaining rights led to about a 27% increase in complaints of officer misconduct for a typical SO. We also find some evidence that, for agency-years with positive numbers of complaints, the number of state disciplinary actions against officers also increased. We argue in Section 5 below that this suggests that the increased complaints against SOs were not accompanied by a decrease in the seriousness of these complaints.

When adding an extensive set of leads and lags to the basic model, we find that the difference-in-difference estimate is small and statistically insignificant for “false experiments” (or placebo tests) in years prior to 2003, suggesting that the results are not attributable to a preexisting trend toward more complaints against SOs. In a linear framework, the result is robust to adding linear agency-specific time trends and county-by-year fixed effects. Taken together, the results on prior years and on agency-specific time trends suggest that the parallel trend assumption that is crucial in the difference-in-difference framework is satisfied here. This supports a causal interpretation of our findings on the impact of collective bargaining rights, despite numerous factors we describe below that create a bias against our results (pgs. 2-3).

I’m thinking that collective bargaining’s track record isn’t the hottest.

The Long-Term Benefits of Marriage: UK Edition

According to a post at the Institute for Family Studies,

One of the most common critiques of the supposed advantages of marriage is that married adults and their children only do better because of their education and money. The argument goes something like this: “It’s not marriage that conveys the advantages of life. It’s just that those who are better educated are more likely to get married. They then go on to make a success of their family and avoid many of the pitfalls. It’s a ‘mistake’ to attribute this to marriage, when really it’s all about education and money.”

But the actual data say quite the opposite:

Compare rich families or poor families and the outcome tends to be the same. Married families still tend—on average, remember—to do better. We’ve shown this to be the case in a whole range of studies…Anyway, one of my research colleagues—Professor Spencer James at Brigham Young University—and I decided we wanted to look at whether having married parents, rather than unmarried parents, has any long-term effect on life as an adult. We’ve already established that married couples are more likely to stay together. We’ve already established that the children of married adults are more likely to avoid things like mental health problems. In both cases, this is true regardless of parent’s age, education, and ethnicity. 

But how long do these effects last?

To find out, we took a look at two British cohort studies that have followed the lives of 20,000 babies born in 1958 and 1970 who are all now adults in their late 40s and 50s. The timings are different for each cohort, but essentially these adults were asked all sorts of questions every five to 10 years.

This allowed us to compare those born to married and unmarried parents and also look at the social class of the parents when they were aged 16. We then looked at the children who later on got married, those who went to university, and those who needed to make use of benefits at any stage during adulthood to date.

Just to make sure we were looking at any effect of marriage, we also controlled for the child’s sex, mother’s age at birth, and mother’s interest in their child’s education at age 16, and any differences in outcomes between the two surveys.

The results of our study, which is now downloadable from the Marriage Foundation website, were extraordinary. Regardless of family and social background, those born to married parents were:

  • 23% more likely to have been to university

  • 10% more likely to have got married, and

  • 16% less likely ever to have received government benefits

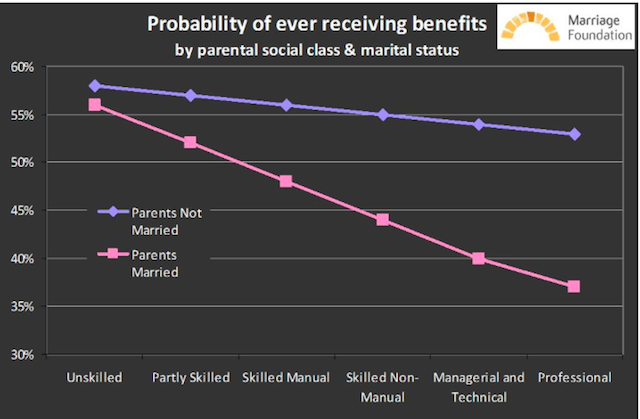
One particularly interesting finding: “Having richer parents made no difference in the probability of ever needing to go on welfare if those parents weren’t initially married. In other words, kids brought up in better-off homes are more likely to go to university and more likely to get married. But if the parents weren’t married, rich kids are just as likely to end up on government benefits as poor kids. There is no effect of money.” The authors suggest,

Even in families where one or both parents are university educated or white-collar workers, children will have seen the difficulty of managing the dissolution of family life. Even among well-educated parents, that might have included a stint on welfare benefits. Having seen that happen to their parents may then reduce the resistance to relying on the government. It may also be that a more relaxed attitude among some lone parents leads to a more relaxed attitude to going on benefits.

Regardless of the explanation, our findings are robust and striking and show at least one major area of life where having married parents has a big impact on the future lives of children, yet money appears to play no role whatsoever.


Formula(s) for Success

How does one become an elite performer or successful at work? According to the Greater Good Science Center,

Angela Duckworth, the celebrated psychologist who first defined “grit” as perseverance and passion for long-term goals, has a theory about success. Instead of seeing achievement as simply a byproduct of IQ or intelligence or innate talent, Duckworth sees achievement as the product of skill and effort (Achievement = Skill x Effort) in the same way that we understand that Distance = Speed x Time.

…Tremendous effort can compensate for modest skill, just as tremendous skill can compensate for modest effort, but not if either is zero.  Researchers across diverse fields have produced remarkably consistent findings that back up Duckworth’s theory. They find that innate ability has relatively little to do with why people go from being merely good at something to being truly great.

This is hard for most of us to believe, but K. Anders Ericsson, a psychologist and author of several landmark studies on this topic, has shown that even most physical advantages (like athletes who have larger hearts or more fast-twitch muscle fibers or more flexible joints—the things that seem the most undeniably genetic) are, in fact, the result of certain types of effort…Even super-skills, like “perfect pitch” in eminent musicians, have been shown to stem from training more than inborn talent. Hard to believe, but entirely true.

…People who rise to greatness tend to have three things in common: 1) They both practice and rest deliberately over time; 2) Their practice is fueled by passion and intrinsic interest; and 3) They wrestle adversity into success.

Elite performers “spend hours upon hours in “deliberate practice.” This isn’t just poking around on the piano because it is fun; it is consistently practicing to reach specific objectives—say, to be able to play a new piece that is just beyond their reach. In the beginning, they may practice a new phrase or even a single measure again and again and again. Unfortunately, deliberate practice isn’t always pleasurable—far from it. In fact, it is the elite performer’s willingness to engage in hard or, quite often, very boring, practice that distinguishes people who are good at their chosen activity from those who are the very best at it.” They “also practice consistently over a pretty long period of time.”

Image result for violin gif your lie in aprilProper rest is also extremely important. “In his studies of truly great performers, K. Anders Ericsson, the psychologist and author of several landmark studies on elite performance…found that they practiced and rested a lot more than their good but not elite peers. For example, violinists destined to become professional soloists practiced an average of 3.5 hours per day, typically in three separate sessions of 60-90 minutes each. Good but not great performers, in contrast, typically practiced an average of 1.4 hours per day, with no deliberate rest breaking up their practice session…The top violins [also] slept an hour a night more than their less-accomplished classmates. They were also far more likely to take a nap between practice sessions—nearly three hours of napping a week.” It turns out that top achievers “sleep significantly more than the average American. On average, Americans get only 6.5 hours of sleep per night. (Even though studies show that 95 percent of the population needs between seven and eight hours of sleep a night.) Elite performers tend to get 8.6 hours of sleep a night; elite athletes need even more sleep. One study showed that when Stanford swimmers increased their sleep time to 10 hours a night, they felt happier, more energetic—and their performance in the pool improved dramatically.”

Failure is also a part of success. “Elite performers turn adversity into success. Most greats don’t just pile up one achievement after the next. Failure is a key part of growth and, eventually, elite performance”:

Failure—and adversity in general—is life’s great teacher. While there might not be anything good in misfortune, as Viktor Frankl wisely reminds us, it is often possible to wrench something good out of misfortune. We know that adverse life-events—a plane crash, a terrorist bombing, breast cancer—can trigger depression, anxiety, and posttraumatic stress syndrome. But what most of us don’t realize is that posttraumatic growth, as researchers call it, can also awaken us to new strength and wisdom. Misfortune—even tragedy—has the potential to give our lives new meaning and a new sense of purpose, and in this way, adversity also contributes to the passion part of the grit equation.

Finally, a five-year study of nearly 5,000 managers and employees in the U.S. finds five major strategies for work success and well-being:

  • intensely focusing on few tasks.”
  • “prioritize work that [you] can do well, efficiently, and with great benefit to others.”
  • “engage in collaboration only when it ma[kes] good business sense and when working together [i]s a benefit rather than a hassle.”
  • “success requires the support of others, and the best way to garner that support is to speak to people’s values, interests, and motivations.”
  • combine passion “with a sense of purpose.”

Try testing out these formulas in your own life.

Will Inexpensive Health Insurance Lead to Full Coverage?

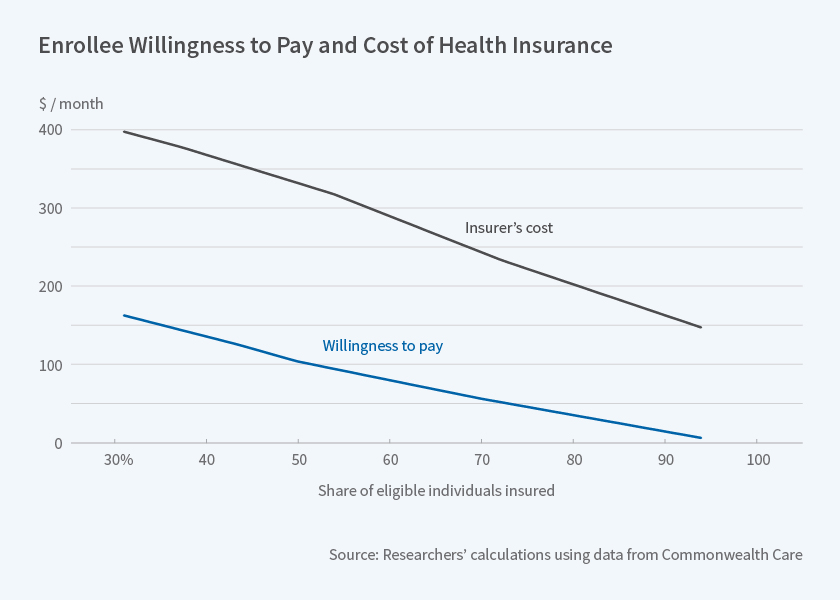
According to data from Massachusetts’ Commonwealth Care program, “even if 90 percent of health insurance costs were subsidized, 25 percent of those eligible for subsidies would choose to remain uninsured.” The program

offers large subsidies for private health insurance for individuals below 300 percent of the federal poverty level who are not covered by an employer plan or another public program, such as Medicare. The researchers analyze data from fiscal year 2011. Insurance payments were covered by a combination of Commonwealth Care subsidies and premiums paid by the eligible individuals. Enrollee premiums, intended to be affordable for low-income people, varied with income levels. Specifically, rate changes occurred at 150 percent, 200 percent, and 250 percent of the poverty line. The premium for the cheapest plan was $39 a month for enrollees with incomes between 150 and 200 percent of the poverty line, $77 a month for those from 200 to 250 percent, and $116 a month for those above 250 percent. All of these enrollee premiums were heavily subsidized relative to insurers’ costs, which averaged $359 per month. Individuals could choose to forgo coverage and pay a penalty equal to half the cost of the lowest premium.

The variation in the post-subsidy cost of insurance for low-income participants allows the researchers to estimate enrollees’ willingness to pay for health insurance. It also enables them to study how the set of enrollees who take up insurance affects provider costs. The researchers find that for each $40 increase in monthly premiums for the cheapest plan, enrollment in Commonwealth Care declined by about 25 percent, despite the penalty for opting out of coverage. When Commonwealth Care was free — as it was for those below 150 percent of the poverty line — 94 percent of eligible adults enrolled, but participation decreased to 70 percent when the premium rose to $39 per month, and to below 50 percent when premiums were $116 per month.

As individuals dropped out of coverage when their premiums became more expensive, average insurer costs per participant rose. At the 150 percent threshold, insurer costs increased by $47 per enrollee, or 14 percent. This indicates that the individuals who dropped coverage as the price increased were, on average, less expensive individuals to insure. In other words, the insured pool was adversely selected in terms of health risk.

The researchers estimate that individuals are willing to pay less than one-third of average insurer costs to obtain coverage. The median willingness to pay for insurance is $100 a month, roughly one-fourth of the cost of insuring individuals with above-median willingness to pay. Thus if a subsidy covers 75 percent of the cost of coverage, only half of eligible participants would choose to buy insurance. Even if the subsidy were 90 percent, 25 percent of those eligible would choose to remain uninsured.

Read the full working paper here.