There is surprisingly little direct quantitative evidence on how the U.S. economy would react if the door were shut on trade. To find a precedent, the researchers point out that one could go back to the Embargo Act of 1807, when the United States banned trade with Great Britain and France in retaliation for their repeated violations of U.S. neutrality. GDP declined sharply, but the agrarian world during the presidency of Thomas Jefferson bears little resemblance to today’s high-tech, service-oriented economy.
…To simplify the analysis, they elect to focus on trade in factor services, namely the labor and capital embedded in goods purchased from around the world. They then estimate the gains from trade by comparing the size of a counterfactual U.S. economy that depends entirely on domestic resources with one that has access to foreign factor services through international trade.
…The researchers do not offer a single estimate of the gains to the U.S. economy from international trade, but they suggest that the reasonable range falls between 2 and 8 percent of GDP. They acknowledge that while foreign trade raises the level of economic output, not everyone is a winner. Consumers enjoy lower prices, but some workers may see that benefit offset by declining wages or layoffs.
There is some debate among economists and political scientists over the precise way to calculate the probability that a vote will be decisive. Nevertheless, they generally agree that the probability that the modal individual voter in a typical election will break a tie is small, so small that the expected benefit (i.e., p[V(D)−V(R)]p[V(D)−V(R)]) of the modal vote for a good candidate is worth far less than a millionth of a penny (G. Brennan and Lomasky 1993: 56–7, 119). The most optimistic estimate in the literature claims that in a presidential election, an American voter could have as high as a 1 in 10 million chance of breaking a tie, but only if that voter lives in one of three or four “swing states,” and only if she votes for a major-party candidate (Edlin, Gelman, and Kaplan 2007).[ref]On average, a voter has a 1-in-60 million chance of changing the outcome of a presidential election.[/ref] Thus, on both of these popular models, for most voters in most elections, voting for the purpose of trying to change the outcome is irrational. The expected costs exceed the expected benefits by many orders of magnitude.
Consider the following costs:
[S]uppose my favored candidate (who is worth $33 billion more to the common good) enjoys a slight lead in the polls. She has a very small anticipated proportional majority. The probability that any random voter will vote for her is 50.5 percent. This is an election we would describe as “too close to call.” Suppose also that the number of voters will be the same as in the 2004 U.S. presidential election: 122,293,332. I vote for my favored candidate. In this case, the expected value (for the common good) of my vote for the better candidate is $4.77 x 10^-2650 , that is, approximately zero. Even if the candidate were worth $33 billion to me personally, the expected value for me of my vote would be, again, a mere $4.77 x 10^-2650 . That is 2,648 orders of magnitude less than a penny. In comparison, the nucleus of an atom, in meters, is about 15 orders of magnitude shorter than I am. In meters, I am about 26 orders of magnitude shorter than the diameter of the visible universe. In pounds, I am about 28 orders of magnitude less heavy than the sun. Even if the value of my favored candidate to me were dramatically higher, say ten thousand million trillion dollars, the expected value of my vote in our example—for a close election—remains thousands of orders of magnitude below a penny. For an election in which the candidate has a sizable lead, the expected utility of an individual vote for a good candidate drops to almost zero.
The Beneficence Argument appeals to the public utility of individual acts of voting. However, suppose all you care about is maximizing your contribution to the common good. If so, voting would not merely fail to be worthwhile— it would be counterproductive. It turns out that the expected disutility of driving to the polling station (in terms of the harm a driver might cause to others) is higher than the expected utility of a good vote. This is not hyperbole.
Aaron Edlin and Pinar Karaca-Mandic have estimated the expected accident externalities per driver per year in the United States—that is, the amount of damage the average driver imposes on others from accidents and reckless driving. The expected accident externalities range from as little as $10 in low-traffic-density North Dakota to more than $1,725 in high-traffic-density California. Suppose a North Dakotan takes five minutes to drive to the polling station. The average expected accident externality of a five-minute drive in North Dakota is $9.5 x 10^-5 , much larger than the expected benefit of a good vote in the previous example. So the voter imposes greater expected harm on her way to the polls than she could compensate for by a good vote.[ref]Jason Brennan, The Ethics of Voting, pgs. 19-20.[/ref]
Economist Jonathan Portes has an excellent summary of the research on immigration’s effects in the UK:
Employment: “To the considerable surprise of many economists, including me, there is now a clear consensus that even in the short-term migration does not appear to have had a negative impact on the employment outcomes of UK natives. Studies have generally failed to find any significant association between migration flows and changes in employment or unemployment for natives (see, for example, BIS 2014 for a review). Since 2014, the continued buoyant performance of the UK labour market has further reinforced this consensus. Rapid falls in unemployment, now down to just over 4%, have been combined with sustained high levels of immigration. Nor is there any evidence that immigration has impacted the employment prospects of specific groups such as the young or unskilled. Crudely, immigrants are not taking our jobs – the lump of labour fallacy, that the number of jobs or vacancies in the economy is fixed (which generally refers to the medium to long term) turns out to be a fallacy in the short term as well.”
Wages: “While the evidence on wage impacts is less conclusive, the emerging consensus is that recent migration has had little or no impact overall, but possibly some, small, negative impact on low-skilled workers. Dustmann et al. (2013), using UK LFS data for the period 1997-2005, find that immigration put a downward pressure on the wages at the bottom of the distribution (below the 20th percentile), while the effect on the rest of the distribution (in particular above 40th percentile) is positive. Their estimates show that a 1% increase in the foreign-born/native population ratio leads to an increase of between 0.1% and 0.3% in average wages.”
Productivity: “Immigrants’ skills may complement those of natives. A number of papers support this hypothesis: for example, Barone and Moretti (2011) found that low-skilled migration increased the labour force participation of highly skilled native women; Peri and Sparber (2009) and Foged and Peri (2016) found that low-skilled migration increased the wages of native low skilled workers. In particular, they argue that natives may have a comparative advantage in jobs with more communication-intensive tasks with respect to foreign workers, and that immigration ‘pushes’ low-skilled natives to occupations with a higher intensity of such skills, increasing the level of specialisation in the economy and hence productivity, as signalled by the corresponding increase in wages. Immigration might also influence the level of human capital in the economy, either directly if immigrants have high educational attainment (Kerr and Lincoln 2010, Hunt and Gauthier-Loiselle 2010), or indirectly by increasing the incentive on natives to acquire human capital. Some evidence (Hunt 2017, McHenry 2015) suggests that increased low-skilled immigration increase school performance and outcomes for US natives…Looking at the service sector, Ottaviano et al. (2015) show that a 1% increase in immigrants’ concentration in local labour markets is associated with a 2% to 3% rise in labour productivity, measured as gross value added per worker, mainly as a result of the cost-cutting dynamics implied by immigration-induced labour supply shocks. In addition, immigration represents a substitute for the import of intermediate inputs and is associated with an increase in exports to immigrants’ countries of origin. Rolfe et al. (2013) found that immigrants concentration within specific industries was associated with slight increases in productivity, but the impact was small. At the aggregate level, recent literature uses cross-country evidence to estimate the impact of migration on growth and productivity in advanced economies. Boubtane et al. (2015) find that migration in general boosts productivity in advanced economies, but by varying amounts; for the UK, the estimated impact is that a 1 percentage point in the migrant share of the working age population leads to a 0.4-0.5% increase in productivity. This is higher than in most other advanced economies and reflects the relatively high skill levels of migrants to the UK. Jaumotte et al. (2016) find that a 1% increase in the migrant share of the adult population results in an increase in GDP per capita and productivity of approximately 2%. This result is consistent across a variety of empirical specifications. Perhaps surprisingly, the estimated aggregate impacts of high and low skilled migration are not significantly different (although the distributional implications are very different). In a within-country perspective, Peri (2012), with a state-based analysis in US, finds that a 1% increase in immigration raises total factor productivity by 0.5%, mainly thanks to increased specialisation induced by immigrants’ inflows.”
Fiscal: “Dustmann and Frattini (2014) found that recent migrants, especially those from the EU, had a more positive fiscal impact on average than natives. Of course, it is hardly surprising that young migrants in employment make an initial positive fiscal contribution; proper assessment of fiscal impacts requires a life-cycle perspective (Preston 2014). In this context, there are various reasons to expect the impact to still be positive (in particular, migrants tend to arrive after they have left compulsory, publicly financed education). However, a positive net impact on public finances at the national level does not preclude a significant impact on demand (and hence cost) at the local level, particularly if funding allocations do not adjust quickly (or at all) to reflect pressures resulting from migration (George et al. 2011). A notable recent example is the shortage of primary school places in some parts of the UK (especially London); this appears to be largely the result of poor planning on the part of central government, given the rise in the number of young children resulting from recent increases in migration (from both the EU and elsewhere). But broader concerns about the potential negative impacts on public services appear to be largely unsubstantiated: higher immigration are not associated, at a local level, with longer NHS waiting times (Giuntella et al. 2015); and in schools, increased numbers of pupils with English as a second language doesn’t have any negative impact on levels of achievement for native English speaking students (Geay et al. 2013). If anything, pupils in schools with lots of non-native speakers do slightly better.”
Prices: “Frattini (2008) analyses the impact on tradable, non-tradable goods and services prices across UK regions over the period 1995-2006 and shows that immigration is associated with a fall in prices for non-tradeable goods and services, but a rise in the price of tradeables. Sá (2015) focuses on the impact on housing prices in UK local authorities from 2003 to 2010 and shows that immigration actually reduces house prices at a local level, since natives leave the area in response to high immigrant inflows; although this does not imply, of course, that immigration does not overall exert upward pressure on house prices at a national level.”
So what are the likely results of Brexit? He concludes,
The conclusion is that the reductions in migration resulting from Brexit are likely to have a significant adverse impact on UK productivity and GDP per capita. The broad scenarios (not forecasts) we depict imply that the negative impacts on per capita GDP will be significant, potentially approaching those resulting from reduced trade. By contrast, the increase in low-skilled wages resulting from reduced migration is expected to be, if at all, relatively modest.
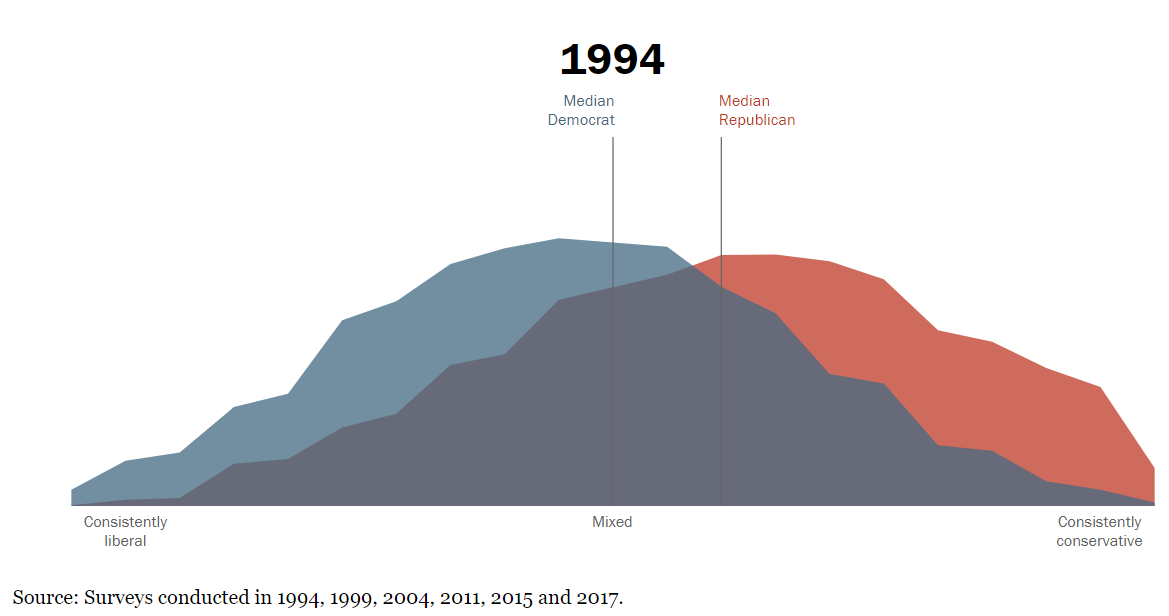
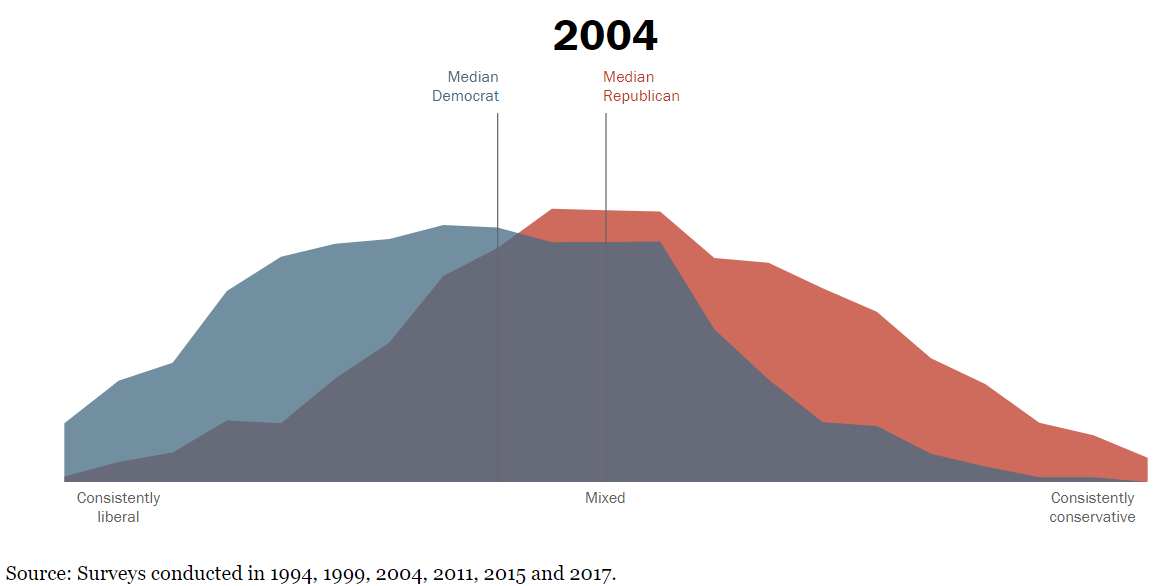
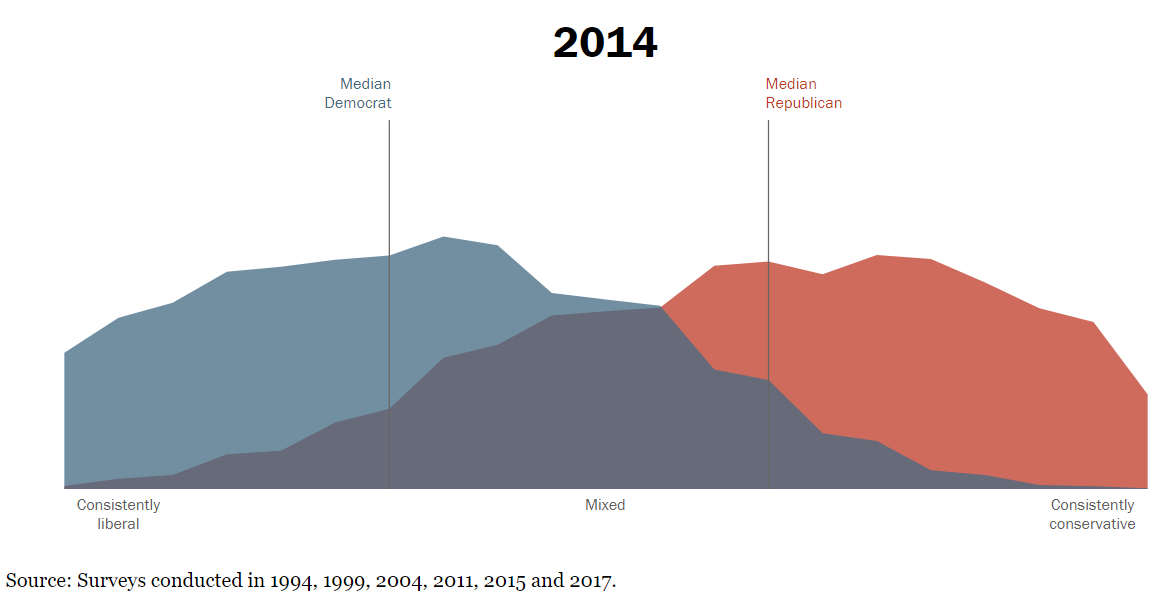
According to Pew Research Center’s surveys, here is how the general public divided along partisan lines in 1994, 2004, 2014, and 2017.
The FB page Unbiased America has a post animating the changes with this summary image:
And with the following description (in part):
A common criticism from both parties has been that the other has become radicalized. Listen to just about any campaign speech and you’ll hear the time-tested demagoguery about how the opposition party is no longer moderate, but instead espouses views from the extreme. So I decided to see whether that’s actually the case.
The Pew Research Center does a poll asking Americans about their beliefs on a variety of issues. When plotted on a graph and then animated to show how ideologies have shifted over time, an eye-opening picture emerges. Since 1994, Republicans are only about 8% more conservative in their beliefs. Democrats, meanwhile, are fully 60% more liberal, with the median Democrat now closer to the far left than the center.
It wasn’t always this way. In 1994, the median Democrat was a centrist, holding views that were 50% traditionally liberal, and 50% traditionally conservative. The median Republican was only about 10% more conservative than the median Democrat.
Since that time, Republicans shifted left, and were the centrist party in 2004, before drifting back to the right. Today they are just slightly more conservative than in 1994.
Democrats, meanwhile, continue to move left, with the biggest surge coming between 2011 and 2017.
It’s interesting to see how everyone seemed to move left from 1994-2004, followed by the Democrats running in that direction and the Republicans walking it back. I wonder if the party with the President in office tends to shift less while the opposition party tends to react. It would be nice to have more timepoints to see (1996, 2000, 2008, 2012). Even if that were the case, though, it doesn’t look like the shifts cancel each other out as the Oval Office goes from one party to another; instead it looks as if the public is getting more polarized over time.
And as a quick aside, I’m not clear on why the Source info includes a survey from 2015 but the data is labeled 2014 instead.
A few years ago, I had a post about the Simon-Ehrlich wager in which economist Julian Simon won his bet against professional fearmonger Paul Ehrlich (who still won’t shut up). The evidence continues to mount that Simon was correct. Recently GMU economist Bryan Caplan reported on his own Simonian bet with Tyler Cowen and David Balan. “In July of 2008,” he writes, “the average U.S. price of regular gasoline was $4.062.” He bet “$100, even odds, that the U.S. price of gas (including taxes) in the first week of January, 2018 will be $3.00 or less in 2008 dollars.”
A subsequent clarification specified that the bet was on the price of regular gasoline.
Today, the January CPI arrived, allowing us to finally resolve this ten-year bet. In 2008, the US CPI stood at 215.3. In the third quarter of 2017, it hit 244.7. Since then, there has been further inflation of 0.3%, bringing us to 245.3, for a grand total of 13.9% inflation during this period. For me to win, then, the average price of regular gasoline in January 2017 must be less than $3.417.
So where are we now? In January of 2018, the average price was a mere $2.555. I have therefore won this bet by a margin of over 25%. (Indeed, even if we count all gasoline, the average price is only $2.671). I would have prevailed if there’d been 0% inflation – or as much as 14% cumulative deflation.
…For as long as we’ve had data, gas prices have shown frequent spikes, followed by gradual declines back to long-run trend. So when prices spiked to over $4.00, I expected the past to repeat itself. And repeat itself it did.
I expect that Tyler will insist that I just got lucky. And if I lost roughly half my bets, that would be a wise reaction. However, this latest victory brings my betting record to 17 wins and 0 losses. Yes, pride goeth before the fall. There’s at least one outstanding bet that I now expect to lose. Still, the only reasonable explanation for my 17-and-0 record is that my judgment is exceptionally good.
…As always, my opponents have my respect – and deserve yours. They stuck out their necks and made clear claims. If every pundit would do the same, this would be a far better – and far quieter – world.
You might think that politics is an area where being analytical is especially useful. If you do, well, I have news for you: Libertarians measure as being the most analytical political group. That’s according to something called the cognitive reflection test, which is designed to measure whether an individual will override his or her immediate emotional responses and give a question further consideration. So if you aren’t a libertarian, maybe you ought to give that philosophy another look. It’s a relatively exclusive club, replete with people who are politically engaged, able to handle abstract arguments and capable of deeper reflection.
What else can we learn from this new study of political and analytical tendencies, conducted by Gordon Pennycook and David G. Rand of Yale University?
For the 2016 election, one group that measured as especially nonanalytical was Democrats who crossed party lines and voted for Donald Trump. There is a stereotype of a less well-educated voter, perhaps both white and male, who reacts negatively and emotionally to Hillary Clinton, who decided to vote for Trump even if Trump’s actual policies will not prove in his best interest. For all the dangers of stereotyping, the study’s data are consistent with that picture.
Both nonvoters and independents do poorly on the analytic dimension. There is a myth of a reasonable, rational politically independent America, sitting in the middle of the spectrum, weighing arguments carefully and seeing which candidate or party has the better ideas and platform. In reality, that group measures as relatively impulsive and prone to less informed judgments.
If you are a Democrat, you might take some cheer in the fact that Democrats/liberals measure as somewhat more analytical than Republicans/conservatives. But if you take being analytic as a positive mark, you might feel at least a slight tug toward the libertarians. At the very least, you might find it harder to attack or make fun of the Republicans for being intellectually backward, because you as a Democratic liberal no longer sit atop of the totem pole of reason. Note that individuals who are conservative along economic dimensions measure as more analytical than those who are not, again on average. That is a slightly uncomfortable result for those on the left. The opposite is true for social conservatives, by the way: They are less analytical on average.
Cowen is quick to point out that there are analytical people in all camps. He also notes that being analytical can put “you out of touch with the American citizenry…Extremely analytical leaders might be best for managing an organization of predominantly analytical people, but that doesn’t mean they will be good national politicians.”
This is my first post in the GCO in a long, long time and it feels great to be writing again. I really hope to stick with it this time. I plan on working my way through the entire backlog of posts I’ve missed (I don’t even know how many there are at this point. 10? 20? 30?) But my first priority will be keeping apace with the current ones. I’ll fill the backlog in as I can.
I have so many thoughts about the April 2018 GC that just concluded. First and foremost: a temple in Richmond, VA? I thought that the day would never come. With the huge DC temple so close by (relatively speaking) I didn’t even dare to hope. We had lots of friends over at our house watching the session, and we all went nuts when they made the announcement!
Friends and family react to the announcement of the Richmond, VA temple.
In his talk, Elder Taylor talked about the experience of a friend of his who—when she was a teenager—caused a car accident that took the life of the other driver. “Someone lost their mom,” he quotes her as saying, “and it was my fault.” It was a strong talk about the power of learning to hold onto our identity as children of God even when we feel terrible about our own mistakes, but part of me couldn’t help thinking: Yeah, it was tough for her. What about the children of the mom that died?
That was still in the back of my mind when I heard Elder Echo Hawk begin a story in his talk:
On a December night in 1982, my wife Terry and I were awakened by a phone call to our home… As I answered the phone, I heard only sobbing. Finally, my sister’s struggling voice said, “Tommy is dead.”
Elder Echo Hawk went on to describe how his family, with the help of Christ, was able to open their hearts to the family of the drunk driver who killed his brother.
These talks were not about the exact same accident, but I was incredibly struck by the fact that here we had two talks—back to back—about fatal car accidents. One from the perspective of a person who had caused a fatal car accident and survived, and one from the perspective of the family of a man killed by a car accident caused by someone else.
This is what forgiveness looks like: it has two sides.
One of the hardest things to learn about Christianity is that ultimately there are no bad guys. We’re not really wired for that, and it’s a radical and explosive perspective to take. But—in the end—it is the perspective of a God who loves all of His children.
It doesn’t mean that all of our mistakes cancel out. That would be trivializing. The perspective is hard precisely because they don’t. Because mistakes so often have the sinner on one hand and the sinned on the other, and that creates a divide that can seem unbridgeable.
We are not taught to pretend the sin didn’t happen. Nor—it should go without saying—are we taught to subject ourselves to ongoing abuse. But we are taught to forgive the one who has wronged us and, when we are truly penitent and have done all we can, we are taught to forgive ourselves.
Both aspects are hard. Both aspects are necessary. And ultimately, none of us are strong enough to bridge that chasm alone. It is Christ—His example and the power of His atonement—that allow us to cross the divide between the wrong-doer and the wrong-sufferer.
There is surprisingly little direct quantitative evidence on how the U.S. economy would react if the door were shut on trade. To find a precedent, the researchers point out that one could go back to the Embargo Act of 1807, when the United States banned trade with Great Britain and France in retaliation for their repeated violations of U.S. neutrality. GDP declined sharply, but the agrarian world during the presidency of Thomas Jefferson bears little resemblance to today’s high-tech, service-oriented economy.


 You might think that politics is an area where being analytical is especially useful. If you do, well, I have news for you: Libertarians measure as being the most analytical political group. That’s according to something called the