Does Economic Marginalization Breed Radicals?

Image result for islamic radical

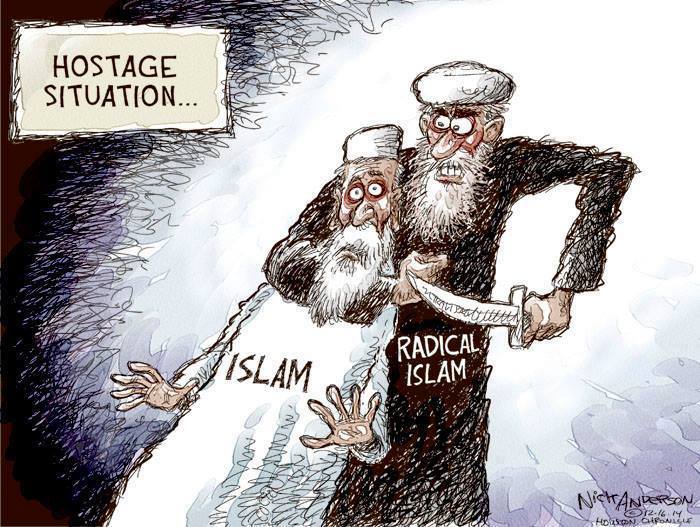
A few years ago, I linked to a Wall Street Journal op-ed by economist Hernando de Soto that declared “economic hope” to be “the only way to win the battle for the constituencies on which terrorist groups feed.” A couple years later, I discussed the possibility that strict labor laws–and the unemployment it produces–was a major contributor to radicalization in Europe. In short, the lack of economic opportunity breeds extremism.

Recent evidence appears to support this hunch.

Many point to U.S. drone strikes as a causal factor in Islamic radicalization. However, a brand new study argues the contrary, concluding,

Although U.S. drone strikes in Muslim countries might play a role in the radicalization or violent extremism of co-religionists around the world, the available evidence does not support the assertion that drones are “fueling the fires of homegrown radicalization” in Western societies or that these unmanned aerial vehicles are the new Guantánamo.

…The radicalization of individuals in the Somali diaspora, especially in the state of Minnesota, illustrates the role of U.S. policies targeting Muslim communities at home; personal factors, such as conflicted identities among young Somali Americans; and their nationalist desire to evict foreign troops from Somalia, a desire that recruiters from the al-Qaida affiliate al-Shabaab have been able to exploit. My brief examination of the social science literature on the drivers of Islamist militancy among Muslims in European countries similarly points to domestic factors such as an identity crisis among some young Muslims, state policies of marginalization and discrimination, and the role of radical preachers and terrorist recruiters who leverage these vulnerabilities for recruitment (pg. 83-84; emphasis mine).

This is further confirmed by a recent World Bank paper:

Exploiting individual-level education information for these fighters, we link the size of a contingent of fighters to the economic conditions faced by workers in their countries of residence who have the same level of education, by distinguishing primary, secondary and tertiary education. Beginning non-parametrically, we document a correlation between the within-country relative unemployment rate faced by workers from a specific country and education level and the corresponding relative number of recruits. We then conduct panel regressions in which we estimate the impact of unemployment on the propensity to join the terrorist group, controlling for country and education-level fixed effects. The estimated coefficients indicate that higher unemployment rates are a push factor towards radicalization, especially for countries at a shorter distance to Syria, with an elasticity of 0.25; a one percentage point increase in the unemployment rate leads to 42 additional Daesh recruits. The elasticity steeply decreases further away from Syria and becomes both economically and statistically insignificant past the average distance of 2,500 km. The results are robust to the inclusion of education-specific wage rates, strengthening the case for a causal interpretation of these results (pg. 1-2).

I’m reminded of the famous quote by Nobel laureate Robert Lucas: “The consequences for human welfare involved in questions [of economic growth] are simply staggering: Once one starts to think about them, it is hard to think about anything else” (pg. 5).

The Value of the Internet

From The Economist:

Many economists believe that national accounts may underestimate the economic significance of technological innovations. Despite the advent of the internet, smartphones and artificial intelligence, the official value added by the information industry as a share of GDP has scarcely changed since 2000. What might explain this paradox?

Part of the problem is that GDP as a measure only takes into account goods and services that people pay money for. Internet firms like Google and Facebook do not charge consumers for access, which means that national-income statistics will underestimate how much consumers have benefitted from their rise.

One way to quantify how much these internet services are worth is by asking people how much money they would have to be paid to forgo using them for a year. A new working paper by Erik Brynjolfsson, Felix Eggers and Avinash Gannamaneni, three economists, does exactly this and finds that the value for consumers of some internet services can be substantial. Survey respondents said that they would have to be paid $3,600 to give up internet maps for a year, and $8,400 to give up e-mail. Search engines appear to be especially valuable: consumers surveyed said that they would have to be paid $17,500 to forgo their use for a year.


Recall the thought experiment put forth by The Washington Post: “Try this thought experiment. Adjusted for inflation, would you rather make $50,000 in today’s world or $100,000 in 1980’s? In other words, is an extra $50,000 enough to get you to give up the internet and TV and computer that you have now?”

Are We Underestimating the Gains from Trade?

It sure looks that way. According to a recent study,

Related imageAssessing the size and identifying the sources of gains from trade is a long-standing challenge for economists. Theoretical and quantitative studies have mostly focused on static economies where changes in international market integration have only one-off effects on the levels of income and consumption but do not affect the long-run dynamics of these key economic variables (Costinot and Rodriguez-Clare, 2014). Since innovation and technological change are key drivers of income growth in the long-run (Aghion and Howitt, 2009, Akcigit et al. 2017), in a recent paper (Impullitti and Licandro 2018) we explore the sources and assess the size of the gains from trade in an economy where growth spurs from technological progress. 

Building a quantitative model for policy analysis requires a theory sufficiently grounded on a (large enough) set of relevant empirical facts. We focus on the following facts, each corresponding to a particular channel of gains from trade. 

  • First, there is strong evidence documenting competition effects of trade (Feenstra and Weinstein 2017). Increasing foreign competition is often found to reduce firm prices thereby shrinking their profit margins. Lower prices benefit consumer by increasing their purchasing power, this is the so-called pro-competitive effect of trade. 
  • Second, the reduction in profits forces some of the less-profitable and less-productive firms out of the market, thereby reallocating market shares toward the most productive firms (Bernard et al. 2012). This selection effect generates an additional channel of gains from trade, as more productive firms charge lower prices. 
  • Finally, foreign competitive pressure and selection, along with access to foreign markets induce firms to increase their investment in innovation to improve productivity and stay ahead of competitors (Bloom et al. 2015, Aghion et al. 2017). This innovation effect leads to dynamic gains from trade, as higher productivity growth produces not just one-off price reductions but a sequence of reductions across time, thereby increasingly benefiting present and future consumers.

We construct a model embedding all three key channels through which trade can potentially increase average income and consumption and calibrate it to replicate key aggregate and firm level trade and innovation statistics of the US economy. Frontier quantitative trade models embed only the first two channels in static economies where the effects of a policy change take place through timeless reallocations of market shares across firms and sectors but each firm’s productivity is kept constant. The selection and competition effects of trade reallocates resources toward the most productive firms, thereby increasing the average level of productivity and reducing prices. In our dynamic economy, trade-induced reallocations increase the size of the most productive firms and raise their incentives to innovate, thereby pushing up the growth rate of productivity. Hence, the model is able to separately measure the static gains form competition and selection and the dynamic gains produced by the interaction of these forces with innovation-driven productivity growth.

The authors’ findings

suggest that policy evaluation with static trade models is likely to largely underestimate the gains from globalisation. We have shown that innovation can be a key driver of dynamic gains from trade. Other recent papers have suggested that dynamic gains from trade can also come via technology diffusion (Sampson, 2016, Perla and Tonetti, 2016), and also stressed the importance of quantifying both the short and long-run effects of trade by exploring the full transitional dynamics generated by trade shocks (Akcigit, et al. 2018). This new class of macro-trade models have laid the basis for future quantitative frameworks to measure the effects of globalisation on per-capita income and consumption. 

Did Mass Immigration Improve Jordan’s Institutions?

Image result for jordan country

The following is from my article in the latest BYU Studies Quarterly:

Another objection [to immigration] is what is known as the “epidemiological case,” which argues that immigrants may bring with them foreign values that undermine the culture and institutions of the host country. In essence, immigrants transmit to rich countries those elements that make their source countries poor. What makes this rather prejudiced argument all the more jarring is the fact that it has virtually no supporting evidence. Unfortunately, very little empirical research has been conducted exploring the impact of immigrants on cultural, political, and economic institutions at all. However, the research that is available should calm fears and actually provide reasons for optimism. For example, there is no association between growth of total-factor productivity (TFP) in rich countries and the ratio of migrants from low-income countries, indicating that migrants do not “contaminate” their new homes with the low productivity of their source countries.

The Canada-based Fraser Institute publishes its oft-cited Economic Freedom of the World report annually. Its indicator—known as the Economic Freedom of the World (EFW) Index—defines economic freedom based on five major areas: (1) size of the government, (2) legal system and the security of property rights, (3) stability of the currency, (4) freedom to trade internationally, and (5) regulation of labor, credit, and business. According to the institute’s most recent report (which looks at data from 2015), countries with more economic freedom had considerably higher per-capita incomes and economic growth. Relying on this index, a 2015 study found that a larger immigration population marginally increases the economic freedom of the host country’s institutions. No negative impacts on economic freedom were found. Several authors from this study looked at Israel during the 1990s as a natural experiment in mass migration. During the 1990s, Israel’s population grew by 20 percent due to immigrants from the former Soviet Union. Yet, instead of experiencing decline, Israel shot up “from 15% below the global average [in economic freedom] to 12% above it and improv[ed] its ranking among countries by 47 places.” Similarly, a 2017 study found that higher diversity—measured by levels of ethnolinguistic and cultural fractionalization—predicts higher levels of economic freedom. While this particular study mainly discusses development economics,the correlation between high diversity and high economic freedom is an important aspect of the immigration debate. Barring members of different ethnolinguistic groups from entering the country may actually be holding back economic development (pg. 95-97).

Now, a new Cato working paper adds more evidence to the pile. The authors write,

In 1990 and 1991, about 300,000 Palestinians were expelled from Kuwait by Saddam Hussein’s invasion and could not return after the war (van Hear 1992, 5; Colton 2002). These Kuwaiti-Palestinians were forced to Jordan where, due to a quirk of Jordanian law, they arrived as citizens who could vote, work, own property, and otherwise influence the political and economic system of Jordan even though most of them had never lived in Jordan before. The surge of 300,000 Kuwaiti-Palestinians was equal to about 10 percent of Jordan’s pre-surge population. If such a proportionally large, sudden surge of immigrants entered the United States in 2015, it would be as if 31.6 million immigrants entered in a single year. To make it more challenging, the Kuwaiti-Palestinians arrived in the midst of a severe recession in a country with far weaker economic institutions. While this example does not speak directly to emigration from the developing world to the developed world, it does provide another example of how institutions change under migratory stress.

Natural experiments like these are valuable because they remove concerns about endogeneity and are more convincing than large cross-sections of many countries. Economists have successfully used natural experiments to study how exogenous immigration shocks affect labor markets (Card 1990; Hunt 1992; Carrington and de Lima 1996; Angrist and Krueger 1999; Friedberg 2001; Lach 2007; Kugler and Yuksel 2008; Alix-Garcia and Saah 2009; Cohen-Goldner and Paserman 2011; van der Vlist, Czamanski, and Folmer 2011; Glitz 2012; Ceritoglu, Yunculer, Torun, and Tumen 2017; Balkan and Tumen 2015; Borjas 2015). We turn these empirical methods to understanding how an exogenous surge of immigrants affects institutions (pg. 5-6).

Their findings?:

Jordan’s absolute economic freedom score was 5.43 in 1990 and rose rapidly to 6.14 in 1995 and then 7.06 by 2000 (Figure 1). It also increased relative to the average economic freedom score for all non-developed, OECD, and Organization of Islamic Cooperation (OIC) nations after 1990…Relative to all non-developed nations, Jordan went from having an absolute economic freedom score of 0.5 above all non-developed countries in 1990 to 1.1 points above in 2000. Relative to Organization of Islamic cooperation countries, Jordan went from 1 point ahead in 1990 to 1.5 points ahead in 2000. It also closed the gap with OECD countries from 1.3 in 1990 to around 0.5 in 2000. Jordan’s economic freedom score was slightly above those of the non-OECD world in 1975, but it converged with the economic freedom score of the OECD nations by the early 2000s…Relative to the OECD mean, Jordan’s economic freedom score gap widened from 0.50 points to 1.12 points from 1980 to 1990 but then narrowed to 0.57 in 2000 and 0.44 in 2002…Jordan’s economic freedom score climbed from one similar to the average of the non-OECD world in 1980 to one much closer to the OECD mean in 2002 (pg. 15-16).


Do Mexicans Take or Create Employment in Texas?

From Dallas Morning News:

Far from taking jobs away from Texans, Mexicans are helping create additional employment opportunities, providing valuable labor for a growing economy and helping the deepening integration with Mexico, according to the Texas-Mexico Center at Southern Methodist University.

…The study  relied on data from the U.S. Census Bureau and its Mexican counterpart, known as INEGI. The study, with contributions by the Bush School of Government at Texas A&M University, the Federal Reserve Board of Dallas and Colegio de Mexico in Mexico City, stressed the importance of labor from Mexico, which is in decline in many parts of the United States.

Underscoring the trends is the 1994 North American Free Trade Agreement, or NAFTA. The trade accord led to a dramatic economic transformation that fueled a shift in goods, products and movement of people, factors that over the years have impacted cities and regions. For instance, supply chains and cultural integration deepened in cities such as Dallas as Mexico-based companies moved into North Texas along with their products — from tortillas to pasta to  Topo Chico —  and, of course, more workers.

Some of the study’s findings include:

  • Trade with Mexico does not hinder interstate trading in the U.S. States are still more likely to trade among themselves than across the border with Mexico, which shows the border trade relationship supports both national and international trade.
  • Because of the integration across value chains, there is clear evidence that Mexican and U.S. workers are complements for each other rather than substitutes.
  • Revisions of NAFTA need to maintain cross-border integration.
  • Freer migration reduced Mexico´s wage inequality.

The preliminary findings can be found here.

Do Economists Think Tariffs Help or Hurt?

Hurt. This isn’t even controversial among economists. Take the IGM Economic Experts Panel out of the University of Chicago. The panel was asked to respond with whether or not they agree with the following: “Imposing new US tariffs on steel and aluminum will improve Americans’ welfare.” And what do we get? A big fat nope.

But I’m sure people (and Presidents) will keep on saying and thinking things that aren’t true.

Image result for that's not how any of this works gif

DR Editor in BYU Studies Quarterly: “Ye Are No More Strangers and Foreigners”

I’m excited to announce that my article “”Ye Are No More Strangers and Foreigners”: Theological and Economic Perspectives on the LDS Church and Immigration” has been published in the latest issue of BYU Studies Quarterly. From the abstract:

Issue 57:1 CoverImmigration policy is controversial topic in 2018. In response to refugee crises and legal situations that can break up families, the LDS Church announced its “I Was a Stranger” relief effort and released a statement encouraging solutions that strengthens families, keeps them together, and extends compassion to those seeking a better life. This article seeks to shed light on a correct understanding of immigration and its effects. Walker Wright gives a brief scriptural overview of migration, explores the public’s attitudes toward immigration, and reviews the empirical economic literature, which shows that (1) fears about immigration are often overblown or fueled by misinformation and (2) liberalizing immigration restrictions would have positive economic effects.

From the editors:

Walker Wright’s article on religious and economic perspectives about immigration, strangers, and refugees is marvelously timely. He approaches the debate over immigration through a double lens: the Church’s official statements and scholarly research on the economic effects of immigration. He demonstrates that the Church’s accommodating approach is overwhelmingly supported by the research. Migration is often impelled by external pressures, but it is ultimately the voluntary response of those fleeing to improve their lives. Immigrants come unassigned, so people can reach out to them without needing to be asked (pg. 5).

The article is divided into the following sections:

  • “I Was a Stranger”
  • Migration in Scripture and Sacred History
  • Strangers, the Sin of Sodom, and Zion
  • Public Opinion on Immigration
  • The Economy as a Whole
  • Global Poverty
  • Refugees
  • Common Objections to Immigration
    • “Stealing” Jobs
    • Depressed Wages
    • Culture and Institutions
    • Fiscal Burden and Welfare Cost
    • Terrorism and Crime

Check it out. You can also access it on my Academia.edu page.


Total and Intangible Wealth: World Bank Report 2018

I’ve mentioned the World Bank’s measurement of intangible assets before. Its recent report–The Changing Wealth of Nations 2018: Building a Sustainable Future–updates this measurement:

Image result for human capitalTotal wealth in the new approach is calculated by summing up estimates of each component of wealth: produced capital, natural capital, human capital, and net foreign assets. This represents a significant departure from past estimates, in which total wealth was estimated by (1) assuming that consumption is the return on total wealth and then (2) calculating back to total wealth from current sustainable consumption…In previous estimates, produced capital, natural capital, and net foreign assets were calculated directly, then subtracted from total wealth to obtain a residual.

The unexplained residual, called “intangible capital,” was largely attributed to human capital…as well as to missing or mismeasured assets and possible effects of social capital. But the unexplained residual accounted for 50–85 percent of the total wealth indicator, making it a weak indicator for policy. This approach was taken because of the lack of data for directly measuring human capital. We now have a method and data for estimating human capital directly and will measure total wealth as the sum of each asset category. The advantage of the earlier approach was that the residual included human capital, unmeasured assets, and the influence of institutions and governance on wealth. The disadvantage was that the various components of the residual could not be disentangled and it was calculated assuming the same return on assets in all countries.

Human capital in the past was not measured explicitly but included as part of the “residual,” accounting for 50–85 percent of total wealth in past estimates. We apply the well-known Jorgenson Fraumeni lifetime earnings approach to measuring human capital globally. We use a unique database developed by the World Bank, the International Income Distribution Database, which contains more than
1,500 household surveys (pgs. 38-39).

This report

shows for the first time that much of intangible wealth is actually human capital, estimated as the net present value of the population’s future labor earnings. Human capital turns out to be the most important component of wealth, even though its share in total wealth decreased from 69 percent in 1995 to 64 percent in 2014 (table 2.2). After 2000, this decline in the share of human capital wealth was entirely due to upper-middle and high-income OECD countries, which together account for more than 80 percent of global wealth as well as most human capital wealth. The factors that led to this decline include the aging of the labor force (which reduces the remaining years of earnings) in many high-income OECD countries, as well as in China, which dominates the upper-middle-income country group, and declining wage shares in GDP, particularly in many high-income OECD countries (ILO 2015). By contrast, in low- and lower-middle-income countries, which account for the majority of the world’s population, the share of human capital in total wealth is rising (pgs. 46-47).

The new report calculates total wealth as follows:

Total wealth = Natural capital + Produced capital + Human capital + Net foreign assets

“This represents a significant departure from past estimates,” the report explains,

in which total wealth was estimated by assuming that consumption is the return on total wealth, and then calculating back to total wealth from current sustainable consumption (“top-down approach”). In previous estimates, produced capital, natural capital, and net foreign assets were calculated directly, then subtracted from total wealth to obtain a residual. The unexplained residual, called “intangible capital,” was largely attributed to human capital as well as to missing or mismeasured assets. Now with a direct measurement of human capital,[ref]See Ch. 6 for an explanation of the methodology for measuring human capital.[/ref] total wealth can be estimated as the sum of all categories of assets (pg. 212).

In turns out that the U.S. has $983,280 total wealth per capita with human capital making up $766,470 (see pg. 232). Other findings include:

  • The report found that global wealth grew 66 percent (from $690 trillion to $1,143 trillion in constant 2014 U.S. dollars at market prices).
  • The top 20 countries with the fastest growing wealth per capita were dominated by developing countries—including two of the biggest—China and India, which were both classified by the World Bank as low income countries in 1995 and are now ranked as middle-income.
  • Countries with large gains in per capita wealth also included smaller countries like Chile, Peru, Vietnam, as well as countries rapidly recovering from civil disturbances like Bosnia-Herzegovina, Ethiopia, Rwanda, and Sri Lanka as well as some of the resource rich countries in the former USSR, like Azerbaijan.
  • Per capita wealth declined or was stagnant in more than two dozen countries in various income brackets. These include several large low-income countries, some carbon-rich countries in the Middle East, and high-income OECD countries affected by the 2009 financial crisis. Declining per capita wealth implies that assets critical for generating future income may be depleted, and the rents generated from natural assets depletion are not invested properly, a fact often not reflected in national GDP growth figures.
  • Human capital is the largest component of global wealth, accounting for two thirds of total wealth globally. This points to the need to invest in people for wealth creation and future income generation.
  • While natural capital accounts for 9 percent of wealth globally, it makes up nearly half (47 percent) of the wealth in low income countries. More efficient, long-term management of natural resources is key to sustainable development while these countries build their infrastructure and human capital.

Breaking News: Communism Makes People Worse Off

From a recent study:

Our bivariate analyses show that the recent cultural factors examined—communist history and religion—are, taken alone, good predictors of the Human Development Index and its components (table 1). When incorporated alongside phylogeny and geography, phylogeny ceases to be a significant predictor of HDI or any of its components, meaning recent cultural factors combined with geography can account for covariation between HDI and cultural phylogeny (table 3). Communism significantly negatively predicts HDI, income and health indices, but religion ceases to be a significant predictor except for a negative correlation between Islam and education index. These results support a significant effect of communist history on the human development of countries, comparable to the effects of geography (which remains a significant predictor of HDI and income index), and more immediately important than cultural phylogeny or religion.

…Communist history shows a significant negative correlation with the national income of the countries in our dataset. Post World War II economic growth in communist countries was modest, especially during the 1970s and 1980s, relative to non-communist European countries [92], and the centrally planned economy of communist countries has long been held by economically liberal theoreticians to hamper conventional economic growth [9395]. Although the countries in the dataset had abandoned communism for most of the years in the dataset, the residual effect of communism appears to still be detectable. Institutional and cultural traits produced by communism and by dictatorship may continue to retard growth today, with corruption still regarded as higher in Eastern than Western Europe [96] and linked to lower national income [97]. It should also be noted, however, that many of the former communist countries (largely those in the former Soviet Union) also suffered major economic turmoil following the demise of their communist governments [98], and that this too may play a role in explaining the apparent effect of communism on income. Moreover, it must be noted that the communist countries in the sample are all Eastern European and Central Asian, and that these areas were less wealthy than Western Europe even prior to communism [92,99], and indeed Russia saw rapid economic growth following the advent of communism, although this lessened over time [92,100]. For all these reasons the results presented here must be treated with caution, and are primarily intended as a control in the context of examination of deep cultural effects on human development, not as a thoroughgoing analysis of the effects of communism on development.

Communism also shows a significant negative association with health index (i.e. normalized longevity), although only at p = 0.05 level. This confirms the stagnation and even decline of life expectancy in Europe under communism during the 1970s and 1980s, corresponding to years of low economic growth (see above), which has continued to set formerly communist countries back in terms of life expectancy until today [101,102]. The proximate causes for this low life expectancy are complex, but high alcohol consumption, smoking and poor workplace safety, as well as low quality diet and living conditions associated with lower income levels are implicated [101]. Most of the same caveats also apply here as to the economic effects of communism however, with lifespan decreasing rapidly in the former Soviet Union immediately following post-Soviet collapse [101], and lifespan having increased strongly in the Soviet Union prior to and immediately after World War II [103].

Longevity greatly increased during recent centuries in Europe in part due to generally rising living standards (and thereby nutrition [104]), with increasing health and longevity interacting with the economy in a positive feedback loop [105]. Communist history may thus have also influenced longevity via its effect on income, with income being a significant predictor of health index (electronic supplementary material, table S1). Consistent with this explanation, we find that communism is no longer a significant predictor of health index when controlling for income index.

Communism lowers human well-being. Who knew?[ref]There’s more to the study (such as Islam’s negative correlation with education), but this jumped out at me.[/ref]

Image result for wow black guy gif

What Are the Economic Gains from International Trade?

Reporting on a recent working paper, the April 2018 NBER Digest summarizes,

 There is surprisingly little direct quantitative evidence on how the U.S. economy would react if the door were shut on trade. To find a precedent, the researchers point out that one could go back to the Embargo Act of 1807, when the United States banned trade with Great Britain and France in retaliation for their repeated violations of U.S. neutrality. GDP declined sharply, but the agrarian world during the presidency of Thomas Jefferson bears little resemblance to today’s high-tech, service-oriented economy.

…To simplify the analysis, they elect to focus on trade in factor services, namely the labor and capital embedded in goods purchased from around the world. They then estimate the gains from trade by comparing the size of a counterfactual U.S. economy that depends entirely on domestic resources with one that has access to foreign factor services through international trade.

…The researchers do not offer a single estimate of the gains to the U.S. economy from international trade, but they suggest that the reasonable range falls between 2 and 8 percent of GDP. They acknowledge that while foreign trade raises the level of economic output, not everyone is a winner. Consumers enjoy lower prices, but some workers may see that benefit offset by declining wages or layoffs.

Not too shabby.

Related image