Does the “Profit Motive” Inhibit Art?

“Profit and profitability are…crucial–for society even more than for the individual business,” wrote the late Peter Drucker.

Yet profitability is not the purpose of, but a limiting factor on business enterprise and business activity. Profit is not the explanation, cause, or rationale of business behavior and business decisions, but rather the test of their validity. If archangels instead of businessmen sat in directors’ chairs, they would still have to be concerned with profitability, despite their total lack of personal interest in making profits. The root of the confusion is the mistaken belief that the motive of a person–the so-called profit motive of businessmen–is an explanation of his behavior or his guide to right action. Whether there is such a thing as a profit motive at all is highly doubtful…In fact, the concept is worse than irrelevant: it does harm. It is a major cause of the misunderstanding of the nature of profit in our society and of the deep-seated hostility to profit, which are among the most dangerous diseases of an industrial society…And it is in large part responsible for the prevailing belief that there is an inherent contradiction between profit and a company’s ability to make a social contribution. Actually, a company can make a social contribution only if it is highly profitable.[ref]The Essential Drucker, pgs. 18-20.[/ref]

Drucker goes a little too far (his dismissal of economic explanations is a bit, well, wrong), but I was nonetheless reminded of this with the passing of science fiction authior Ursula Le Guin. In her speech at the 2014 National Book Awards, she said, “Books aren’t just commodities; the profit motive is often in conflict with the aims of art.” This is because “we live in capitalism” and “its power seems inescapable.” I suppose that could be true of profit to an extent, but the best evidence we have suggests the opposite. Economist Federico Etro’s work has shown that profitability helped drive artistic innovation over the centuries. For example, in Renaissance Italy, Etro found

a slow decline in real prices up to the 1420s, when the real price of paintings starts a rapid increase that continued for all the rest of the century. This process is more spectacular for the expected profitability of painting (the index based on the baseline regression), which suggests that the artistic profession was becoming more profitable. The expected compensations of a young apprentice (unaware of his future talent) were increasing during the XV century. But a similar increase in profitability applies also conditioning on the talent of the painter: the index of the expected compensation of a given painter (the one based on the full regression with artists’ fixed effects) reaches levels in the 1480s that are about three times as those of the 1420s. This suggests that the quality of the active painters was increasing over time, but even the most talented artists during the mid 1400s could expect an increase in their compensations along their career. Finally, notice that in the first half of the XVI century the real price of paintings finally stabilized at a relatively high level, which, as I argued, was not differentiated between regions. 

This evolution suggests a Schumpeterian pattern. Part of the artistic creativity associated with Renaissance, and the artistic innovations of this period, such as the introduction of exact perspective (since the 1420s), oil colors (around the 1470s), the sfumato (with Leonardo), the colorito (with Titian) and an impressive differentiation of styles, may be due to increasing profitability of the profession made possible by the increasing demand for artistic goods. My data do not allow me to test directly for causality, but show for the first time that the expected profitability of the artistic profession was increasing rapidly during the XV century compared to the profitability of other professions (since we adjust prices for the purchasing power in terms of unskilled work). We should not underestimate the opinion of a privileged contemporary, Vasari, who repeatedly cited competition as a main driver of the achievements of the Florentine painters[.]

…An economic perspective suggests that it was the unprecedented increase in relative demand for artistic goods by wealthy patrons ready to compete for (and able to judge) quality in an interregional market that attracted large enough groups of painters in towns such as Florence, Venice and Rome. Competition incentivized these painters to differentiate styles and compete in quality, where higher quality was interpreted as the ability to solve a series of new technical problems in the realistic reproduction of the world in painted images. Under these rules of the game, positive externalities from the close interaction of painters in these towns strengthened their innovative ability (pgs. 25-28).

This was also true in Baroque era Italy:

We have studied the Italian market for oil paintings of historical subject during the Baroque era through econometric analysis of a unique data set containing the prices derived from the original contracts. Our main purpose was to show that looking at the market for paintings as a fully fledged market could shed light on the determination of the prices of some of the most valuable handmade objects of humankind. The market for oil paintings was extremely competitive and populated by players very similar to what we may now define as representatives of the homo economicus

…In a celebrated historical account of the demand for art in the Renaissance period, Richard A. Goldthwaite has pointed out that Italian cities have generated the first modern markets for durable luxury goods, which have been at the origins of modern capitalism based on consumerism. “Today the consumer instinct is taken for granted: the challenge to producers is to introduce new products, reduce prices, and change fashion… If, on the one hand, we decry what this consumerism has developed into in our own times, with its commodity culture of planned obsolescence, throwaway goods, and fashion-ridden boutiques, on the other hand, we have enshrined its very spirit in our great museums. These veritable temples to the consumption habits of the past, where we worship as art one of the dynamics that gives life to the economic system of the West, mark the supreme achievement of capitalism.” The market for paintings in the sixteenth-seventeenth century is not only one of the first markets for durable luxury goods of the modern capitalistic society. Its surviving documentary evidence and even its surviving products are witnesses that it was also one of the first markets to follow the main laws of economics and rational market behavior (pg. 437).

Etro has found similar patterns in the Venetian Republic between 1550 and 1750, Amsterdam during the Golden Age, and the Spanish Golden Age. Profitability and market forces don’t necessarily inhibit art. Most of the time, they allow art to flourish.


Was the China Shock Actually a Boom?

I’ve talked about the China Shock before. The concern is that imports from China reduced the amount of jobs in the United States. However, new research suggests otherwise:

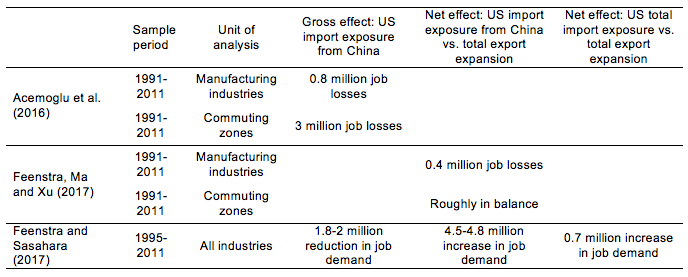
Our empirical results show important job gains due to US export expansion. We find that although imports from China reduce jobs, the global export expansion of US products creates a considerable number of jobs. Based on the industry-level estimation, our results show that on balance over the entire 1991-2007 or 1991-2011 periods, job gains due to changes in US global exports largely offset job losses due to China’s imports, resulting in about 300,000 to 400,000 job losses in net. Estimation at the commuting zone level generate even bigger job creation effects: in net, global export expansion substantially offsets the job losses due to imports from China, resulting in about 200,000 net job losses over the period 1991-2007, and a roughly balanced net effect if we extend the analysis to 1991-2011.

In Feenstra and Sasahara (2017), we quantify the employment effect of US imports and exports using a global input-output analysis. Following the technique of Los et al. (2015), we use the world input-output table from WIOD and examine the employment effects of US total exports and imports from China and from all countries during the period 1995-2011. Admittedly, this approach only indicates the impact of trade on labour demand, without taking into account the (regional) supply of labour in general equilibrium.

We find that the growth in US exports created demand for 2 million manufacturing jobs, 500,000 resource-sector jobs, and a remarkable 4.1 million jobs in services, totalling 6.6 million. The positive job creation effect of exports in the manufacturing sector, 2 million, is quantitatively similar to the result in Feenstra et al. (2017), in which 1.9 million jobs were created by US exports from the instrumental-variable regression approach. On the import side, our analysis shows that manufacturing imports from China reduced demand for US jobs by 1.8-2.0 million, which is similar to the result in Autor et al. (2016), who finds a decline of 2.0 million jobs due to imports from China.

One advantage of the input-output approach is that it is easy to extend the analysis to other sectors such as services and natural resources. Our results show that, when focusing on the manufacturing sector and the natural resource sector, the net effect of overall trade with all countries in all sectors is slightly negative: 80,000 reduction in demand for jobs in manufacturing, and a 250,000 job reduction in the natural resource sector during 1995-2011. However, when looking at the service sector, we find a substantial net job gain, with a 1.03 million increase in the demand for jobs due to overall trade with all countries. This is large enough to compensate for the net job losses in the manufacturing and natural resource sectors. After taking all of these into account, the net effect of overall trade with all countries led to a net increase in labour demand of 700,000 jobs.

They conclude,

Our results fit the textbook story that job opportunities in exports make up for jobs lost in import-competing industries, or nearly so. Once we consider the export side, the negative employment effect of trade is much smaller than is implied in the previous literature. Although our analysis finds net job losses in the manufacturing sector for the US, there are remarkable job gains in services, suggesting that international trade has an impact on the labour market according to comparative advantage. The US has comparative advantages in services, so that overall trade led to higher employment through the increased demand for service jobs.


Economic Freedom of North America 2017

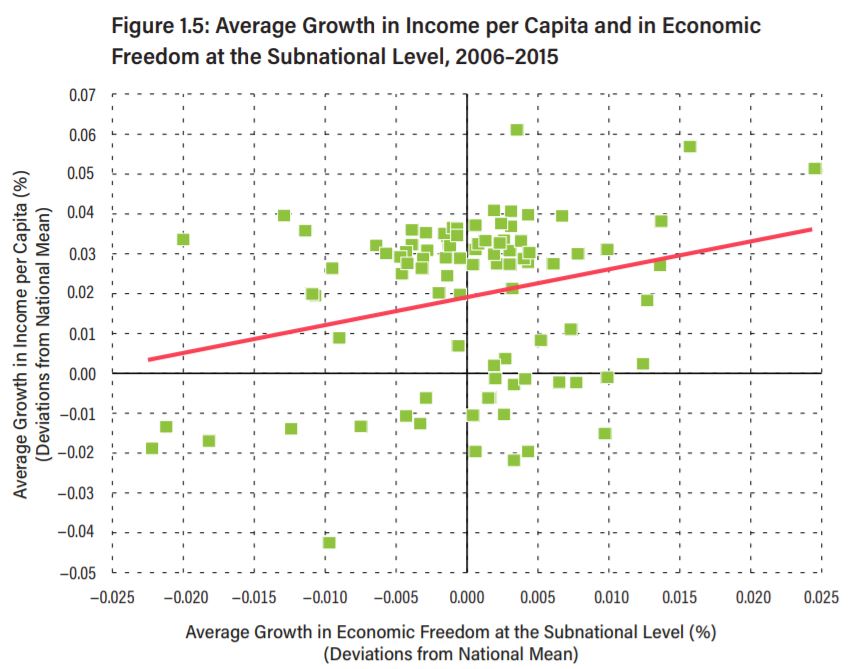
The Fraser Institute–who publishes the oft-cited Economic Freedom of the World report–published their latest Economic Freedom of North America report toward the end of December. This report looks at states within Canada, the United States, and Mexico. Once again, there is a link between economic freedom and economic well-being.

I’m happy to report that Texas is tied with Florida for the 2nd most economically free state in the United States and tied for 3rd (along with 10 other U.S. states, including Florida, South Dakota, Nevada, and Georgia) at the national level. Yet, the Cato Institute’s Freedom in the 50 States report finds that we could do better when it comes to personal freedom:

Personal freedom is relatively low in Texas, but it should rise with the Obergefell decision, setting aside Texas’s super-DOMA…Criminal justice policies are generally aggressive—though Texas has emerged as a leading voice in the national reform movement. Even controlling for crime rates, the incarceration rate is far above the national average and has not improved since 2000. Drug arrest rates have fallen over time but are still above average for the user base. Nondrug victimless crime arrest rates have also fallen over time and are now below the national average. Asset forfeiture is mostly unreformed, and law enforcement frequently participates in equitable sharing. Cannabis laws are harsh. A single offense not involving minors can carry a life sentence. Even cultivating a tiny amount carries a mandatory minimum of six months. In 2013–14, the state banned the mostly harmless psychedelic Salvia divinorum. Travel freedom is low. The state takes a fingerprint for driver’s licenses and does not regulate automated license plate readers at all. It has little legal gambling. Private school choice programs are nonexistent, but at least private schools and homeschools are basically unregulated. Tobacco freedom is moderate, as smoking bans have not gone as far as in other states. Gun rights are moderately above average and should improve a bit in the next edition with the new open-carry law. Alcohol freedom is above average, with taxes low. Texas has virtually no campaign finance regulations.

Both are useful indices.

Public Ignorance on Corporate Profits

Numerous studies over the years have demonstrated how ignorant the general public is regarding political matters.[ref]See Ilya Somin, Democracy and Political Ignorance: Why Smaller Government Is Smarter, 2nd ed. (Stanford, CA: Stanford University Press, 2016); Bryan Caplan, The Myth of the Rational Voter: Why Democracies Choose Bad Policies (Princeton, NJ: Princeton University Press, 2007); Christopher H. Achen, Larry M. Bartels, Democracy for Realists: Why Elections Do Not Produce Responsive Government (Princeton, NJ: Princeton University Press, 2016); Jason Brennan, Against Democracy (Princeton, NJ: Princeton University Press, 2016), Ch. 2: “Ignorant, Irrational, Misinformed Nationalists.”[/ref] This systemic ignorance and misinformation in turn warps the public’s policy preferences. AEI’s Mark Perry points out another example of public ignorance: corporate profits. He writes,

When a random sample of American adults were asked the question “Just a rough guess, what percent profit on each dollar of sales do you think the average company makes after taxes?” for the Reason-Rupe poll in May 2013, the average response was 36%! That response was very close to historical results from the polling organization ORC International polls for a slightly different, but related question: What percent profit on each dollar of sales do you think the average manufacturer makes after taxes? Responses to that question in 9 different polls between 1971 and 1987 ranged from 28% to 37% and averaged 31.6%.

How do the public’s estimates of corporate profit margins compare to reality? Not surprisingly they are off by a huge margin. According to this NYU Stern database for more than 7,000 US companies (updated in January 2018) in many different industries, the average profit margin is 7.9% for all companies and 6.9% for more than 6,000 companies excluding financials…Interestingly, for nearly 100 industries analyzed by NYU Stern, there’s only one industry that had a profit margin as high as 36% – and that was tobacco at 43.3%. The next highest profit margin was 26.4% for financial services, but more than 72% of industry profit margins were single-digits and the median industry profit margin is 6%. 

“Big Oil” companies make a lot of profits, right? Well, that industry (Integrated Oil/Gas) had a below-average profit margin of 5.6% in the most recent period analyzed, and separately, the Production and Exploration Oil/Gas industry is losing money, reflected in a -6.6% profit margin. For the general retail sector, the average profit margin is only 2.3% and for the grocery and food retail industry, it’s even lower at only 1.6%. And evil Walmart only made a 2.1% profit margin in 2017 (first three quarters) which is less than the industry average for general retail, possibly because grocery sales now make up more than half of Walmart’s revenue and profit margins are lower on food than general retail. Interestingly, Walmart’s profit margin of 2.1% is actually less than one-third of the 6.5% the average state/local government takes of each dollar of Walmart’s retail sales for sales taxes. Think about it – for every $100 in sales for Walmart, the state/local governments get an average of $6.50 in sales taxes (and as much as $10.12 in Louisiana and $9.45 in Tennessee, see data here), while Walmart gets only $2.10 in after-tax profits!

Perry concludes, “The public’s complete overestimation of how much companies earn in profits as a share of sales explains a lot…The general public that believes in the fantasy-world of unrealistically, sky-high 36% profit margins would naturally think companies are just being greedy and stingy when they don’t pay higher “living wages” and have to be forced to do so through minimum wage legislation. If the average person could realize that a 36% profit margin isn’t even close to reality and that the typical, median firm has a profit margin of only less than 8% or almost 30 percentage points below what the public thinks is a normal profit margin, then hopefully the average person would become a little more realistic about how the business world operates. Companies aren’t being stingy when they pay competitive wages, they’re just trying to survive on what are sometimes razor-thin profit margins, in a competitive environment where there’s not a large margin of error.”[ref]Perry also has a great post and WSJ article about CEO pay.[/ref]

Do Markets Pave the Way for Anticorruption Reforms?

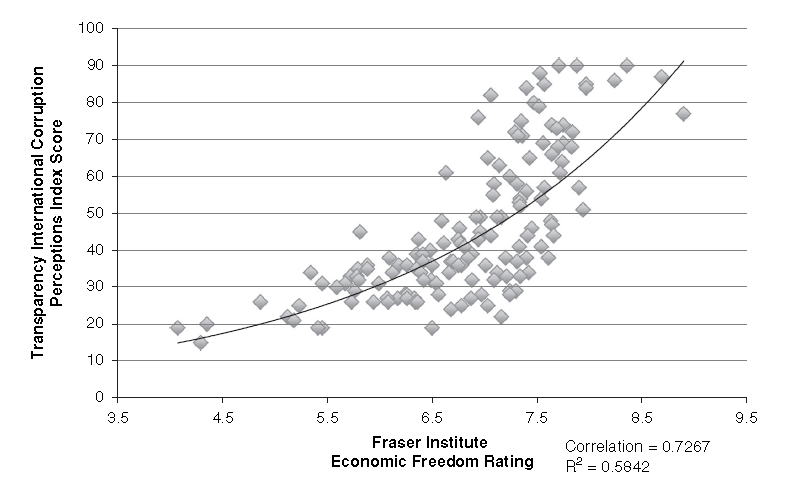
In a paper I have under review, I cite an article by Jason Brennan that points to “a robust positive correlation between countries’ degree of economic freedom (as measured by the Fraser Institute’s economic freedom ratings) and countries’ lack of corruption (as measured by Transparency International’s Corruption Perceptions Index.”[ref]Jason Brennan, “Do Markets Corrupt?” in Economics and the Virtues: Building a New Moral Foundation, ed. Jennifer A. Baker, Mark D. White (New York: Oxford University Press, 2016), 240.[/ref]

Recent studies offer further support to this correlation:

These twin policies [anticorruption reforms and high-quality market institutions] resonate with economic research revealing a mutually reinforcing feedback loop between corruption and stalled development. Corrupt officials misappropriating government money defund public goods and services, including those that might deter corruption. Bribing corrupt officials for regulatory favours or subsidies diverts corporate spending away from investing in productivity and corporate attention away from market signals. This stalls growth, and stalled growth locks in corruption (Krueger 1974, Fisman and Svensson 2007, Ayyagari et al. 2014).

Unfortunately, corruption is an enticing ‘second best’ optimal policy for key actors in an economy with an interventionist government. Bribes grease squeaky bureaucratic wheels to help businesses get things done where officials, not markets, allocate key resources. Bribes supplement officials’ incomes where stunted economic activity keeps government revenues low (Fisman 2001, Wei 2001, McMillan and Woodruff 2002, Li et al. 2008, Calomiris et al. 2010, Agarwal et al. 2015, Zeume 2016).

But once entered, this second-best thinking can entrap a whole economy in a low-level pit (e.g. Murphy et al. 1993, Morck et al. 2005). Powerful officials rationally focus on maximising bribe income (even erecting artificial regulatory barriers they can take bribes for removing), rather than institution building. Profit-maximising firms rationally invest in bribing officials because bribes, not enhancing productivity or responding to market signals, have higher returns. This explains clear empirical findings (e.g. Mauro 1995) linking worse corruption to slower growth.  

The authors note that almost “half of China’s listed firms are S[tate ]O[wned ]E[nterprise]s, and the anticorruption Policy affected SOEs and non-SOEs differently.” They continue,

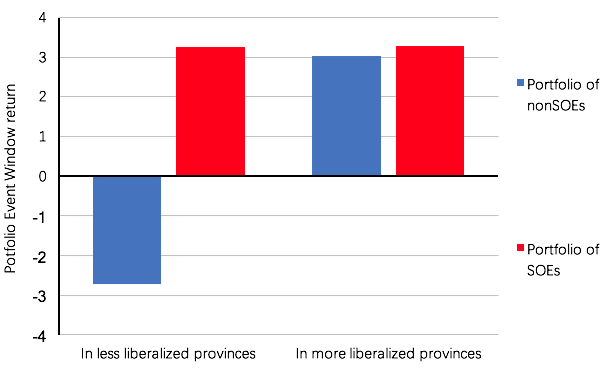
In less liberalised provinces, officials still allocate key resources, so bribing them is critical to get anything done. Deprived of the ability to pay bribes, their non-SOEs might be caught in frozen bureaucratic gears (e.g. Wei 2001). Expecting this, shareholders would price non-SOEs in less liberalised provinces lower on news of the anticorruption Policy. 

In more liberalised provinces, where market forces allocate resources, officials still solicit bribes, but as fees for passing artificial ‘toll booths’ they erect in non-SOEs paths. The new Policy was designed to suppress this behaviour, freeing non-SOEs of these tollbooth fees. Expecting this, shareholders would price non-SOEs in more liberalised provinces higher on news of the anticorruption Policy.

Figure 2, based on findings in Lin et al. (2017), shows exactly this pattern across portfolios of mainland traded shares. SOE shares gain on news of the reform. Non-SOEs in economically liberalised provinces also gain, but non-SOEs in less reformed provinces drop sharply. 

With the announcement of anticorruption reforms, investors “expect[ed] curtailed corruption to advantage non-SOEs previously more encumbered by official ‘toll booths’. Their regressions also show more non-SOEs with higher productivity, more external financing needs, and greater growth potential gaining more on news of the Policy if located in more liberalised provinces.” Furthermore, “Li et al. (2017) find evidence of a shift in credit allocation towards non-SOEs and away from SOEs as the anticorruption reforms took hold. Event studies of subsequent news of follow-on provincial anticorruption policies show non-SOEs, but not SOEs, gaining more (e.g. Ding et al. 2017). These findings are readily interpretable as reinforcing Lin et al.’s findings – investors’ initial expectations about the impact of reforms on SOEs remained unchanged, but the provincial buy-ins led investors to further boost the valuations on non-SOEs in more liberalised provinces.” The authors conclude,

Reducing corruption creates more value where market reforms are already more fully implemented. If officials, rather than markets, allocate resources, bribes can be essential to grease bureaucratic gears to get anything done. Thus, non-SOEs stocks actually decline in China’s least liberalised provinces – e.g. Tibet and Tsinghai – on news of reduced expected corruption. These very real costs of reducing corruption can stymie reforms, and may explain why anticorruption reforms often have little traction in low-income countries where markets also work poorly.   

China has shown the world something interesting: prior market reforms clear away the defensible part of opposition to anticorruption reforms. Once market forces are functioning, bribe-soliciting officials become a nuisance rather than tools for getting things done. Eliminating pests is more popular than taking tools away.    

These patterns in Chinese stock price reactions to news of a genuinely unexpected and seemingly real anticorruption reform suggest the existence of a feedback loop that reform-minded leaders might activate. Market reforms clear the way for anticorruption reforms, and create an advantage for more productive market-ready private sector firms. These are the sorts of firms that are more likely to invest shareholders’ money in productivity-enhancing growth opportunities and less willing to pay bribes. As these firms grow stronger and more important, their self-interest in further market liberalisation and anticorruption reforms would lead them to support political leaders advocating further such reforms. A self-reinforcing upward spiral towards increased wealth and better institutions ensues. 

A virtuous cycle ensues – persistent anticorruption efforts encourage market-oriented behaviour, which makes anticorruption reforms more effective, which further encourages market oriented behaviour. President Xi is right to state that anticorruption reforms are the path to developing high-quality market institutions.

Does Pot Legalization Decrease Drug-Related Violence?

Yes, according to a new economics paper. From an earlier draft,

To test our theory we use crime data from several different sources. First, we use the Uniform Crime Report (UCR) data, which is a panel data set with violent and property crime rates for each county, split into seven crime categories. Out of these seven, our analysis focuses on homicides, aggravated assaults, and robberies as these crimes are often connected to activities of DTOs and their affiliated gangs (see NGIC, 2011). Given that we focus on identifying supply side effects we abstract from analyzing property crime which might be more likely to be influences by the demand side. Second, we use the Supplementary Homicide Reports (SHR) data, which gives information on the circumstances surrounding homicides committed in the US. This data allows us to see whether homicides are related to drug violence. Both data sets cover the period 1994-2012.

Our main analysis applies a difference-in-difference-in-difference (DDD) methodology where we divide counties in four groups depending on i.) whether the county is located in a Mexican border state or an inland state, and ii.) whether the state introduced M[edical] M[arijuana] L[aws] or not. The DDD methodology allows us to fully control for all shocks to the crime rate that affect all states on the border. Examples of such shocks are increases in border patrols and Mexican law enforcement. In addition, we explicitly control for observable confounding factors that may be correlated to both the introduction of MML and the crime rate, and we include state-linear time trends to control for possible unobservable confounding factors. We augment the analysis, by adding a specification where we interact the treatment dummy for the introduction of MML with the distance to the border. This allows us to verify that within Mexican-border states the effect of MML on crime is strongest for counties located close to the border.

…Turning to our main result, we show that MML lead to a strong reduction in the violent crime rate for counties in Mexican-border states. In these counties the violent crime rate decreases by between 10-20 percent depending on the specification. The decrease is strongest in robberies which decrease by 26 percent, followed by homicides at 11 percent and aggravated assaults with 10 percent. When we consider the distance to the border, we find that the strongest decrease in the violent crime rate occurs in counties in close proximity to the border while the effect weakens with the distance of a given county from the border. We find no robust significant effect of MML on crime in counties that are located more than 350 kilometer from the border.

Our point estimates suggest that crime decreases in all 3 border states that have introduced MML. However, the effect is most robust in California. This may be due to the fact that California has a higher take up rate of medical marijuana, as measured by high density of dispensaries within the state.

Our analysis of the SHR data reveals that MML decrease drug-law, juvenile-gang, and robbery related homicides by 46, 34, and 30 percent, respectively within states on the Mexican border. This result is strongly suggestive of the fact that MML in the Mexican-border region are effective in reducing drug-trade and gang-related crimes (pgs. 3-4).

Drug legalization is doing what economists said it would do. Fancy that.

2017: Best Year Ever, Pt. 2

I know I already made this claim about halfway through the year, but the Council on Foreign Relations provides 10 more reasons to shout it from the rooftops:

  1. “The World Health Organization reports in October that global measles deaths have decreased by more than 80 percent since 2000 to an estimated ninety thousand last year.”
  2. “Colombia’s largest Marxist rebel group, the Revolutionary Armed Forces of Colombia (FARC), completes its disarmament process in June, six months after it reached a peace agreement with the government, bringing to a close Latin America’s oldest and bloodiest civil conflict. The second-largest rebel group, the National Liberation Army (ELN), agrees to a temporary cease-fire in September.”
  3. “The hole in the earth’s ozone layer is the smallest it has been since 1988, NASA and the National Oceanic and Atmospheric Administration reports in October.”
  4. “Women’s rights advance in several Arab countries with the passage of legal reforms[.]
  5. “Eight countries adopt legal protections against discrimination based on sexual orientation, bringing the total to eighty-five, according to the International Lesbian, Gay, Bisexual, Trans and Intersex Association.”
  6. “The number of people living in extreme poverty, making $1.90 or less per day, continues its steady drop, falling from roughly 35 percent of the world’s population in 1990 to 8.4 percent in late 2017, according to the Vienna-based World Data Lab.”
  7. “Gambia’s longtime authoritarian president, Yahya Jammeh, steps down on January 20, 2017, weeks after losing his reelection bid to Adama Barrow and a day after troops from the regional bloc ECOWAS cross into the country. Barrow’s government releases hundreds of political prisoners, holds legislative elections deemed free and fair, and announces plans for a truth and reconciliation commission.”
  8. “Maritime piracy declines in the first nine months of 2017 compared to the same period in 2016, dropping 14 percent to 121 incidents, according to the International Chamber of Commerce.”
  9. “After resolving Argentina’s billion-dollar dispute with bondholders in 2016, President Mauricio Macri continues promarket reforms that have lifted the Group of Twenty economy.”
  10. “The eurozone economy grows 2.5 percent more in the third quarter of 2017 than in the same period a year prior. The increase puts the zone’s economy on track to see its highest annual growth since before the 2008 global financial crisis. Unemployment in the single-currency area drops to 9.1 percent, its lowest level since early 2009.”

Image result for you're welcome gif

Progress: Lecture by Johan Norberg

This is part of the DR Book Collection.

Image result for progress norbergSwedish intellectual Johan Norberg has penned a readable, optimistic, and data-driven book on the progress the world has made over the last 200+ years. As the title–Progress: Ten Reasons to Look Forward to the Future–suggests, Norberg focuses on ten aspects of human well-being. Each one has improved dramatically over the last couple centuries:

  1. Food
  2. Sanitation
  3. Life expectancy
  4. Poverty
  5. Violence
  6. The environment
  7. Literacy
  8. Freedom
  9. Equality
  10. The next generation

As I was listening to the Audible version in the car, the section on poverty really got to me, especially this part:

According to some statisticians, 28 March 2012 was a big day for humanity. It was the first day in modern history that developing countries were responsible for more than half of global GDP, up from thirty-eight percent ten years earlier. This convergence makes sense. If people have freedom and access to knowledge, technology and capital, there is no reason why they shouldn’t be able to produce as much as people anywhere else. A country with a fifth of the world’s population should produce around a fifth of its wealth. That has not been the case for centuries, because many parts of the world were held back by oppression, colonialism, socialism and protectionism. But these have no diminished, and a revolution in transport and communication technology makes it easier to take advantage of a global division of labour, and use technologies and knowledge that it took other countries generations and vast sums of money to develop. This has resulted in the greatest poverty reduction the world has ever seen.[ref]Norberg, Progress, Kindle edition, Ch. 4.[/ref]

Me when this part came up in the car.

If you want a fantastic summary of some of the greatest achievements in human history, check it out. You can see a lecture by Norberg in the video below.

TSA link collection

Just a reminder as you travel this holiday season: the TSA is a total waste of money.

The following lists are nowhere close to comprehensive. They are just the links I happened to save over time. The first two groups (Fools, Criminals) are only anecdotes and are a small sample over the course of many years. However, the third group (Incompetent) involves larger sample sets and speaks to the central question: Does the TSA keep us safe?

Fools:
TSA fires screener caught sleeping in Seattle – CNN, January 6, 2003
Florida teen detained because her purse had an image of a gun – Yahoo News, December 2, 2011
TSA subjects wheelchair-bound three-year-old to humiliating search – The Daily Mail, March 19, 2012
TSA Apologizes To Family After Clip of 3-Year-Old Girl in Wheelchair Goes Viral – Huffington Post, February 21, 2013 (Note this is a separate instance than the previous story.)
TSA Humiliated Double Amputee Marine – KTLA, March 22, 2013
TSA Agents Detained Nine-Year Old Boy Because He Had A Pacemaker – Reason, August 23, 2016
A panty liner triggers a TSA pat-down – Washington Post, March 30, 2017

Criminals:
3 ex-TSA workers plead guilty to theft – Seattle Pi, September 23, 2005
TSA Screener Arrested [after taking money from a passenger’s wallet] – TMJ4, October 14, 2006
Ex-TSA agent sentenced for role in pot smuggling scheme at LAX – Daily Breeze, March 25, 2013
6 Shockingly Childish Abuses of Power by Airport Employees – Cracked, April 22, 2014
Suit: Man held 20 hours after asking to file TSA complaint – San Diego Tribune, February 4, 2015
Video Shows Airport Security Tackling Cancer Patient With Disability – Huffington Post, August 12, 2016
A TSA agent who may have lied about a bomb threat can’t be sued – Los Angeles Times op-ed, August 26, 2017 (Passenger threatens to file a complaint against TSA agent, so TSA agent falsely tells police passenger made a bomb threat.)

Incompetent
Airport screeners fail to see most test bombs – Seattle Times, October 28, 2006
The Things He Carried – The Atlantic, November 2008 (Atlantic correspondent carries prohibited items on to multiple flights while investigating what the TSA can actually detect.)
TSA’s Program to Spot Terrorists a $200M Sham? – CBS, May 19, 2010 “The program is failing to catch terrorists. It’s never even caught one.”
Does the TSA Ever Catch Terrorists? – Slate, November 18, 2010
TSA Source: Armed Agent Slips Past DFW Body Scanner – NBC, February 21, 2011
The case for abolishing the TSA – Vox, May 26, 2014
Acting TSA director reassigned after screeners failed tests to detect explosives, weapons – CNN, June 2, 2015 (Note in both 2006 and 2015 the TSA failed to detect the relevant items over 90% of the time.)

The TSA is Still Really Bad at Evaluating Risk – Reason, December 21, 2017
Please, TSA Workers, Don’t Come Back – Reason, January 9, 2019

And just for fun:

See also the related DR post: TSA: A Cost-Benefit Analysis

Is Occupational Licensing a Barrier to Interstate Migration?

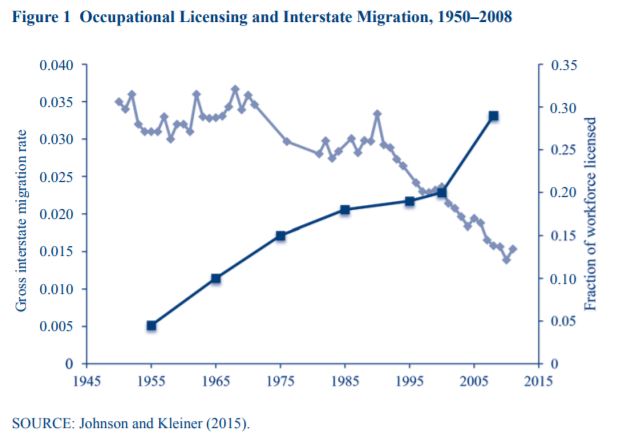
The question and title of a brand new NBER working paper. The authors find (according to the earlier, ungated version) that “the relative interstate migration rate of state-specific licensed occupations is 36 percent lower than that of others” (pg. 16). The authors explain,

We compared the relative within- and between-state migration rates of members of 22 licensed occupations to those of others using data from the American Community Survey. Our empirical strategy compared the relationship between licensure and migration between states and a far distance within state, which controls for unobservable characteristics that influence the propensity of licensed occupations to move out of their local area. First, we found that that migration across states for licensed individuals is reduced, but the size of reduction varies across occupations. Quasi-nationally licensed occupations do not show any limitations on their interstate geographic mobility. Second, using a causal model we find evidence using the reciprocity agreements for lawyers that the adoption of these agreements increases migration of lawyers into a state.

Economists have long held that restrictions on geographic mobility limit the ability of the labor market to operate efficiently. Within this context, occupational licensing provisions that restrict job entry through interstate migration could also be a barrier to economic opportunity and labor market efficiency. Specifically, the paper has empirically examined whether occupational licensing statutes limiting occupational entry from other states influence interstate migration. 

…Our analysis examines the migration of individuals. For many, migration is not an individual decision; instead, it is a choice made on the basis of overall household or family well-being. As our analysis is limited to individuals we observe in an occupation after their move, we miss a potentially important effect of licensure on those making interstate moves: individuals who are forced out of an occupation or of the labor force entirely as a result of moving between states. An example is so-called “trailing spouses”, who move based on their partner getting a better job in another state, and if they were in a licensed occupation prior to the move, may have to switch careers as a result. The effect of licensure on career changes or labor force exits made as a result of household migration is potentially important, and as we cannot identify individuals affected by these phenomena in the ACS, we leave their analysis for future research (pgs. 27-28).

Or, as one of the researchers summarizes in a previous paper,

Johnson and Kleiner’s (2015) more comprehensive analysis of…licensed occupations shows that, after controlling for demographic characteristics, individuals in these regulated occupations have lower interstate migration rates than their peers in other occupations, while the rate at which they move within states is similar. To establish whether or not licensing is behind these differences, the authors perform a difference-in-difference analysis using changes in state licensing laws. State policies on accepting those who fulfill licensing requirements in other states as qualified to practice in their state (called endorsement) and on forming agreements with other states on establishing licensing requirements (called reciprocity) are amended often. For example, for lawyers, Johnson and Kleiner find that states that adopt these more flexible policies have higher migration rates compared to states with no such policies. They find that for these…licensed occupations, the additional costs placed on migration have restricted the movement of individuals in licensed occupations, accounting for part of the decrease in overall migration within the United States.

Taken together, these studies on interstate migration support the view that regulation may limit the number of practitioners in a country and that a policy of reducing barriers to interstate migration would provide benefits to workers and consumers. The ability to move across state lines with fewer impediments and have permission to work would allow individuals to more easily go to where there are jobs. This is particularly important because the growth in wage variation may make it more advantageous to move across state lines (Moretti 2012) (pg. 5).

As legal scholar Ilya Somin quipped on Facebook, this is “[a]n extremely important issue that does not get anywhere near as much attention as it deserves. These barriers victimize consumers and also prevent many workers from moving to areas with greater opportunity.”