Mobility and Growth at the Top and Bottom

“While income trends in such groups are often referred to as growth rates of the ‘rich’ or the ‘poor’,” write the authors of a new paper,

an underappreciated point is that membership in these groups is far from stable over time. When there is mobility in the income distribution, over time some of the initially poor will rise out of the bottom 40%, while others will fall from the top 60% into the bottom 40%. The same is true at the top end, with some fortunate individuals ascending into the top 10% while others drop out of this group.

This has consequences for how to interpret trends in group average incomes. For example, the policy implications, and even the political acceptability, of a given change in average income in the top 1% of the income distribution depends crucially on whether this group of top earners consists of the same people over time, or instead whether some of the initially rich fall out of the top group and are replaced with those who were initially poorer. This distinction matters just as much at the lower end of the income distribution. For example, when evaluating interventions designed to benefit those starting out at the bottom 10% of the income distribution, it is of considerable policy importance to be able to track the same group of individuals over time, and particularly to be able to track the experiences of those who were able to increase their incomes sufficiently to rise out of the bottom 10%.[ref]This has been pointed out by others using various datasets.[/ref]

The authors, in turn,

use data from the World Income and Wealth database, which is derived from published summaries of income tax records to measure average incomes and top income shares in a sample of mostly advanced economies, as well as the World Bank’s PovcalNet database, which reports data on average incomes and summary measures of inequality based on household surveys for a large number of mostly developing countries. Some of the cross-country patterns we observe in estimates of income mobility seem quite plausible given our priors. For example, among the high-income countries, the Scandinavian countries and much of Europe show relatively high levels of income persistence, while the US, Singapore, and Taiwan rank among the countries with low levels of income persistence.

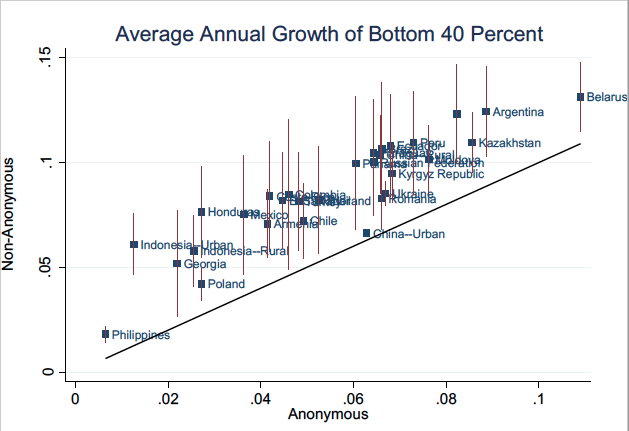
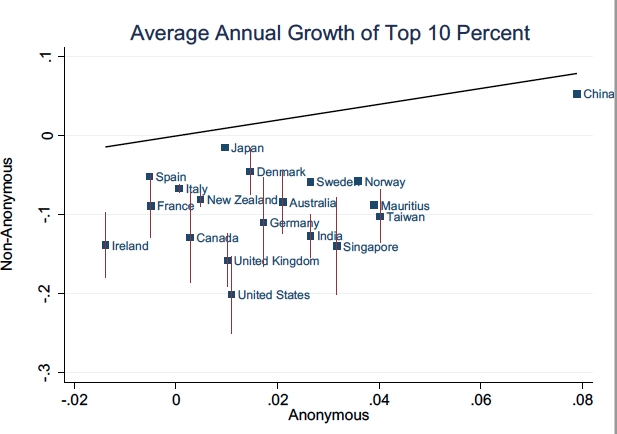
To illustrate the consequences of mobility for growth rates of group average incomes for each country in our dataset, we take the latest available ten-year period and compute the conventionally available anonymous growth rate of average incomes for the top 10% (for countries in the World Income and Wealth database) and bottom 40% (for PovcalNet countries) of the income distribution. We then compare these to estimates of the corresponding non-anonymous growth rates obtained using our approach.

…In the case of the bottom 40%, the non-anonymous growth rate is considerably higher than the corresponding anonymous growth rate (the World Bank’s measure of ‘shared prosperity’). The difference is economically significant, averaging about 3% per year. This gap reflects the fact that the non-anonymous growth rate captures the experience of those who started out in the bottom 40% but had faster-than-average growth and thus rose out of the bottom 40% by the end of the period over which the growth rate is calculated. Conversely, the anonymous growth rate is lower because it reflects the experience of those who started out above the 40th percentile but had slower-than-average growth and thus fell back into the bottom 40%. Putting these observations together, this means that by tracking shared prosperity anonymously, policymakers could inadvertently overlook the success of some initially poor individuals. Or more succinctly, those who start out poor on average grow faster than you might think based on commonly reported anonymous growth rates.

The exact opposite holds true when tracking growth at the top end of the income distribution…As a result, commonly available anonymous growth rates of top incomes exaggerate the fortunes of the rich, often by a considerable margin. Or more succinctly, those who start out rich grow more slowly than you might think based on anonymous growth rates.

Important stuff.


Immigrant Integration: European Edition

I’ve written before about how strict labor laws in Europe may be hindering immigrant integration. While I still think these may be barriers to integration, Europe is doing better than is often reported. As Tyler Cowen explains in Bloomberg,

Debates over immigration are fraught with misconceptions. One of the most common is that the integration of Muslims into societies in Western Europe has gone very badly, in large part because terror attacks loom so large in the news. Those attacks are a very real problem, yet they do not reflect the typical reality. A new study from the Bertelsmann Stiftung in Germany shows that Muslim integration in Europe is in fact proceeding at a reasonable pace.

The survey included more than 1,000 Muslims in Germany and about 500 in Austria, France, Switzerland and the U.K. (both immigrants and children of immigrants were included, though not recent refugees). Although this is hardly the first study of its kind, the results offer considerable hope for societies facing integration challenges: The stereotype of an uneducated, unemployed, easily radicalized Muslim migrant does not fit the facts.

The first sign of integration is language skill. About three-quarters of the Muslims born in Germany report German as their first language; 46 percent of foreign-born Muslims do. Overall, language skills improve with each generation, and migrants seem to be resourceful in finding ways to learn an adopted country’s tongue. Muslims immigrants to France and the U.K. often arrive knowing the languages of their new countries.

Only about one in 10 French Muslims report leaving school before age 17; the American high school graduation rate for all attendees is lower, at 83 percent. In Germany, employment for Muslim immigrants is on a par with employment for non-Muslims, though Muslim wages are lower. The rate of unemployment for French Muslims is a disappointing 14 percent, but that looks less troubling when you consider that migrants are relatively young and French youth unemployment as a whole is about 25 percent. Labor market reforms and better economies can help integrate foreign migrants, and Europe is currently showing decent economic growth, again reasons for hope.

Nor do Muslims huddle in Muslim-only communities, apart from the broader population. Some 87 percent of Swiss Muslims report having frequent or very frequent social contact with non-Muslims. In both Germany and France that number is 78 percent, again a sign of assimilation. It is lower in the U.K. (68 percent) and Austria (62 percent), but even those figures show plenty of social intermingling. And migrants across countries report feeling a close connection to the countries they live in, from a high of 98 percent (Switzerland) to a low of 88 percent (Austria).  

Cowen continues,

The study also suggests that integration works better when the migrants are relatively numerous, perhaps because they can create mutual support services. But making that point is unlikely to win many European elections…The good news is that Western European integration of Muslims is further along than many people believe. The bad news is that the process of integration entails significant social change and change sometimes brings turmoil. The human race is improving at this broader challenge only slowly.

Father Loss at the Cellular Level

Image result for father sonPrinceton molecular biologist Daniel Notterman and colleagues published a new article in Pediatric titled “Father Loss and Child Telomere Length.” According to the IFS blog,

Research tells us that father loss is linked to a broad range of negative outcomes for children, including lower rates of high school and college graduation, a higher risk of delinquency, early sexual activity, teen pregnancy, and poor mental, physical, and emotional health. Yet despite the emerging science of fatherhood, in many ways, we are only beginning to understand the significance of the biological father connection to child well-being. New research indicates that the repercussions of losing a biological father—whether to death, divorce, or incarceration—go even deeper, affecting children at the cellular level.

Notterman explains these new findings in an interview with IFS:

Telomere length (TL) has been shown in many studies to be associated with chronic stress of diverse origins in both children and adults. We reasoned that separation or loss of a father would be a significantly stressful event in the life of a young child. If that were the case, we hypothesized that father loss would be associated with telomere attrition, and that turned out to be the case. We know that chronic stress is also associated with long-term adverse effects on health, including cardiovascular and behavioral health. Whether accelerated telomere attrition is just a biomarker of these subsequent health effects, or actually plays a causal role in producing these effects is not known at present, but it is the subject of intense laboratory and clinical study. In either case, by examining telomere length, we get an early window (by age 9 years in our study) into adverse health effects that may not be realized for many years.

…Father loss was conceptualized as being of one of three types: separation of the biologic father from the child’s mother, often due to the dissolution of their relationship; incarceration of the child’s father; and death of the father before the child was 9 years of age. In addition to the associations noted in the question, we also found evidence of genetic moderation. Due to the presence of specific gene variants (called, “alleles”) in a gene called “SERT,” which is known to affect how the brain processes serotonin, a key neurotransmitter, some children seem to be more sensitive to environmental stimuli such as loss of a parent. In our study, children bearing a sensitizing allele, or variant, or SERT are much more susceptible to telomere shortening. Thus, the magnitude of telomere shortening is affected not only by the loss of a father but also by the genetic endowment received from the parents.

The death of a father is “a more potent stress because it completely ends the relationship between father and child. With separation and incarceration, it is still possible for there to be contact between father and child. Fathers who are separated from the family often maintain contact with a biological child, and incarceration may be limited in time.” And while the effects of father loss were greater for boys than girls (possibly due to fahters providing “specific role-modeling to sons”), the “study was not specifically designed to answer this question.”

Income associated with the father is a major player in one form of father loss, but less in others:

We found that father loss due to the dissolution of the relationship with the child’s mother affects telomere length mainly by reducing family income. We conjecture that this is due to the stress engendered by material hardship (worsening poverty). Father loss due to incarceration or death seems to be a much more potent stress, such that the additional contribution of income loss is relatively small.

In summary,

We think that our findings reinforce the growing understanding of a father’s importance in the life of his children. We do not think that our data support a conclusion that one type of relationship between a child’s parents is more favorable than another; rather, we conclude that a central role for the father is optimal for his child’s well-being. Furthermore, we think that this knowledge should inform public policy in providing support to families and children where the father, for one reason or another, is absent from his children.


Opioid Use and the Labor Force

Image result for opioid prescription

According to a new Brookings paper by Princeton economist Alan Krueger, “The increase in opioid prescriptions from 1999 to 2015 could account for about 20 percent of the observed decline in men’s labor force participation (LFP) during that same period.” Other findings include:

  • Regional variation in opioid prescription rates across the U.S. is due in large part to differences in medical practices, rather than varying health conditions. Pain medication is more widely used in counties where health care professionals prescribe greater quantities of opioid medication, with a 10 percent increase in opioid prescriptions per capita is associated with a 2 percent increase in the share of individuals who report taking a pain medication on any given day. When accounting for individuals’ disability status, self-reported health, and demographic characteristics, the effect is cut roughly in half, but remains statistically significant.
  • Over the last 15 years, LFP fell more in counties where more opioids were prescribed. Krueger reaches this conclusion by linking 2015 county-level opioid prescription rates to individual level labor force data in 1999-2001 and 2014-16. For more on the relationship between prescription rates and labor force participation rate on the county-level, visit these maps.

Krueger also found that “nearly half of prime age men who are not in the labor force take pain medication on a daily basis, and that two-thirds of those men—or about 2 million—take prescription pain medication on a daily basis.” Furthermore, “two-thirds of men not in the labor force and taking pain medication used Medicaid, Medicare, or Veterans Affairs health insurance to purchase prescription pain medication, with the largest group relying on Medicaid.” In short, “Krueger’s analysis reinforces past research in finding that the overall decline in LFP since 2007 is primarily due to an aging population and ongoing trends that preceded the recession, for example increased school enrollment of young workers.”

Check it out.

Who Is More Socially Connected?

“Social capital,” according to the Greater Good Science Center,

refers to family and friends who support you through difficult times, as well as neighbors and coworkers who diversify your network and expose you to new ideas. While social capital originally referred to face-to-face interaction, it now also accounts for virtual interactions online such as email or on social media platforms like Facebook, Instagram, Twitter, and LinkedIn.

Social capital also includes the rewards these social connections yield, such as the feelings of bonding and belonging felt in close friendship, and the expanded worldview you might get from looser, broader connections. And these benefits trickle down to many parts of life; social capital is associated with happiness, better job prospects, cardiovascular health, and positive health-seeking behavior. Among seniors, social capital has been linked to physical mobility and tends to reduce cognitive decline.

Last year, GGSC put out a social capital quiz, asking “readers questions about how connected they feel to a larger community, whether they have someone to turn to in times of need, and how open and curious they are about new people, places, and things—both in-person and online. In reviewing the data, we calculated an overall social capital score, in-person social capital score, and online social capital score for each responder, and we looked at the trends among everyone who took the quiz.” Here’s what they found:

  • Young and old have less social capital than those in between.
  • Ethnicity did not affect social capital scores.
  • More education was linked to higher social capital.
  • People in big cities had higher social capital.
  • People on the West Coast had higher social capital.
  • Liberals might have more social capital than conservatives.

Check out the article for further details.


The Origins of Formal Segregation Laws

Image result for segregation

A new NBER paper looks at the decline in collective action promoting segregation and the rise of formal laws enforcing it. From the ungated version:

The goal of the analysis is to identify which of the two channels (i.e., increases in black housing demand and/or reductions in white vigilante activity) actually drove demand for passage of municipal segregation ordinances. Although our data and estimating strategies are limited, the patterns we observe are consistent with the predictions of the model, though the evidence for the vigilante channel is stronger than for the housing demand channel. In particular, whether we use city-level or ward-level data, we find only mixed evidence that demand for segregation ordinances is strongest in areas with the fastest growing black populations.

By contrast, we find relatively strong and robust evidence for the second channel involving white vigilante activity. Across a variety of model specifications and different measures of white vigilante activity, it is clear that in the cities where whites were able to police color lines and punish deviations through private channels, there was relatively little demand for segregation ordinances. For example, the data show that in cities located in counties with high lynching rates (a direct indicator of the ability of whites to organize privately to punish blacks for violating established racial norms) the probability of passing a segregation ordinance is significantly lower than in places with low lynching rates. Similarly, cities that possessed a robust volunteer fire department (an alternative measure of the ability to provide public goods through private channels) are significant less likely to pass a segregation ordinance. We supplement our city-level analysis with ward level data from St. Louis. With the ward-level data from St. Louis, we can identity which wards were the strongest supporters of the city’s segregation ordinance. The patterns observed in St. Louis suggest that support for the city’s segregation ordinance was strongest in the wards where it was difficult for white communities to coordinate private vigilante activity (pg. 4-5).

The authors conclude,

The existing literature on the origins of municipal segregation ordinances argues that segregation ordinances were passed largely because of rapidly growing black populations in urban areas and variation in the intensity anti-black preferences across cities. Our results suggest the existing literature needs to be revised. While there is evidence that growing black populations might have played a role in the propagation of segregation ordinances, the results here suggest that a decline in the ability of whites to provide a local public good (i.e. segregation) through private vigilante activity was especially important. In particular, the negative coefficient on lynching and the positive coefficients on white population growth are consistent with the hypothesis that segregation ordinances were passed in those cities where it was becoming increasingly difficult for whites to organize and punish blacks for violating established color lines in residential housing markets.

More generally, the model developed and tested here has broad implications for our understanding of residential segregation the processes that give rise to it. Of particular interest is the exploration of how market processes such as tipping interact with institutional change. While prior research has tended to treat market-related processes such as tipping independently from institutions, both formal and informal, the framework here integrates them. In the process, it can help us understand political institutions and market processes work together to drive segregation and make it persistent (pg. 34-35).

Increasing Alcoholism: A Follow-Up

I posted an article a week or so ago on a new study claiming a rise in alcoholism. The study has been met with some major criticism. From Vox:

some researchers are pushing back. They argue that the data used in the study is based on a federal survey [NESARC] that underwent major methodological changes between 2001-’02 and 2012-’13 — meaning the increase in alcoholism rates could be entirely explained just by differences in how the survey was carried out between the two time periods. And they point out that the study’s conclusions are sharply contradicted by another major federal survey…That survey has actually found a decrease in alcohol use disorder from 2002 to 2013: In 2002, the percent of Americans 12 and older who qualified as having alcohol use disorder was 7.7 percent. In 2013, that dropped to 6.6 percent.

One key difference is the NESARC used data of people 18 years and older, while NSDUH used data of people 12 years and older. But even if you isolate older groups in NSDUH, the rates of alcoholism still dropped or remained relatively flat — certainly not the big rise the NESARC reported.

Now, the NSDUH isn’t perfect. For one, it surveys households — so it misses imprisoned and homeless populations, which are fairly big segments of the population and likely to have higher rates of drug use. But NESARC also shares these limitations, so it doesn’t explain the difference seen in the surveys.

Here are some of the major changes to the NESARC:

  • The NESARC changed some questions from wave to wave, which could lead survey takers to respond differently.
  • In the 2001-’02 wave, NESARC respondents were not given monetary rewards. In the 2012-’13 wave, they were. That could have incentivized different people to respond.
  • No biological samples were collected in the first wave, while saliva samples were collected in the second. What’s more, respondents were notified of this at the start of the survey — which could have led them to respond differently, since they knew they’d be tested for their drug use.
  • Census Bureau workers were used for the 2001-’02 survey, but private workers were used for the 2012-’13 survey. That could lead to big differences: As Grucza told me, “Some researchers speculate that using government employees might suppress reporting of socially undesirable behaviors.”

The article continues,

Researchers from SAMHSA told me that they would caution against trying to use the different waves of NESARC to gauge trends.

“Given these points, we would strongly caution against using two points in time as an indicator in trend, especially when the data for these two points in time were collected using very different methods and do not appear to be comparable,” SAMHSA researchers wrote in an email. “We would encourage the consideration of data from multiple sources and more than two time points, in order to paint a more complete and accurate portrayal of substance use and substance use disorder in the nation.”

In short, it looks like the JAMA Psychiatry study was based on some fairly faulty data.

When I asked about these problems surrounding the study, lead author Bridget Grant, with NIAAA, shot back by email: “There were no changes in NESARC methodology between waves and NSDUH folks know nothing about the NESARC. Please do not contact me again as I don’t know NSDUH methodology and would not be so presumptuous to believe I did.”

But based on SAMHSA’s and Grucza’s separate reviews of NESARC, its methodology did change.

When I pressed on this, Grant again responded, “Please do NOT contact me again.”

After this article was published, Grant confirmed NESARC went through some methodological changes between 2001-’02 and 2012-’13. But she argued that there’s no evidence such changes would have a significant impact on the results.

It concludes,

None of that means America doesn’t have an alcohol problem. Between 2001 and 2015, the number of alcohol-induced deaths (those that involve direct health complications from alcohol, like liver cirrhosis) rose from about 20,000 to more than 33,000. Before the latest increases, an analysis of data from 2006 to 2010 by the Centers for Disease Control and Prevention (CDC) already estimated that alcohol is linked to 88,000 deaths a year — more than all drug overdose deaths combined.

And another study found that rates of heavy drinking and binge drinking increased in most US counties from 2005 to 2012, even as the percentage of people who drink any alcohol has remained relatively flat.

But for now, it’s hard to say if a massive increase in alcohol use disorder is behind the negative trends — because the evidence for that just isn’t reliable.

Migration and Terrorism

Image result for terrorist

A new study examines the link between immigrants and terrorism:

In our recent work (Dreher et al. 2017) we provide a detailed analysis of how the number of foreigners living in a country has affected the number of terrorist attacks made by foreigners on citizens of their host countries. According to the raw data, in OECD countries between 1980 and 2010, for every million foreigners in the population, 0.8 terror attacks are committed per year, per country (there were 662 transnational attacks). While it is obvious that the number of attacks increases with the number of people living in a country (after all, with no foreigners in a country, no foreigners would commit any attacks), on average these numbers amount to about one attack by foreigners per year and host country, and 1.3 people die from these attacks in the average country and year.

Transnational terror is dwarfed in absolute numbers by the number of attacks made by the domestic population. In the 20 OECD countries that our sample covers, there were 2,740 attacks arising from the domestic population. In relative terms though, the picture is different – there were fewer than 0.18 terrorist attacks for every one million locally born citizens in a typical country and year. Overall, while the probability that foreigners are involved in an attack on the domestic population was much higher than the risk that citizens were involved in attacks on their own country, the risk associated with each additional foreigner was tiny.

In our statistical analysis, we investigate whether, and to what extent, an increase in the foreign population of the average OECD country would increase the risk of terrorist attacks from foreigners in a host country. We identify exogenous variation in the number of foreigners living in an OECD country using changes in migration resulting from natural disasters. These changes affected host countries differently, according to the specifics of each host- and origin-country pair.

Using data for 20 OECD host countries, and 187 countries of origin between 1980 and 2010, we find that the number of terror attacks increased with the number of foreigners living in a host country. This scale effect that relates larger numbers of foreigners to more attacks does not imply, however, that foreigners are more likely to become terrorists than the domestic population. When we calculate the effect of a larger local population on the frequency of terror attacks by locals, the effect is of a comparable size. We conclude that, in this period, migrants were not more likely to become terrorists than the locals of the country in which they were living.

To put these results in perspective, consider the expected effect of a decrease in the domestic population of 0.0002% (which is the average decrease in the domestic population of the 20 OECD countries we studied in 2015, according to the OECD). According to our model, this would have reduced the number of terrorist attacks by 0.00025 per country and year. The increase in the stock of foreigners living in these countries was 3.6% in the same year. According to our estimates, this would have created 0.04 additional attacks. We might argue that this hardly justifies a ban on foreigners as a group.

We find little evidence that terror had been systematically imported from countries with large Muslim populations. The exceptions were Algeria and Iran, where we found a statistically higher risk of being involved in terrorist attacks against the local population, compared to the average effect of foreigners from non-Muslim countries. In this light, the phrases ‘Muslim terror’ or ‘Islamist terror’ does not seem accurate or useful. Only 6% of the terrorist attacks in the US between 1980 and 2005 period were carried out by Muslims, and less than 2% of all attacks in Europe had a religious motivation between 2009 and 2013 (Alnatour 2017).

I’ve written before about how European labor laws may play a role in radicalization. The authors make a similar case for immigration bans:

Contrary to the expectations of many politicians and pundits, introducing strict laws that regulate the integration and rights of migrants does not seem to have been effective in preventing terror attacks from foreign-born residents. We rather find that repressing migrants already living in the country with these laws has alienated a substantial share of this population, which increases the risk of terror. Stricter laws on immigration thus have the potential to increase the risk of terror, at least immediately following the ban.

…Our results illustrate an important trade-off. While stricter immigration laws could reduce the inflow of (violent) foreigners and thus potentially the number of future terrorist attacks, the restrictions would also increase the probability that those foreigners already living in the country become more violent. Immigration bans, like those recently introduced in the US, would arguably increase the short-term risk of attacks, before potentially reducing risk when the number of foreigners in the population has decreased.

Far-Right Terrorism

Last year, I linked to a Cato study on the likelihood of a foreign terrorist attack (TL;DR: it’s astronomically low). With Charlottesville in the news, this piece from Foreign Policy was particularly interesting:

Related imageThe FBI and the Department of Homeland Security in May warned that white supremacist groups had already carried out more attacks than any other domestic extremist group over the past 16 years and were likely to carry out more attacks over the next year, according to an intelligence bulletin obtained by Foreign Policy.

Even as President Donald Trump continues to resist calling out white supremacists for violence, federal law enforcement has made clear that it sees these types of domestic extremists as a severe threat. The report, dated May 10, says the FBI and DHS believe that members of the white supremacist movement “likely will continue to pose a threat of lethal violence over the next year.”

…The FBI…has already concluded that white supremacists, including neo-Nazi supporters and members of the Ku Klux Klan, are in fact responsible for the lion’s share of violent attacks among domestic extremist groups. White supremacists “were responsible for 49 homicides in 26 attacks from 2000 to 2016 … more than any other domestic extremist movement,” reads the joint intelligence bulletin.

The report, titled “White Supremacist Extremism Poses Persistent Threat of Lethal Violence,” was prepared by the FBI and DHS.

The bulletin’s numbers appear to correspond with outside estimates. An independent database compiled by the Investigative Fund at the Nation Institute found that between 2008 and 2016, far-right plots and attacks outnumbered Islamist incidents by almost 2 to 1.

Now, granted, when we consider that the Southern Poverty Law Center “estimates that [today] there are between 5,000 and 8,000 Klan members, split among dozens of different – and often warring – organizations that use the Klan name,” that’s a huge improvement over the 4 million in the mid-1920s. But I find it ironic that groups that worry about the influx of immigrants in part due to potential terror attacks are more likely to commit said attacks in recent years.[ref]Recent is important since Islamic terrorism still comes out on top when the last 3+ decades are considered. Either way, the chance of dying at the hands of a terrorist is still extremely small.[/ref]

Alcoholism on the Rise

From The Washington Post:

new study published in JAMA Psychiatry this month finds that the rate of alcohol use disorder, or what’s colloquially known as “alcoholism,” rose by a shocking 49 percent in the first decade of the 2000s. One in eight American adults, or 12.7 percent of the U.S. population, now meets diagnostic criteria for alcohol use disorder, according to the study.

The study’s authors characterize the findings as a serious and overlooked public health crisis, noting that alcoholism is a significant driver of mortality from a cornucopia of ailments: “fetal alcohol spectrum disorders, hypertension, cardiovascular diseases, stroke, liver cirrhosis, several types of cancer and infections, pancreatitis, type 2 diabetes, and various injuries.”

Indeed, the study’s findings are bolstered by the fact that deaths from a number of these conditions, particularly alcohol-related cirrhosis and hypertension, have risen concurrently over the study period. The Centers for Disease Control and Prevention estimates that 88,000 people a year die of alcohol-related causes, more than twice the annual death toll of opiate overdose.

…The study found that rates of alcoholism were higher among men (16.7 percent), Native Americans (16.6 percent), people below the poverty threshold (14.3 percent), and people living in the Midwest (14.8 percent). Stunningly, nearly 1 in 4 adults under age 30 (23.4 percent) met the diagnostic criteria for alcoholism.

…The study’s data go only through 2013. If the observed trend continues, the true rate of alcoholism today would be even higher.

How is “alcoholic” defined? The study defined “alcohol abuse” with the following criteria:

  • Recurrent use of alcohol resulting in a failure to fulfill major role obligations at work, school, or home (e.g., repeated absences or poor work performance related to alcohol use; alcohol-related absences, suspensions, or expulsions from school; neglect of children or household).

  • Recurrent alcohol use in situations in which it is physically hazardous (e.g., driving an automobile or operating a machine when impaired by alcohol use).

  • Recurrent alcohol-related legal problems (e.g., arrests for alcohol-related disorderly conduct).

  • Continued alcohol use despite having persistent or recurrent social or interpersonal problems caused or exacerbated by the effects of alcohol (e.g., arguments with spouse about consequences of intoxication).

And “alcohol dependence” by the following:

  • Need for markedly increased amounts of alcohol to achieve intoxication or desired effect; or markedly diminished effect with continued use of the same amount of alcohol.

  • The characteristic withdrawal syndrome for alcohol; or drinking (or using a closely related substance) to relieve or avoid withdrawal symptoms.

  • Drinking in larger amounts or over a longer period than intended.

  • Persistent desire or one or more unsuccessful efforts to cut down or control drinking.

  • Important social, occupational, or recreational activities given up or reduced because of drinking.

  • A great deal of time spent in activities necessary to obtain, to use, or to recover from the effects of drinking.

  • Continued drinking despite knowledge of having a persistent or recurrent physical or psychological problem that is likely to be caused or exacerbated by drinking.

Why the rise?

“I think the increases are due to stress and despair and the use of alcohol as a coping mechanism,” said the study’s lead author, Bridget Grant, a researcher at the National Institutes of Health. The study notes that the increases in alcohol use disorder were “much greater among minorities than among white individuals,” likely reflecting widening social inequalities after the 2008 recession.