Breaking News: Communism Makes People Worse Off

From a recent study:

Our bivariate analyses show that the recent cultural factors examined—communist history and religion—are, taken alone, good predictors of the Human Development Index and its components (table 1). When incorporated alongside phylogeny and geography, phylogeny ceases to be a significant predictor of HDI or any of its components, meaning recent cultural factors combined with geography can account for covariation between HDI and cultural phylogeny (table 3). Communism significantly negatively predicts HDI, income and health indices, but religion ceases to be a significant predictor except for a negative correlation between Islam and education index. These results support a significant effect of communist history on the human development of countries, comparable to the effects of geography (which remains a significant predictor of HDI and income index), and more immediately important than cultural phylogeny or religion.

…Communist history shows a significant negative correlation with the national income of the countries in our dataset. Post World War II economic growth in communist countries was modest, especially during the 1970s and 1980s, relative to non-communist European countries [92], and the centrally planned economy of communist countries has long been held by economically liberal theoreticians to hamper conventional economic growth [9395]. Although the countries in the dataset had abandoned communism for most of the years in the dataset, the residual effect of communism appears to still be detectable. Institutional and cultural traits produced by communism and by dictatorship may continue to retard growth today, with corruption still regarded as higher in Eastern than Western Europe [96] and linked to lower national income [97]. It should also be noted, however, that many of the former communist countries (largely those in the former Soviet Union) also suffered major economic turmoil following the demise of their communist governments [98], and that this too may play a role in explaining the apparent effect of communism on income. Moreover, it must be noted that the communist countries in the sample are all Eastern European and Central Asian, and that these areas were less wealthy than Western Europe even prior to communism [92,99], and indeed Russia saw rapid economic growth following the advent of communism, although this lessened over time [92,100]. For all these reasons the results presented here must be treated with caution, and are primarily intended as a control in the context of examination of deep cultural effects on human development, not as a thoroughgoing analysis of the effects of communism on development.

Communism also shows a significant negative association with health index (i.e. normalized longevity), although only at p = 0.05 level. This confirms the stagnation and even decline of life expectancy in Europe under communism during the 1970s and 1980s, corresponding to years of low economic growth (see above), which has continued to set formerly communist countries back in terms of life expectancy until today [101,102]. The proximate causes for this low life expectancy are complex, but high alcohol consumption, smoking and poor workplace safety, as well as low quality diet and living conditions associated with lower income levels are implicated [101]. Most of the same caveats also apply here as to the economic effects of communism however, with lifespan decreasing rapidly in the former Soviet Union immediately following post-Soviet collapse [101], and lifespan having increased strongly in the Soviet Union prior to and immediately after World War II [103].

Longevity greatly increased during recent centuries in Europe in part due to generally rising living standards (and thereby nutrition [104]), with increasing health and longevity interacting with the economy in a positive feedback loop [105]. Communist history may thus have also influenced longevity via its effect on income, with income being a significant predictor of health index (electronic supplementary material, table S1). Consistent with this explanation, we find that communism is no longer a significant predictor of health index when controlling for income index.

Communism lowers human well-being. Who knew?[ref]There’s more to the study (such as Islam’s negative correlation with education), but this jumped out at me.[/ref]

Image result for wow black guy gif

What Are the Economic Gains from International Trade?

Reporting on a recent working paper, the April 2018 NBER Digest summarizes,

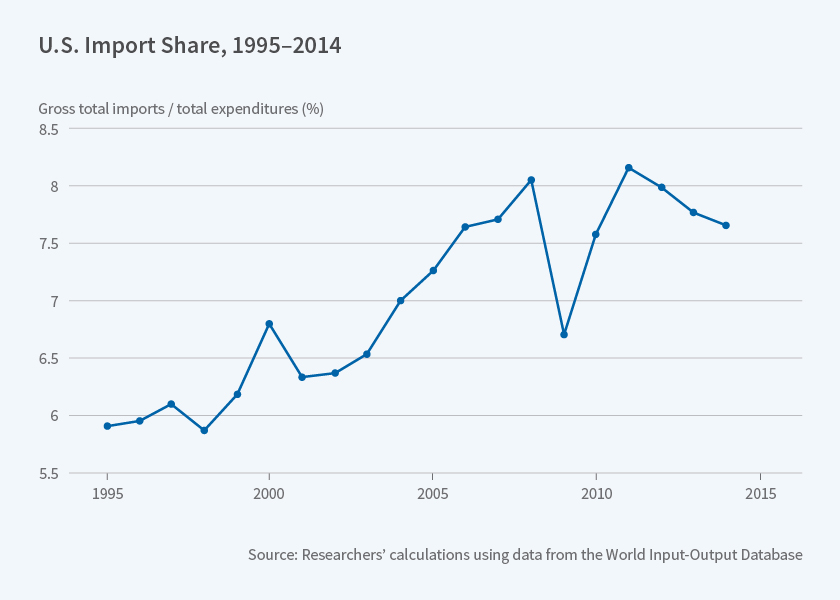
 There is surprisingly little direct quantitative evidence on how the U.S. economy would react if the door were shut on trade. To find a precedent, the researchers point out that one could go back to the Embargo Act of 1807, when the United States banned trade with Great Britain and France in retaliation for their repeated violations of U.S. neutrality. GDP declined sharply, but the agrarian world during the presidency of Thomas Jefferson bears little resemblance to today’s high-tech, service-oriented economy.

…To simplify the analysis, they elect to focus on trade in factor services, namely the labor and capital embedded in goods purchased from around the world. They then estimate the gains from trade by comparing the size of a counterfactual U.S. economy that depends entirely on domestic resources with one that has access to foreign factor services through international trade.

…The researchers do not offer a single estimate of the gains to the U.S. economy from international trade, but they suggest that the reasonable range falls between 2 and 8 percent of GDP. They acknowledge that while foreign trade raises the level of economic output, not everyone is a winner. Consumers enjoy lower prices, but some workers may see that benefit offset by declining wages or layoffs.

Not too shabby.

Related image

Would You Give Up Your Right to Vote for a Pay Raise?

Image result for vote

Over a third of Americans would for an immediate 10% annual raise, according to a new survey. Here are the results in full:

    • 40.06% would give up dental care for the next five years
    • 12.2% would break up with their partner or significant other
    • 53.55% would give up all social media accounts for the next five years
    • 88.61% would give up watching Game of Thrones for life
    • 43.86% would give up exercise for the next five years
    • 34.98% would give up the right to vote in all elections for life
    • 9.13% would give up their child’s or future child’s right to vote in all elections for life
    • 73.42% would give up all alcoholic beverages for the next five years
    • 17.93% would give up Social Security benefits for the next two years
    • ​18.9% would give up access to health insurance for the next five years
    • 50.65% would give up watching movies for the next three years
    • 55.9% would work an extra 10 hours per week for life
    • 15.27% would give up all of their vacation days for the next five years
    • 47.74% would give up all caffeinated products for the next two years
    • 50.4% would work one day every weekend for the next year
  • 5.33% would eat a single tide pod

Why would people give up this right? Because they have every incentive to do so. As explained by Jason Brennan,

There is some debate among economists and political scientists over the precise way to calculate the probability that a vote will be decisive. Nevertheless, they generally agree that the probability that the modal individual voter in a typical election will break a tie is small, so small that the expected benefit (i.e., p[V(D)V(R)]p[V(D)−V(R)]) of the modal vote for a good candidate is worth far less than a millionth of a penny (G. Brennan and Lomasky 1993: 56–7, 119). The most optimistic estimate in the literature claims that in a presidential election, an American voter could have as high as a 1 in 10 million chance of breaking a tie, but only if that voter lives in one of three or four “swing states,” and only if she votes for a major-party candidate (Edlin, Gelman, and Kaplan 2007).[ref]On average, a voter has a 1-in-60 million chance of changing the outcome of a presidential election.[/ref] Thus, on both of these popular models, for most voters in most elections, voting for the purpose of trying to change the outcome is irrational. The expected costs exceed the expected benefits by many orders of magnitude.

Consider the following costs:

[S]uppose my favored candidate (who is worth $33 billion more to the common good) enjoys a slight lead in the polls. She has a very small anticipated proportional majority. The probability that any random voter will vote for her is 50.5 percent. This is an election we would describe as “too close to call.” Suppose also that the number of voters will be the same as in the 2004 U.S. presidential election: 122,293,332. I vote for my favored candidate. In this case, the expected value (for the common good) of my vote for the better candidate is $4.77 x 10^-2650 , that is, approximately zero. Even if the candidate were worth $33 billion to me personally, the expected value for me of my vote would be, again, a mere $4.77 x 10^-2650 . That is 2,648 orders of magnitude less than a penny. In comparison, the nucleus of an atom, in meters, is about 15 orders of magnitude shorter than I am. In meters, I am about 26 orders of magnitude shorter than the diameter of the visible universe. In pounds, I am about 28 orders of magnitude less heavy than the sun. Even if the value of my favored candidate to me were dramatically higher, say ten thousand million trillion dollars, the expected value of my vote in our example—for a close election—remains thousands of orders of magnitude below a penny. For an election in which the candidate has a sizable lead, the expected utility of an individual vote for a good candidate drops to almost zero.

The Beneficence Argument appeals to the public utility of individual acts of voting. However, suppose all you care about is maximizing your contribution to the common good. If so, voting would not merely fail to be worthwhile— it would be counterproductive. It turns out that the expected disutility of driving to the polling station (in terms of the harm a driver might cause to others) is higher than the expected utility of a good vote. This is not hyperbole.

Aaron Edlin and Pinar Karaca-Mandic have estimated the expected accident externalities per driver per year in the United States—that is, the amount of damage the average driver imposes on others from accidents and reckless driving. The expected accident externalities range from as little as $10 in low-traffic-density North Dakota to more than $1,725 in high-traffic-density California. Suppose a North Dakotan takes five minutes to drive to the polling station. The average expected accident externality of a five-minute drive in North Dakota is $9.5 x 10^-5 , much larger than the expected benefit of a good vote in the previous example. So the voter imposes greater expected harm on her way to the polls than she could compensate for by a good vote.[ref]Jason Brennan, The Ethics of Voting, pgs. 19-20.[/ref]

Can’t say I blame people.

The Economic Impact of Immigration: UK Edition

Image result for brexit

Economist Jonathan Portes has an excellent summary of the research on immigration’s effects in the UK:

  • Employment: “To the considerable surprise of many economists, including me, there is now a clear consensus that even in the short-term migration does not appear to have had a negative impact on the employment outcomes of UK natives. Studies have generally failed to find any significant association between migration flows and changes in employment or unemployment for natives (see, for example, BIS 2014 for a review).  Since 2014, the continued buoyant performance of the UK labour market has further reinforced this consensus. Rapid falls in unemployment, now down to just over 4%, have been combined with sustained high levels of immigration. Nor is there any evidence that immigration has impacted the employment prospects of specific groups such as the young or unskilled. Crudely, immigrants are not taking our jobs – the lump of labour fallacy, that the number of jobs or vacancies in the economy is fixed (which generally refers to the medium to long term) turns out to be a fallacy in the short term as well.”
  • Wages: “While the evidence on wage impacts is less conclusive, the emerging consensus is that recent migration has had little or no impact overall, but possibly some, small, negative impact on low-skilled workers. Dustmann et al. (2013), using UK LFS data for the period 1997-2005, find that immigration put a downward pressure on the wages at the bottom of the distribution (below the 20th percentile), while the effect on the rest of the distribution (in particular above 40th percentile) is positive. Their estimates show that a 1% increase in the foreign-born/native population ratio leads to an increase of between 0.1% and 0.3% in average wages.”
  • Productivity: “Immigrants’ skills may complement those of natives.  A number of papers support this hypothesis: for example, Barone and Moretti (2011) found that low-skilled migration increased the labour force participation of highly skilled native women; Peri and Sparber (2009) and Foged and Peri (2016) found that low-skilled migration increased the wages of native low skilled workers.  In particular, they argue that natives may have a comparative advantage in jobs with more communication-intensive tasks with respect to foreign workers, and that immigration ‘pushes’ low-skilled natives to occupations with a higher intensity of such skills, increasing the level of specialisation in the economy and hence productivity, as signalled by the corresponding increase in wages. Immigration might also influence the level of human capital in the economy, either directly if immigrants have high educational attainment (Kerr and Lincoln 2010, Hunt and Gauthier-Loiselle 2010), or indirectly by increasing the incentive on natives to acquire human capital. Some evidence (Hunt 2017, McHenry 2015) suggests that increased low-skilled immigration increase school performance and outcomes for US natives…Looking at the service sector, Ottaviano et al. (2015) show that a 1% increase in immigrants’ concentration in local labour markets is associated with a 2% to 3% rise in labour productivity, measured as gross value added per worker, mainly as a result of the cost-cutting dynamics implied by immigration-induced labour supply shocks. In addition, immigration represents a substitute for the import of intermediate inputs and is associated with an increase in exports to immigrants’ countries of origin.   Rolfe et al. (2013) found that immigrants concentration within specific industries was associated with slight increases in productivity, but the impact was small. At the aggregate level, recent literature uses cross-country evidence to estimate the impact of migration on growth and productivity in advanced economies. Boubtane et al. (2015) find that migration in general boosts productivity in advanced economies, but by varying amounts; for the UK, the estimated impact is that a 1 percentage point in the migrant share of the working age population leads to a 0.4-0.5% increase in productivity. This is higher than in most other advanced economies and reflects the relatively high skill levels of migrants to the UK. Jaumotte et al. (2016) find that a 1% increase in the migrant share of the adult population results in an increase in GDP per capita and productivity of approximately 2%. This result is consistent across a variety of empirical specifications.  Perhaps surprisingly, the estimated aggregate impacts of high and low skilled migration are not significantly different (although the distributional implications are very different). In a within-country perspective, Peri (2012), with a state-based analysis in US, finds that a 1% increase in immigration raises total factor productivity by 0.5%, mainly thanks to increased specialisation induced by immigrants’ inflows.”
  • Fiscal: “Dustmann and Frattini (2014) found that recent migrants, especially those from the EU, had a more positive fiscal impact on average than natives.  Of course, it is hardly surprising that young migrants in employment make an initial positive fiscal contribution; proper assessment of fiscal impacts requires a life-cycle perspective (Preston 2014).   In this context, there are various reasons to expect the impact to still be positive (in particular, migrants tend to arrive after they have left compulsory, publicly financed education). However, a positive net impact on public finances at the national level does not preclude a significant impact on demand (and hence cost) at the local level, particularly if funding allocations do not adjust quickly (or at all) to reflect pressures resulting from migration (George et al. 2011). A notable recent example is the shortage of primary school places in some parts of the UK (especially London); this appears to be largely the result of poor planning on the part of central government, given the rise in the number of young children resulting from recent increases in migration (from both the EU and elsewhere). But broader concerns about the potential negative impacts on public services appear to be largely unsubstantiated: higher immigration are not associated, at a local level, with longer NHS waiting times (Giuntella et al. 2015); and in schools, increased numbers of pupils with English as a second language doesn’t have any negative impact on levels of achievement for native English speaking students (Geay et al. 2013). If anything, pupils in schools with lots of non-native speakers do slightly better.”
  • Prices: “Frattini (2008) analyses the impact on tradable, non-tradable goods and services prices across UK regions over the period 1995-2006 and shows that immigration is associated with a fall in prices for non-tradeable goods and services, but a rise in the price of tradeables.  Sá (2015) focuses on the impact on housing prices in UK local authorities from 2003 to 2010 and shows that immigration actually reduces house prices at a local level, since natives leave the area in response to high immigrant inflows; although this does not imply, of course, that immigration does not overall exert upward pressure on house prices at a national level.”

So what are the likely results of Brexit? He concludes,

The conclusion is that the reductions in migration resulting from Brexit are likely to have a significant adverse impact on UK productivity and GDP per capita. The broad scenarios (not forecasts) we depict imply that the negative impacts on per capita GDP will be significant, potentially approaching those resulting from reduced trade.  By contrast, the increase in low-skilled wages resulting from reduced migration is expected to be, if at all, relatively modest.

Simonian Economics

Image result for julian simon

A few years ago, I had a post about the Simon-Ehrlich wager in which economist Julian Simon won his bet against professional fearmonger Paul Ehrlich (who still won’t shut up). The evidence continues to mount that Simon was correct. Recently GMU economist Bryan Caplan reported on his own Simonian bet with Tyler Cowen and David Balan. “In July of 2008,” he writes, “the average U.S. price of regular gasoline was $4.062.” He bet “$100, even odds, that the U.S. price of gas (including taxes) in the first week of January, 2018 will be $3.00 or less in 2008 dollars.”

A subsequent clarification specified that the bet was on the price of regular gasoline.

Today, the January CPI arrived, allowing us to finally resolve this ten-year bet.  In 2008, the US CPI stood at 215.3.  In the third quarter of 2017, it hit 244.7.  Since then, there has been further inflation of 0.3%, bringing us to 245.3, for a grand total of 13.9% inflation during this period.  For me to win, then, the average price of regular gasoline in January 2017 must be less than $3.417.

So where are we now?  In January of 2018, the average price was a mere $2.555.  I have therefore won this bet by a margin of over 25%.  (Indeed, even if we count all gasoline, the average price is only $2.671).  I would have prevailed if there’d been 0% inflation – or as much as 14% cumulative deflation.

…For as long as we’ve had data, gas prices have shown frequent spikes, followed by gradual declines back to long-run trend.  So when prices spiked to over $4.00, I expected the past to repeat itself.  And repeat itself it did.

I expect that Tyler will insist that I just got lucky.  And if I lost roughly half my bets, that would be a wise reaction.  However, this latest victory brings my betting record to 17 wins and 0 losses.  Yes, pride goeth before the fall.  There’s at least one outstanding bet that I now expect to lose.  Still, the only reasonable explanation for my 17-and-0 record is that my judgment is exceptionally good.

As always, my opponents have my respect – and deserve yours.  They stuck out their necks and made clear claims.  If every pundit would do the same, this would be a far better – and far quieter – world.

Are Most Millennials Pro-Gun Control?

Not really. From Reason,

Image result for enough time magazineCNN ran an article detailing how student activists “led” the Washington, D.C., March for Our Lives rally on Saturday, downplaying the heavy organizational support they received from adult gun control advocates. Recent survey data show that only 10 percent of rally attendees were under 18 and the average age of the adults present was 49. And while most of the press coverage has implied that young people are overwhelmingly in favor of more gun control, comments from actual young people suggest their views are not quite so monolithic.

…A 2015 Pew poll[ref]A more recent poll finds that 58% of 18-to-29-year-olds want to “control gun ownership” (which is vaguer than “assault weapons ban”) as of April 2017. This is the highest it has been since 2009, though there appears to be an overall downward trend in this age group since 1993. See Pew’s 2017 study on gun demographics here. Also, check this out from Vox.[/ref] found that only 49 percent of 18-to-29-year-olds favored an “assault weapons” ban, compared to 55 percent of those aged 30 to 49 and 63 percent of those 65 or older. A March 6 Quinnipiac poll, taken several weeks after the Parkland shooting, found that only 46 percent of 18-to-34 year olds support an assault weapons ban, rising to 51 percent for those aged 35 to 49, 68 percent for those aged 50-to-64, and 80 percent for those over 65.

…Millennials who support the Second Amendment are themselves surprised at the pro-gun leanings of their peers. When an NPR reporter cited polling data indicating that young people tend to be skeptical of gun control, 19-year-old gun rights activist Abigail Kaye responded, “That’s surprising, because I feel like we’re a more progressive generation…We’ve grown up more, I think, with this kind of gun violence, so you’d think maybe we’d push for more regulations.”

No wonder she’s surprised. Contrary to the impression left by most of the press coverage, the gun control battle is being fought within generational cohorts, not just between them.

A slightly different picture than one might suppose given recent events.

Does Diversity Lead to Distrust?

My article on the LDS Church and immigration should be out–hopefully by the end of the month–in the next issue of BYU Studies Quarterly. In it, I tackle five common objections to immigration:

  • Immigrants “steal” native jobs.
  • Immigrants depress native wages.
  • Immigrants undermine host country culture and institutions.
  • Immigrants are a fiscal burden and increase the welfare state.
  • Immigrants are criminals and terrorists.

But one objection that is gaining more steam is that diversity leads to distrust. This isn’t without some empirical backing (though this is likely unknown to most of those making the argument). According Bloomberg‘s Noah Smith, famed political scientist Robert Putnam found evidence over a decade ago that ethnic diversity via immigration leads to a decrease in trust (social capital).[ref]A later analysis of Putnam’s study found that it was only white people whose trust decreased.[/ref] Smith continues,

Image result for distrustPutnam isn’t alone in his finding — studies in Denmark, the United Kingdom, the Netherlands, and Europe have found similar results.

But this doesn’t mean that it’s a scientific fact that diversity decreases trust. There are plenty of studies that don’t support Putnam’s conclusion — or even find the opposite. For example, another study in the UK found no correlation between diversity and trust, while a third found that the negative relationship disappears after controlling for economic variables. Another Europe-wide study found no correlation, while yet another found that diversity is actually associated with a long-term increase in trust.

A casual look at international survey measures will show that — as [Megan] McArdle notes — ethnic homogeneity is no guarantee of a trusting society. Among rich countries, Scandinavia is the most trusting region, but diverse, immigrant-friendly places like Canada, Australia, New Zealand and Singapore actually score higher than homogeneous, low-immigration countries like South Korea, Russia, Japan and Poland…What’s more, even if diversity does decrease trust, the effect might not be that strong. Economist Bryan Caplan examined Putnam’s research and found that even if the sociologist’s numbers are completely correct, huge changes in diversity would reduce measures of trust only by a few percent.

An economist would also note that aside from simply asking people survey questions, researchers should look at how people actually behave. Ethnic diversity in Southern California has been linked to lower crime and higher home values. Studies reliably find that immigration reduces crime in the U.S., and this also appears to be true in Canada. Meanwhile, recent evidence on migration patterns show that Americans have tended to move to diverse neighborhoods since around 1990 — voting with their feet rather than their survey answers.

Furthermore, there is “a theory that prolonged, positive contact with people of other races reduces racial tensions. This “contact hypothesis” has plenty of support in the literature — studies show that having college dorm-mates of a different race, or serving in an integrated military, reduces discrimination. This suggests that over the long term, diverse neighborhoods will have a positive impact on society-wide trust. A recent survey of 90 papers found…[that] an increase in diversity might initially cause people to avoid interacting with their strange new neighbors, [but] over the long term it makes them realize that people of other races aren’t so scary after all.” Elsewhere, Smith points to research that

seems to show that Americans are increasingly open to living in diverse neighborhoods. A 2016 paper by the National University of Singapore’s Kwan Ok Lee finds that since 1990, white flight and white avoidance of black neighborhoods has decreased dramatically. In fact, white Americans in recent decades have tended to move toward diversity rather than away from it.

Urban economist Joe Cortright, blogging at City Observatory, summarizes the results. Lee looks at U.S. Census tracts, neighborhoods that on average have about 4,000 residents. In addition to the racial makeup of neighborhoods, she was able to track where individuals moved to and from.

Lee’s first finding is that American neighborhoods are becoming more diverse. Majority-white neighborhoods were about two-thirds of the total from 1970 to 1990, but during the next two decades that number was only 57 percent. The probability of single-race neighborhoods becoming mixed increased substantially. Meanwhile, a small but growing number of neighborhoods have a substantial numbers of whites, blacks and Hispanics or Asians.

…From 1990 to 2010, only one-fifth of mixed black-white neighborhoods became segregated — only half the rate of re-segregation that prevailed in earlier decades. White flight is still happening in some places, but much less than before. Meanwhile, multiracial neighborhoods tend to be the most stable — once a neighborhood becomes multiracial, Lee found that it had a 90 percent chance of remaining that way for at least 20 years.

Lee’s final finding is the most striking. She found that once Americans move to a mixed-race neighborhood, they tend to either stay there, or move to another mixed neighborhood. This is true for both white and black Americans. In other words, neighborhood diversity isn’t just a result of changing demographics, but of Americans choosing to live near people of other races.

Lee’s finding confirms the results of other studies. Despite much alarm over gentrification, it turns out that gentrified neighborhoods don’t lose their poor and minority populations. According to a 2009 study by Columbia University urban planning professor Lance Freeman, gentrification actually tends to increase diversity in the long term.

What about at the state level? There, diversity is increasing as well. Demographer William H. Frey has chronicled how both whites and minorities have been moving to diverse states like Virginia, Nevada, North Carolina, Colorado, Georgia and Washington. Texas, a majority-minority state, is still a leading destination for white migration.

Residential diversity isn’t the only kind of integration, of course. On other measures, the evidence is mixed — interracial marriage has climbed dramatically, but public schools have become more segregated by race. Meanwhile, the average numbers described in studies like Lee’s and Freeman’s mask considerable white flight in some areas.

And the most important caveat is the political one. Fear of increasing diversity at the national level was strongly correlated with support for President Donald Trump. Even if a majority of Americans are embracing the country’s increasingly diverse demographics, a strong and vocal minority is resisting the change with every weapon at its disposal.

Regarding this last point, I write in my upcoming paper,

A particularly interesting aspect of public attitudes toward immigration is that of political ignorance. Multiple studies have shown that political ignorance is rampant among average voters, and this holds true when it comes to immigration policy. As legal scholar Ilya Somin explains, “Immigration restriction . . . is one that has long-standing associations with political ignorance. In both the United States and Europe, survey data suggest that it is strongly correlated with overestimation of the proportion of immigrants in the population, lack of sophistication in making judgments about the economic costs and benefits of immigration, and general xenophobic attitudes toward foreigners. By contrast, studies show that there is little correlation between opposition to immigration and exposure to labor market competition from recent immigrants.” One pair of economists found that those voting to leave the European Union in the Brexit referendum, who were motivated largely by a desire to restrict immigration, “were overwhelmingly more likely to live in areas with very low levels of migration.” Similarly, voters who supported Donald Trump during the US election were more likely to oppose liberalizing immigration laws (even compared to other Republicans), but least likely to live in racially diverse neighborhoods. In short, both political ignorance and lack of interaction with foreigners tend to inflame anti-immigration sentiments. These sentiments are what George Mason University economist Bryan Caplan refers to as antiforeign bias: “a tendency to underestimate the economic benefits of interaction with foreigners.” In fact, economists take nearly the opposite view from the general public on immigration.

Does an Increase in the Minimum Wage Decrease Teen Employment?

Image result for teenagers unemployed

Yes, according to previous research and according to a new working paper out of GMU’s Mercatus Center.[ref]Which has published other good work on the effects of the minimum wage.[/ref] The authors report,

First, we sought to understand the sources of the decline in teen employment that began around 2000—in particular, the decline in employment among those age 16–17—as well as, more generally, changes in teen employment and school enrollment behavior. Second, we wanted to explore the implications of these changes for human capital, given that the decline in employment consisted of fewer teens in school and employed, and more teens in school exclusively, suggesting a greater focus on schooling. We have considered three explanatory factors: (1) a rising minimum wage that could reduce employment opportunities for teens and potentially also increase the value of investing in schooling; (2) rising returns to schooling; and (3) increasing competition from immigrants that, like the minimum wage, could reduce employment opportunities but also raise the returns to human capital investment. 

With respect to the first question, we find some evidence of the expected effects of all three explanatory factors on teen employment and school enrollment—and in particular for those age 16–17. However, in terms of explaining changes in the behavior of teens age 16–17 since 2000, the role of the minimum wage is predominant. Increases in the returns to schooling appear to have played almost no role, and immigrant competition a minor role. In contrast, our simulation results suggest that minimum wages explain about a quarter of the shift, since 2000, from being simultaneously employed and enrolled in school to being exclusively enrolled in school.

Turning to the second question, our examination of the longer-term effects of these three factors uncovers no evidence that higher minimum wages, which underlie teens shifting from combining work and schooling to being in school exclusively, led to greater human capital investment. If anything, the evidence is in the other direction. Thus, it is more likely that the principal effect of higher minimum wages in the 2000s, in terms of human capital, was to reduce employment opportunities that could enhance labor market experience. Further, we find no evidence of net-positive human capital effects of rising returns to schooling or increased immigration in this period, even though these latter two factors—more so immigration—played at least a minor role in the changes in teen employment and school enrollment.

Based on this evidence, then, it appears that the changes in teen labor market and schooling behavior since 2000—stemming in part from adverse effects of minimum wages on employment opportunities, and to a lesser extent from immigration—did not reflect greater human capital investment that would raise future earnings. It is not clear that immigration delivered any other short-term benefits to teens. In contrast, some teens surely benefited directly in the short run from higher minimum wages. But there appear to have been either no effects or adverse effects on longer-run earnings for those exposed to these higher minimum wages as teenagers (pgs. 47-48).

New RAND Report: Gun Control

From Vox,

RAND’s extensive report does not make any sweeping declarations about gun policy. It does, however, make clear that gun control research is very limited, calling on Congress to lift the NRA-backed funding freeze. It argues that this freeze has, by making it difficult to conduct better studies, led to a confusing empirical environment, where it’s easy for groups on both sides of the debate to cite shoddy work that supports their prior beliefs.

“The studies that have been done often reach opposite conclusions to each other,” Andrew Morral, the head of RAND’s gun policy initiative, told me. The lack of thorough research, he added, “creates this kind of fact-free environment in which people can cherry-pick any study that happens to support what their priors are on the effects of the law.”

Morral’s team spent two years reviewing US-based studies published over the past several decades, pulling out the most rigorous to try to find some “incontrovertible truths.” RAND concluded that, first and foremost, far more research is necessary. “Many of the matters that people disagree on when they disagree on gun policy have not been rigorously studied in ways that produce reasonably unambiguous results,” Morral said.

But there were some things that could be gleaned from the available evidence. While RAND as a nonpartisan group avoided any sweeping policy conclusions in its analysis, its review does seem to point in a direction, based on my own reading: More permissive gun policies lead to more gun deaths, while more restrictive policies lead to fewer gun deaths. Coupled with other evidence in this area, that supports the idea that more guns lead to more gun deaths.

A chart, based on RAND data, looking at the studied outcomes of different gun policies.

Vox summarizes,

On the gun control front, there’s moderate evidence that background checks reduce suicide and violent crime, limited evidence that prohibitions associated with mental illness reduce suicide, moderate evidence that those prohibitions reduce violent crime, and supportive evidence that child-access prevention laws reduce suicides and unintentional injuries and deaths.

Meanwhile, there’s limited evidence that concealed carry laws increase violent crime and unintentional injuries and deaths. And there’s moderate evidence that “stand your ground” laws — NRA-backed measures that expand when someone can use a gun or other weapons to defend himself — increase violent crime.

If you put this all together, it suggests that restrictive laws seem to lead to fewer gun deaths, while the permissive laws seem to lead to more gun deaths.

…The think tank found supportive evidence for child access prevention laws reducing suicide and unintentional injuries and deaths. And Morral agreed that the evidence is stronger on background checks and prohibitions associated with mental illness than other gun policies.

As for the correlation between gun availability and gun deaths, “RAND takes a more skeptical view. The report argued that it can be hard to disentangle the relationship between more guns and more gun deaths: Is it the abundance of guns leading to more gun deaths, or are people seeing a lot of violence in their communities and reacting to it by stocking up on guns to protect themselves? RAND concluded that there’s just not enough in the research it reviewed to solve this chicken-or-egg scenario.” In short, “more research is needed…Federal funding could go to surveys and on-the-ground research that could help address the gaps. The funding is something, however, that pro-gun groups like the NRA have worked against for years. And so far, their tactics have worked — keeping the federal freeze in place. So although there’s evidence that some gun control measures could work, we by and large remain blind to what specific solutions would work best and what all of their effects would be.”

Does Government Stimulus Actually Stimulate?

Image result for government spendingIn an interview in the Regional Economist, St. Louis Fed Assistant Vice President Bill Dupor lays out the competing views of economists:

According to one view, purchases by the government cause a chain reaction of spending. That is, when the government buys $1 worth of goods and services, people who receive that $1 will save some of the money and spend the rest, and so on. This theory suggests that the “government spending multiplier” is greater than 1, meaning that the government’s spending of $1 leads to an increase in gross domestic product (GDP) of more than $1.

The other view suggests that government spending may “crowd out” economic activity in the private sector. For example, government spending might be used to hire workers who would otherwise be employed in the private sector. As another example, if the government pays for its purchases by issuing debt, that debt could lead to a reduction in private investment (due to an increase in interest rates). In this case, the $1 increase in government spending leads to an increase in GDP of less than $1 because of the decline in private investment. Therefore, the government spending multiplier is less than 1.

His own research

examined the impact of defense spending on the U.S. economy in the post-World War II period. Our results suggest that the multiplier is less than 1, meaning that the government spending causes some crowding out of private economic activity. In particular, we found that an additional $1 in defense spending leads to a reduction of about 50 cents from some other part of the economy.

He also “studied the effects of the American Recovery and Reinvestment Act of 2009, with a primary focus on employment. My general finding is that the government was able to create jobs but at a fairly expensive cost. For example, in one study I worked on, I found that creating a job lasting one year cost the government about $100,000, whereas the median compensation for a U.S. worker was roughly $40,000.” In short, “government spending does not seem to be a very cost-effective way to stimulate the economy and create jobs. However, economists have a lot more to learn on this topic.”