What Motivates Support for Redistribution?

When it comes to the motivations behind redistribution, it turns out that fairness has little to do with it. Instead, researchers find[ref]Full access here.[/ref] that compassion, envy, and self-interest are the main drivers. From the abstract:

Why do people support economic redistribution? Hypotheses include inequity aversion, a moral sense that inequality is intrinsically unfair, and cultural explanations such as exposure to and assimilation of culturally transmitted ideologies. However, humans have been interacting with worse-off and better-off individuals over evolutionary time, and our motivational systems may have been naturally selected to navigate the opportunities and challenges posed by such recurrent interactions. We hypothesize that modern redistribution is perceived as an ancestral scene involving three notional players: the needy other, the better-off other, and the actor herself. We explore how three motivational systems—compassion, self-interest, and envy—guide responses to the needy other and the better-off other, and how they pattern responses to redistribution. Data from the United States, the United Kingdom, India, and Israel support this model. Endorsement of redistribution is independently predicted by dispositional compassion, dispositional envy, and the expectation of personal gain from redistribution. By contrast, a taste for fairness, in the sense of (i) universality in the application of laws and standards, or (ii) low variance in group-level payoffs, fails to predict attitudes about redistribution.

Let’s dive into the details:

We conducted 13 studies with 6,024 participants in four countries to test the hypothesis that compassion, envy, and self-interest jointly predict support for redistribution. Participants completed instruments measuring their (i) support for redistribution; (ii) dispositional compassion; (iii) dispositional envy; (iv) expected personal gain or loss from redistribution (our measure of self-interest); (v) political party identification; (vi) aid given personally to the poor; (vii) wealthy-harming preferences; (viii) endorsement of procedural fairness; (ix) endorsement of distributional fairness; (x) age; (xi) gender; and (xii) socioeconomic status (SES) (pg. 8422).

The results?:

Image result for greed fullmetal alchemistTo test this prediction, we regressed participants’ support for redistribution simultaneously on their dispositional compassion, their dispositional envy, and their expected personal gain (or loss) from redistribution. As predicted, the three motives have positive, significant, and independent effects on support for redistribution. This is true in the four countries tested: the United States (US) (study 1a), India (IN) (study 1b), the United Kingdom (GB) (study 1c), and Israel (IL) (study 1d)—standardized regression coefficients (β values): compassion, 0.28–0.39; envy, 0.10–0.14; self-interest, 0.18–0.30. Jointly, these motives account for 13–28% of the variance in support for redistribution. Adding to the regression models age and gender, or age, gender, and S[ocio]E[conomic]S[tatus], does not appreciably alter the effect of the emotion/motivation triplet, or the total variance accounted for. We note that age did not have significant effects in any country. Gender had significant effects in the United States and the United Kingdom (females more opposed to redistribution), but not in India or Israel. SES had a significant (negative) effect in the United Kingdom, but not in the other countries (Ibid.).

Unsurprisingly, in the U.S. “self-described Democrats endorsed redistribution to a greater extent than Republicans and Libertarians did. Democrats also reported more compassion and more expected personal gain from redistribution than Republicans and Libertarians did; envy did not differ by party” (Ibid.). Interestingly enough, “dispositional compassion was the only reliable predictor of giving aid to the poor” in all four countries. However, “support for government redistribution was not a unique predictor of personally aiding the poor in the regressions…Support for government redistribution is not aiding the needy writ large—in the United States, data from the General Social Survey indicate that support for redistribution is associated with lower charitable contributions to religious and nonreligious causes” (Ibid.).

Image result for compassion fullmetal alchemist
Compassion

Now consider these absurd answers from the survey respondents:

Related imageParticipants in the United States, India, and the United Kingdom (studies 1a–c) were given two hypothetical scenarios and asked to indicate their preferred one. In one scenario, the wealthy pay an additional 10% in taxes, and the poor receive an additional sum of money. In the other scenario, the wealthy pay an additional 50% in taxes (i.e., a tax increment five times greater than in the first scenario), and the poor receive (only) one-half the additional amount that they receive in the first scenario. That is, higher taxes paid by the wealthy yielded relatively less money for the poor, and vice versa (63). To clarify the rationale for this trade-off, we told participants that the wealthy earned more when tax rates were low, thereby generating more tax revenue that could be used to help the poor. Fourteen percent to 18% of the American, Indian, and British participants indicated a preference for the scenario featuring a higher tax rate for the wealthy even though it produced less money to help the poor…We regressed this wealthy-harming preference simultaneously on support for redistribution, the emotion/motivation triplet, age, gender, and SES. Dispositional envy was the only reliable predictor (Ibid.).

In short, “Compassion and envy motivate the attainment of different ends. Compassion, but not envy, predicts personally helping the poor. Envy, but not compassion, predicts a desire to tax the wealthy even when that costs the poor” (Ibid.). The cries for fairness, though, have little to do with support for redistribution:

To sum up the set of fairness studies, in predicting support for redistribution, the effect of fairness as a group-wide concern is unreliable and of far smaller magnitude than the effect of the emotion/motivation triplet. This is true whether fairness is operationalized as uniformity in the application of laws and standards or as low (or null) variance in payoffs; whether distributional fairness is assayed between individuals (studies 2a, 2c, S1a, S2a, S2b) or between groups (“the rich,” “the poor”; studies 2b, S1b, S2c, S2d); and whether allocational decisions are hypothetical (studies 2a, 2b, S1a, S1b, S2c, S2d) or consequential (studies 2c, S2a, S2b) (pg. 8423).

So, why do people support redistribution?

  1. They care about the poor and want to help them (Compassion).
  2. They hate the rich (Envy).
  3. They expect to gain from redistribution (Greed).

Sounds about right.

The Best Spear Carrier Ever

Atlas V Ignition (Public Domain)

This post is part of the General Conference Odyssey.

I liked Elder Simpson’s talk on The Lord’s Support System. He starts with an analogy about how a multil-billion-dollar space mission can be held up by something as trivial as a flaw in a thirty-cent part.

Just as space probes depend upon tens of thousands of other lesser components in their so-called support system, so does the Lord depend upon tens of thousands in His support system, that His ultimate objective of blessing the lives of people and qualifying them for eternal life might be accomplished on schedule.

He also uses an analogy of life being like a school drama where there are only a few starring roles to go around. For the rest of us? We’re the spear carriers. But then comes this interesting paragraph:

There could be many surprises in the hereafter as we look up ahead and exclaim in our amazement, “But he was only a home teacher.” You know and I know that if he was the kind of home teacher that the handbook talks about and if he lived worthily, that man could likely stand eligible to inherit all that the Father has. And there is no greater blessing than that.

I remember one day in high school when I happened to be standing at a friend’s open locker and noticed she had taped up a black-and-white photo of several male models. (I think it was a cologne ad or a jeans ad or something.) I stared absently at the models for a minute or two, wondering if I’d ever be as good-looking as they were. In theory, I figured I could have muscles as toned as them if I really worked at it. But when it came to their faces? Not really anything I could do in that department. I’m not a bad-looking guy (if I do say so myself), but I’m not a model either and it occurred to me for the first time then that that was never going to change. They say you can be anything you want when you grow up, but it’s not true.

I’ve had a few experiences like that since then, for example in playing competitive sports with people who are simply not in my league, where no matter how hard I try I not only couldn’t win; I couldn’t even make it a challenge. I’ve met people who are so smart, that it takes everything I’ve got just to recognize their intelligence. Here’s the reality: I’m never going to be that good looking, that strong, or that smart. I’m just not.

I suppose that could be depressing, but I’m not really depressed by it at all. For a variety of reasons. But here’s the one that’s relevant: I’ve come to honestly believe that the only kind of excellence that matters is excellence relative to your talents and opportunities. I’ve come to believe it doesn’t matter at all—not even a tiny bit—what you end up with. It only matters what you did with what you started with.

I do have a collection of real talents: things I’m good at, opportunities I inherited from my parents, and so on.[ref]In modern parlance: privileges.[/ref] My goal in this life is make the most out of them that I can and to do so in the service of God and my fellow humans. If—God willing—I succeed then I will have achieved the only measure of success that really matters.

So, in a way, I kind of reject the analogy of the spear carriers and the thirty-cent transistors inside of rockets or satellites. Don’t get me wrong, it’s a good analogy. It’s just not quite far enough. What I’m saying is that in God’s view a thirty-cent transistor isn’t valuable because the billion-dollar space telescope can’t work without it (or whatever). That’s an instrumental theory of value, albeit implicitly. What I’m saying is that if the thirty-cent transistor is the best thirty-cent transistor that it can be, then it’s worth exactly the same as the billion-dollar space telescope without caveat or qualification. Not because it enables the space telescope, but because all that matters is being excellent relative to our opportunities and privileges. Nothing else counts.

Check out the other posts from the General Conference Odyssey this week and join our Facebook group to follow along!

Consumption Inequality: 1960-2014

Image result for consumption gif
Consumption

Economists Bruce D. Meyer and James X. Sullivan have a brand new NBER paper on inequality; specifically consumption inequality. From the abstract:

Official income inequality statistics indicate a sharp rise in inequality over the past five decades. These statistics do not accurately reflect inequality because income is poorly measured, particularly in the tails of the distribution, and current income differs from permanent income, failing to capture the consumption paid for through borrowing and dissaving and the consumption of durables such as houses and cars. We examine income inequality between 1963 and 2014 using the Current Population Survey and consumption inequality between 1960 and 2014 using the Consumer Expenditure Survey. We construct improved measures of consumption, focusing on its well-measured components that are reported at a high and stable rate relative to national accounts. While overall income inequality (as measured by the 90/10 ratio) rose over the past five decades, the rise in overall consumption inequality was small. The patterns for the two measures differ by decade, and they moved in opposite directions after 2006. Income inequality rose in both the top and bottom halves of the distribution, but increases in consumption inequality are only evident in the top half. The differences are also concentrated in single parent families and single individuals. Although changing demographics can account for some of the changes in consumption inequality, they account for little of the changes in income inequality. Consumption smoothing cannot explain the differences between income and consumption at the very bottom, but the declining quality of income data can. Asset price changes likely account for some of the differences between the measures in recent years for the top half of the distribution.

Meyer and Sullivan have been updating their data over the years. As the 2013 version (which measures inequality from 1960 to 2011) concludes,

Consumption inequality is less pronounced than income inequality and changes in consumption inequality differ considerably from changes in income inequality. While income inequality falls in the 1960s, consumption inequality rises slightly. Both consumption and income indicate rising inequality during the 1980s, but the rise is more noticeably for income. Since the mid-2000s, income inequality has risen while consumption inequality has fallen. Over the past three decades, both income and consumption inequality have risen, but the rise is much more noticeable for income (45 percent) than for consumption (19 percent). Differences between income and consumption are also evident for different parts of the distribution. Income inequality in the top half of the distribution rose steadily between 1980 and 2011, while consumption inequality for the top half of the distribution rose between 1980 and 2005, but then fell noticeably. Although changing demographics can account for some of the changes in consumption inequality, they do not account for changes in income inequality.

Comparisons of survey data to administrative records and national income accounts data indicate under-reporting of both income and consumption. There is evidence of considerable under-reporting of government transfers in income surveys, and the extent of under-reporting has grown overtime. Such under-reporting could lead to significant bias in the level and pattern of income inequality. There is also evidence of under-reporting of consumption data, although major components of consumption such as food at home and housing are reported at a high and stable rate relative to aggregate data. The differences between income and consumption inequality changes through 2005 are almost exclusively in the bottom half of the distribution, indicating that the under-reporting of consumption by the rich is not an explanation for the differences (pg. 21).

To quote Tyler Cowen, “This is one big reason why you can believe income inequality is high and/or rising, and not see it as the most significant normative issue.”

Education and Early Economic Development

Image result for schooling gifA new study suggests that when it comes to the early stages of economic development, education may not play that big of a role. From the ungated version:

The accumulation of human capital is considered as an important determinant in the process of economic growth. Despite a large literature there is still an ambiguity regarding its role in growth as a number of empirical studies have found an insignificant, in some cases even negative, impact of human capital on growth. However, the focus of these studies has been more on issues related to the use of data and methodology and they assume that the impact of human capital is the same across countries.

Using a dynamic threshold model, we show that the reason for the apparent irrelevance of human capital (proxied by average years of schooling) for generating growth in an economy lies with its level of development. This implies that human capital accumulation cannot assert its productive role in the process of growth until an economy crosses a threshold level of development. Our finding remains robust across various tests. What helps human capital to assert its productivity at a higher level of development provides an interesting opportunity for further work (pg. 9).

It seems like the institutions of growth–largely those associated with increased economic freedom–play the most vital role in getting economies off the ground.

The Demographics of Hope

A new study looks the demographics of hopefulness in the United States. As the author explains,

Hope is an important channel driving people’s willingness to invest in the future. My early research on well-being work highlights its particular importance for people with less means, for whom making such investments requires a greater sacrifice of current consumption than it does for the rich (Graham et al. 2004). In addition to widening gaps in opportunity, the prosperity gap in the US has led to rising inequality in beliefs, hopes, and aspirations, with those who are left behind economically the least hopeful and the least likely to invest in their futures.

The author points to multiple markers that divide America,

ranging from education levels and job quality to marriage and incarceration rates to life expectancy. Indeed, the starkest evidence of this lack of faith in the future is the marked increase in premature deaths – driven largely but not only by an increase in preventable deaths (such as via suicide and drug over-dose) among middle-aged uneducated whites, as described by Case and Deaton (2017). There are even differences in the words that these two Americas use. Common words in wealthy America reflect investments in health, knowledge acquisition, and the future: iPads and Baby Bjorns, foam rollers and baby joggers, cameras, and exotic travel destinations such as Machu Picchu. The words that are common in poor America – such as hell, stress, diabetes, guns, video games, and fad diets – reflect short-time horizons, struggles, and lack of hope (Leonhardt 2015).

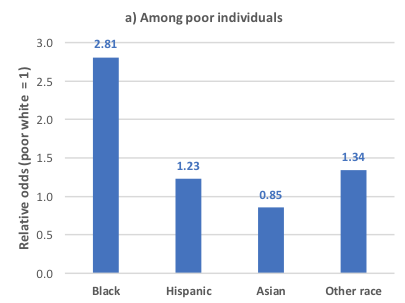
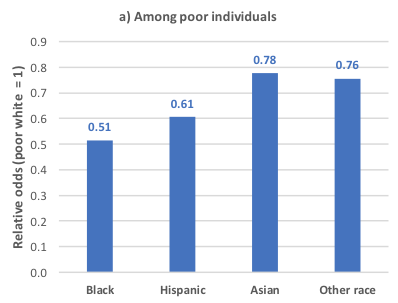
Surprisingly, “poor minorities – and blacks in particular – are much more hopeful than poor whites. Poor blacks are three times as likely to be a point higher on the ten-point optimism scale than are poor whites, while Hispanics are about one and a half times more likely than poor whites. Poor blacks are also half as likely to experience stress – a significant marker of ill-being – on a daily basis as are poor whites, while poor Hispanics are about two-thirds as likely.”

Figure 1: Odds of being on a higher level of optimism, by race group (relative to white), within each income group
Figure 2: Odds of experiencing stress, by race group (relative to white), within each income group

There are various reasons for this:

  • “One important one is that, despite substantial obstacles, minorities have been gradually narrowing the gaps with whites, at least in terms of education and life expectancy gaps. Minorities are also more likely to compare themselves with parents who were worse off than they are, while blue-collar whites are more likely to compare themselves with parents who were better off – a trend that has been increasing over the past decade, as found by Cherlin (2016).”
  • “Psychological research points to higher levels of resilience among minorities compared to whites. Assari et al. (2016) find that blacks and Hispanics are much less likely to report depression and/or commit suicide in the face of negative shocks than are whites.”
  • “More generally, urban places are more hopeful than are rural ones, as are places with higher levels of diversity. In recent research, Sergio Pinto and I find that the same places have healthier behaviours – such as more people who exercise and less who smoke (Graham and Pinto 2017).”

The study is very interesting to say the least. Check it out.

The Effects of Immigrants: Miami Edition

Economist Michael Clemens has an excellent article in Vox discussing some of his most recent research on immigration and in turn responds to Harvard’s George Borjas, the most prominent anti-immigration economist around:

Do immigrants from poor countries hurt native workers? It’s a perpetual question for policymakers and politicians. That the answer is a resounding “Yes!” was a central assertion of Donald Trump’s presidential campaign. When a study by an economist at Harvard University recently found that a famous influx of Cuban immigrants into Miami dramatically reduced the wages of native workers, immigration critics argued that the debate was settled.

…But there’s a problem. The study is controversial, and its finding — that the Cuban refugees caused a large, statistically unmistakable fall in Miami wages — may be simply spurious. This matters because what happened in Miami is the one historical event that has most shaped how economists view immigration.

In his article, Borjas claimed to debunk an earlier study by another eminent economist, David Card, of UC Berkeley, analyzing the arrival of the Cubans in Miami. The episode offers a textbook case of how different economists can reach sharply conflicting conclusions from exactly the same data.

Yet this is not an “on the one hand, on the other” story: My own analysis suggests that Borjas has not proved his case. Spend a few minutes digging into the data with me, and it will become apparent that the data simply does not allow us to conclude that those Cubans caused a fall in Miami wages, even for low-skill workers.

An influential 1990 study found “no difference in wage or employment trends between Miami — which had just been flooded with new low-skill workers — and other cities” following the arrival of 125,000 Cuban immigrants.

Two new studies reexamined the 1990 study. “Borjas, instead, focuses on workers who did not finish high school — and claimed that the Boatlift caused the wages of those workers, those truly at the bottom of the ladder, to collapse. The other new study (ungated here), by economists Giovanni Peri and Vasil Yasenov, of the UC Davis and UC Berkeley, reconfirms Card’s original result: It cannot detect an effect of the boatlift on Miami wages, even among workers who did not finish high school.” Clemens suggests looking at

certain subgroups that may have competed more directly with the newly-arrived Cubans. For example, the Mariel migrants were mostly men. They were Hispanic. Many of them were prime-age workers (age 25 to 59). So we should look separately at what happened to wages for each of those groups of low-skill workers who might compete with the immigrants more directly: men only, non-Cuban Hispanics only, prime-age workers only…Here again, if anything, wages rose for each of these groups of low-skill workers after 1980, relative to their previous trend. There isn’t any dip in wages to explain. And, again, the same is true if you compare wage trends in Miami to trends in other, similar cities. Peri and Yasenov showed that there is still no dip in wages even when you divide up low-skill workers by whether or not they finished high school. About half of the Mariel migrants had finished high school, and the other half hadn’t. So you might expect negative wage effects on both groups of workers in Miami. Here is what the wage trends look like for those two groups.

The wages of Miami workers with high school degrees (and no more than that) jump up right after the Mariel boatlift, relative to prior trends. The wages of those with less than a high school education appear to dip slightly, for a couple of years, although this is barely distinguishable amid the statistical noise. And these same inflation-adjusted wages were also falling in many other cities that didn’t receive a wave of immigrants, so it’s not possible to say with statistical confidence whether that brief dip on the right is real. It might have been — but economists can’t be sure. The rise on the left, in contrast, is certainly statistically significant, even relative to corresponding wage trends in other cities.

So how did Borjas come to different conclusions? He “starts with the full sample of workers of high school or less — then removes women, and Hispanics, and workers who aren’t prime age (that is, he tosses out those who are 19 to 24, and 60 to 65). And then he removes workers who have a high school degree. In all, that means throwing out the data for 91 percent of low-skill workers in Miami in the years where Borjas finds the largest wage effect. It leaves a tiny sample, just 17 workers per year.” Borjas’ conclusions involve a lot of statistical noise and, as Clemens notes, “if we’re willing to take low-skill workers in Miami and hand-pick small subsets of them, we can always find small groups of workers whose wages rose during a particular period, and other groups whose wages fell. But at some point we’re learning more about statistical artifacts than about real-world events.”

But there is another factor at work:

it turns out that the CPS sample includes vastly more black workers in the data used for the Borjas study after the boatlift than before it.

Because black men earned less than others, this change would necessarily have the effect of exaggerating the wage decline measured by Borjas. The change in the black fraction of the sample is too big and long-lasting to be explained by random error. (This is my own contribution to the debate. I explore this problem in a new research paper that I co-authored with Jennifer Hunt, a professor of economics at Rutgers University.)

Around 1980, the same time as the Boatlift, two things happened that would bring a lot more low-wage black men into the survey samples. First, there was a simultaneous arrival of large numbers of very low-income immigrants from Haiti without high school degrees: that is, non-Hispanic black men who earn much less than US black workers but cannot be distinguished from US black workers in the survey data. Nearly all hadn’t finished high school.

That meant not just that Miami suddenly had far more black men with less than high school after 1980, but also that those black men had much lower earnings. Second, the Census Bureau, which ran the CPS surveys, improved its survey methods around 1980 to cover more low-skill black men due to political pressure after research revealed that many low-income black men simply weren’t being counted.

You can see what happened in the graph below, which has a point for each year’s group of non-Hispanic men with less than high school, in the data used by Borjas (ages 25 to 59). The horizontal axis is the fraction of the men in the sample who are black. The vertical axis is the average wage in the sample. Because black men in Miami at this skill level earned much less than non-blacks, it’s no surprise that the more black men are covered by each year’s sample, the lower the average wage.

But here’s the critical problem: The fraction of black workers in this sample increased dramatically between the years just before the boatlift (in red) and the years just after the boatlift (in blue). That demographic shift would make the average wage in this group appear to fall right after the boatlift, even if no one’s wages actually changed in any subpopulation. What changed was who was included in the sample.

“When the statistical results in the Borjas study are adjusted to allow for changing black composition of the sample in each city,” Clemens continues, “the result becomes fragile. In the dataset Borjas focuses on, the result suddenly depends on which set of cities one chooses to compare Miami to. And in the other, larger CPS dataset that covers the same period, there is no longer a statistically significant dip in wages at all.” And once “you’ve discarded women, and Hispanics, and workers under 25, and workers over 59, and anyone who finished high school— and blacks, you’ve thrown away 98 percent of the data on low-skill workers in Miami. There are only four people left in each year’s survey, on average, during the years that the Borjas study finds the largest effect. With samples that small, the statistical confidence interval (represented by the dotted lines) is huge, meaning we can’t infer anything general from the results. We can’t distinguish large declines in wages from large rises in wages — at least until several years after the boatlift happened, and those can’t be plausibly attributed to the boatlift.”

In conclusion, “[t]here is no clear evidence that wages fell (or that unemployment rose) among the least-skilled workers in Miami, even after a sudden refugee wave sharply raised the size of that workforce. This does not by any means imply that large waves of low-skill immigration could not displace any native workers, especially in the short term, in other times and places. But politicians’ pronouncements that immigrants necessarily do harm native workers must grapple with the evidence from real-world experiences to the contrary.”


The Shadow of Godhood

Detail of the lectern in Durham Cathedral, dating from the late 19th century, and designed by Sir George Gilbert Scott. It depicts ‘a pelican in her piety’ – in other words, piercing her breast to feed her young with her own blood.
© Michael Sadgrove

This post is part of the General Conference Odyssey.

This story comes from Elder Russell Ballard, Jr’s talk, The Making of a Missionary:

Shortly after we arrived in Toronto we were preparing the children to enroll in their schools. My five-year-old son was to start kindergarten, but on the first day he was afraid to go. My wife and I were concerned, and I was impressed to invite my son to come into my office and sit in what the missionaries call the “hot seat,” and we would have an interview.

He climbed up into the big black chair, and I asked, “Son, how can I help you?”

I shall never forget as long as I live the look of real concern on his face. With his little chin quivering, he said, “Daddy, I am afraid.”

I understood, for I knew he had left behind several friends of his same age, and so far he had found no one his age near the mission home. I said, “Craig, you have a friend that will always be with you. Let’s kneel down together and ask Him to help you.” We did, and Craig assigned me to say the prayer.

The Lord helped Craig find his courage in this experience. Every morning thereafter we held our interview, and every morning I was assigned to pray.

Then one morning, about two weeks later, there came no knock at my office door—no special father-and-son prayer. He had found his confidence and made some friends, and I was the one that missed that very special experience each morning with my little boy. I hope that this choice learning experience while on this mission will remain with Craig and become a source of strength to him when he is called to serve the Lord on a mission of his own.

There is another story that I would also like to share. It is the story of how the pelican became a symbol of the Christian faith.

The belief probably came about because of the pelican’s red-tipped beak and very white feathers, and because long-beaked birds such as the pelican are often to be found standing with their beaks resting on their breasts.

Because of the red-tipped beak, people believed that pelicans pierced their own chests and fed their own blood to their young. A gruesome belief? Perhaps, but not as gruesome as Christ’s teaching that “Except ye eat the flesh of the Son of man, and drink his blood, ye have no life in you.”

The story about pelicans feeding their blood to their offspring is mistaken, but the lesson is not. What Elder Ballard could have said ta the end of his story is this: the highest and deepest act of parenthood is to break our hearts and feed the pieces to our children. When we are doing our best, we are giving our lives—one tiny piece at a time—so that they can live, and we do not count the cost. Our greatest sacrifice is our joy.

We cannot understand what is to be God. But, as parents who strive to protect and nurture our children until they don’t need us anymore, we see the shadow cast by Godhood.

Check out the other posts from the General Conference Odyssey this week and join our Facebook group to follow along!

Predatory Fines

Toward the end of last year, I did a rundown of the data on racial bias and policing. A new study is worth adding to the list. According to its findings,

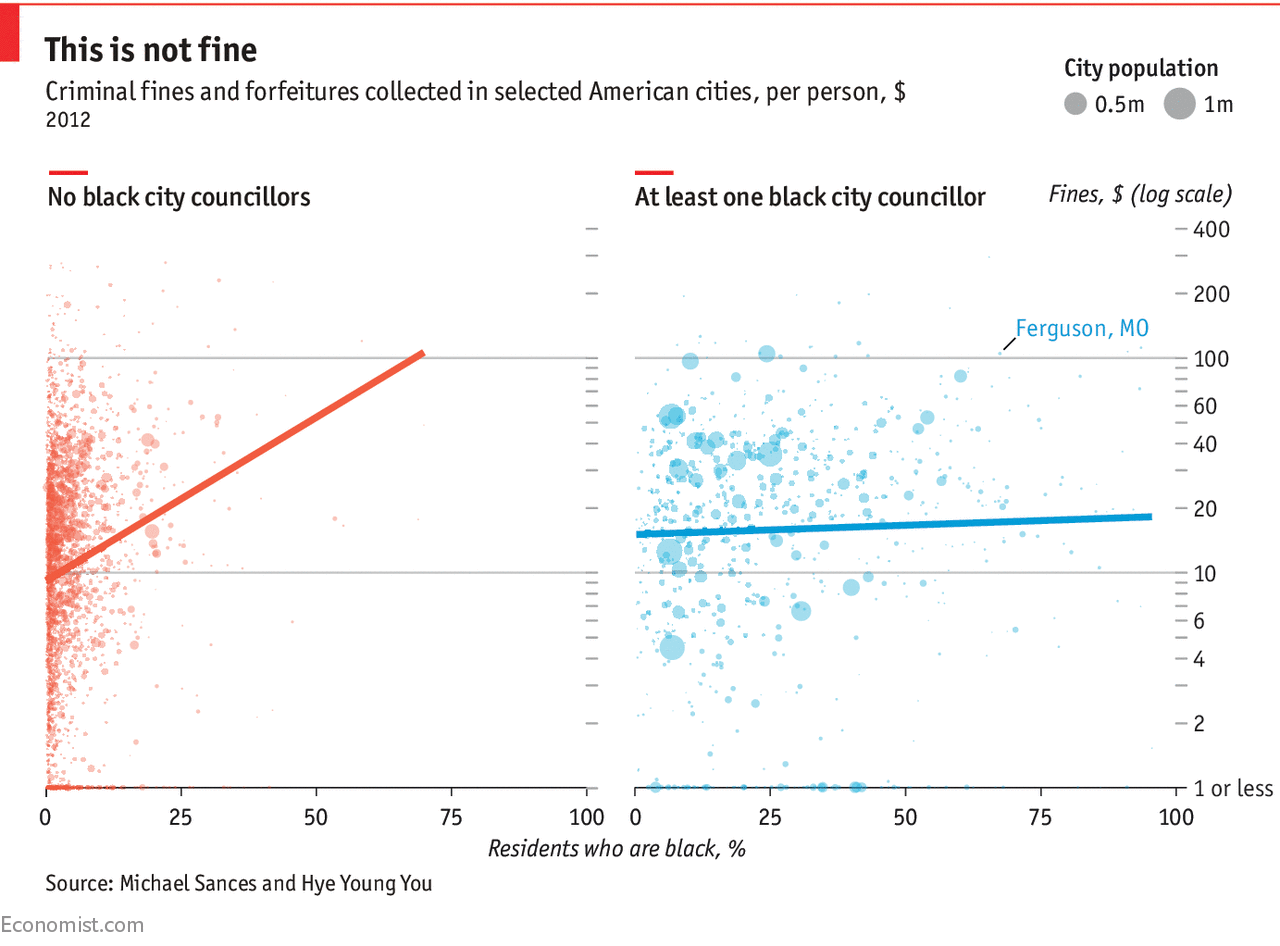
Ferguson was unlikely to be a unique outlier, and other cities engaging in similar practices might well have continued outside of the national spotlight. A new paper by Michael Sances of the University of Memphis and Hye Young You of Vanderbilt University published this month in the Journal of Politics found that Ferguson was indeed more of a rule than an exception. After examining data on 9,000 American cities, they found that those with more black residents consistently collected unusually high amounts of fines and fees—even after controlling for differences in income, education and crime levels. Cities with the largest shares (98%) of black residents collected an average of $12-$19 more per person than those with the smallest (0%) did.

However, there was one subgroup of cities that bucked the trend: the relationship between race and fines was only half as strong in places whose city councils included at least one black member. This may be because black politicians are likelier than white ones are to respond to complaints from black constituents. Black councillors might also intervene to stop certain policies, like increasing court fees, from going into effect to begin with.

What fines are we talking about exactly?

For example, in Peoria, Arizona, two people were jailed for not trimming weeds more than six inches tall. In Ferguson, a black man resting in his car after playing basketball in the public park was stopped by police and charged with, among other things, not wearing a seat belt in his (parked) car and making a false declaration after giving the officer a shortened name (like “Bob” instead of “Robert”). Such fines may fall disproportionately on the backs of black citizens, because they tend to be poorer and lack the resources to contest the penalties.

Despite the exhaustive controls the authors included in their study, the strong correlation they found does not demonstrate decisively that race is the ultimate cause of higher fines. However, it does put a very high burden of proof on researchers arguing that some other factor is responsible. Now that the pattern has been identified across the country, city governments that rely heavily on fines would be well-advised to consider more transparent sources of revenue, and ones that do not place an additional burden on a subset of residents who are already disadvantaged.

Check it out.

Consistent Warnings

This post is part of the General Conference Odyssey.

In his talk, Ready to Work Long Hours, Elder Tanner cited an address to BYU by Dr. John A Howard contrasting the challenges faced by the pioneers with the challenges facing todays Saints:

The work that faces your generation is no less arduous. The deserts you must bring to blossom are no less arid, but your mission may demand even more of you, for unlike the early pioneers of this state you are confronted by a wilderness which is subtle and fluid and elusive. Indeed the wilderness which you must conquer is disguised as a civilization so that there is the double necessity to unmask the deceit, to distinguish between what is authentic and what is counterfeit, and to labor to support the one and oppose the other.[ref]The emphases are all original. Also: Dr. Howard was not Mormon.[/ref]

Later on in the talk, Elder Tanner explained the three worst components of the danger Dr. Howard referred to:

First, failure to keep the Sabbath day holy; second, breaking the Word of Wisdom: third, unchastity. There are many others.

I don’t hear as much about Word of Wisdom violations from the pulpit today as was common during General Conferences of the 1970s, but there is no doubt that it remains one of the greatest crises facing our nation. From a Vox article that came out today[ref]This post is dated July 25th, but I am actually catching up on a missed week and writing it Aug 1[/ref]:

The scale of America’s opioid epidemic is shocking.

It is the deadliest drug overdose crisis in US history. In 2016 alone, drug overdoses likely killed more Americans in one year than the entire Vietnam War. In 2015, drug overdoses topped annual deaths from car crashes, gun violence, and even HIV/AIDS during that epidemic’s peak in 1995. In total, more than 140 people are estimated to die from drug overdoses every day in the US. About two-thirds of these drug overdose deaths are linked to opioids.

As for the other two—the Sabbath and chastity—that is precisely what the Church has been emphasizing as of late.

We cannot say we haven’t been adequately warned.

Check out the other posts from the General Conference Odyssey this week and join our Facebook group to follow along!

Drug Overdose in Portugal

This is encouraging. From The Washington Post:

Portugal decriminalized the use of all drugs in 2001. Weed, cocaine, heroin, you name it — Portugal decided to treat possession and use of small quantities of these drugs as a public health issue, not a criminal one. The drugs were still illegal, of course. But now getting caught with them meant a small fine and maybe a referral to a treatment program — not jail time and a criminal record.

Whenever we debate similar measures in the U.S. — marijuana decriminalization, for instance — many drug-policy makers predict dire consequences. “If you make any attractive commodity available at lower cost, you will have more users,” former Office of National Drug Control Policy deputy director Thomas McLellan once said of Portugal’s policies. Joseph Califano, founder of the Center for Addiction and Substance Abuse at Columbia University, once warned that decriminalization would “increase illegal drug availability and use among our children.”

But in Portugal, the numbers paint a different story. The prevalence of past-year and past-month drug use among young adults has fallen since 2001, according to statistics compiled by the Transform Drug Policy Foundation, which advocates on behalf of ending the war on drugs. Overall adult use is down slightly too. And new HIV cases among drug users are way down.

Now, numbers just released from the European Monitoring Centre for Drugs and Drug Addiction paint an even more vivid picture of life under decriminalization: drug overdose deaths in Portugal are the second-lowest in the European Union.

From Mark Perry

Furthermore, “the use of “legal highs” — like so-called “synthetic” marijuana, “bath salts” and the like — is lower in Portugal than in any of the other countries for which reliable data exists. This makes a lot of intuitive sense: why bother with fake weed or dangerous designer drugs when you can get the real stuff? This is arguably a positive development for public health in the sense that many of the designer drugs that people develop to skirt existing drug laws have terrible and often deadly side effects.” In short, “[a]s the Transform Drug Policy Institute says in its analysis of Portugal’s drug laws, “The reality is that Portugal’s drug situation has improved significantly in several key areas. Most notably, HIV infections and drug-related deaths have decreased, while the dramatic rise in use feared by some has failed to materialise.””

Still think the Drug War is a good idea?