How many happy, sexually vibrant religiousmarried couples have you seen on popular television shows or movies — even in this era of fragmented, targeted entertainment? Now, compare that number (which is very, very close to zero) with the number of times you’ve seen liberation from religion portrayed as the key to sexual fulfillment.
How many times, amid the celebrations of sexuality on college campuses, do you hear the speakers at the various “sex weeks” say something like, “If you really want to improve your odds of enjoying a sexually satisfying life with a faithful partner, you might want to check out church”? Or how many wonkish progressives — the very people most likely to share charts and graphs about the effects of public policies or to pass around the latest social science about race, gender, and gender identity — will dwell on charts such as these, from the invaluable Institute for Family Studies:
He continues:
The global data reflected the U.S. reality. Highly religious couples “enjoy higher-quality relationships and more sexual satisfaction” compared with mixed or entirely secular couples. Moreover, in the global study, religion has an increasingly positive influence on fertility. Religious couples had “0.27 more children than those who never, or practically never, attend.”
Sadly, however, religious practice was “not protective against domestic violence.” There was no statistically significant difference in risk between secular and religious couples.
The IFS study doesn’t just explode progressive cultural stereotypes of unhappy, sexless religious prudes. Conservatives often think of feminists (especially secular feminists) as angry and joyless. But the study indicates otherwise. There was a “J-Curve in overall relationship quality for women.” It turns out that women in “shared secular, progressive relationships enjoy comparatively high levels of relationship quality.” They were surpassed only by “women in highly religious relationships, especially traditionalists.”
Less sex may also be contributing to less happiness. “IFS senior fellow Bradford Wilcox and IFS research fellow Lyman Stone followed Julian’s work by examining whether the sex recession was related to the measurable decline of happiness in America’s young adults. They concluded that “changes in sexual frequency can account for about one-third of the decline in happiness since 2012 and almost 100 percent of the decline in happiness since 2014.”” In short, the sexual revolution has brought about
its own brand of unhappiness, including — ironically enough — sexlessness…Sexual liberation has all too often brought neither sex nor liberation, and thanks to the work of the IFS, we can respond to felt need with real data. Are you seeking love in this life? The church doors are always open, and while matchmaking isn’t its purpose, the connection to a holy God carries with it connection to his flawed people, and in those connections you can find profound joy.
A critical literature review of political ignorance among the public. This section briefly (though not exhaustively) shows how political knowledge affects political preferences and, therefore, potential policy outcomes.
The Stuff I Said
Somin writes, “Ignorance of the structure of government suggests that voters often not only cannot choose between specific competing policy programs but also cannot easily assign credit and blame for policy outcomes to the right officeholders.”[ref]Ilya Somin, Democracy and Political Ignorance: Why Smaller Government is Smarter, 2nd ed. (Stanford, CA: Stanford University Press, 2016), 20.[/ref] As discussed earlier, Lupia is skeptical of the common measurements of political knowledge, arguing that the ability to recall particulars on a survey is not necessary to achieve “high-value social outcomes.”[ref]Arthur Lupia, Uninformed: Why People Know So Little About Politics and What We Can Do About It (New York: Oxford University Press, 2016), 204.[/ref] However, this is an empirical question. The summary of Caplan’s work in a previous section has already shown that economic information and education changes one’s views about economic issues. Summarizing the work of Martin Gilens[ref]Martin Gilens, Affluence & Influence: Economic Inequality and Political Power in America (Princeton, NJ: Princeton University Press, 2012).[/ref] and Scott Althaus,[ref]Scott L. Althaus, Collective Preferences in Democratic Politics: Opinion Surveys and the Will of the People (Cambridge, UK: Cambridge University Press, 2003).[/ref] Brennan demonstrates that political knowledge influences policy preferences. As noted above, high-income is strongly correlated with high degrees of political knowledge. Compared to wealthier Democrats, low-income Democrats “more strongly approved of invading Iraq in 2003. They more strongly favored the Patriot Act, invasions of civil liberty torture, protectionism, and restricting abortion rights and access to birth control. They are less tolerant of homosexuals and more opposed to gay rights.”[ref]Jason Brennan, Against Democracy (Princeton, NJ: Princeton University Press, 2016), 34.[/ref] When demographic factors like race, income, and gender are controlled for, high-information voters “favor overall less government intervention and control of the economy…They are more in favor of free trade and less in favor of protectionism. They are more pro-choice. They favor using tax increases to offset the deficit and debt. They favor less punitive and harsh measures on crime, and are less hawkish on military policy, although they favor other forms of intervention. They are more accepting of affirmative action. They are less supportive of prayer in public schools. They are more supportive of market solutions to health care problems. They are less moralistic in law; they don’t want government to impose morality on the population.”[ref]Ibid.[/ref]
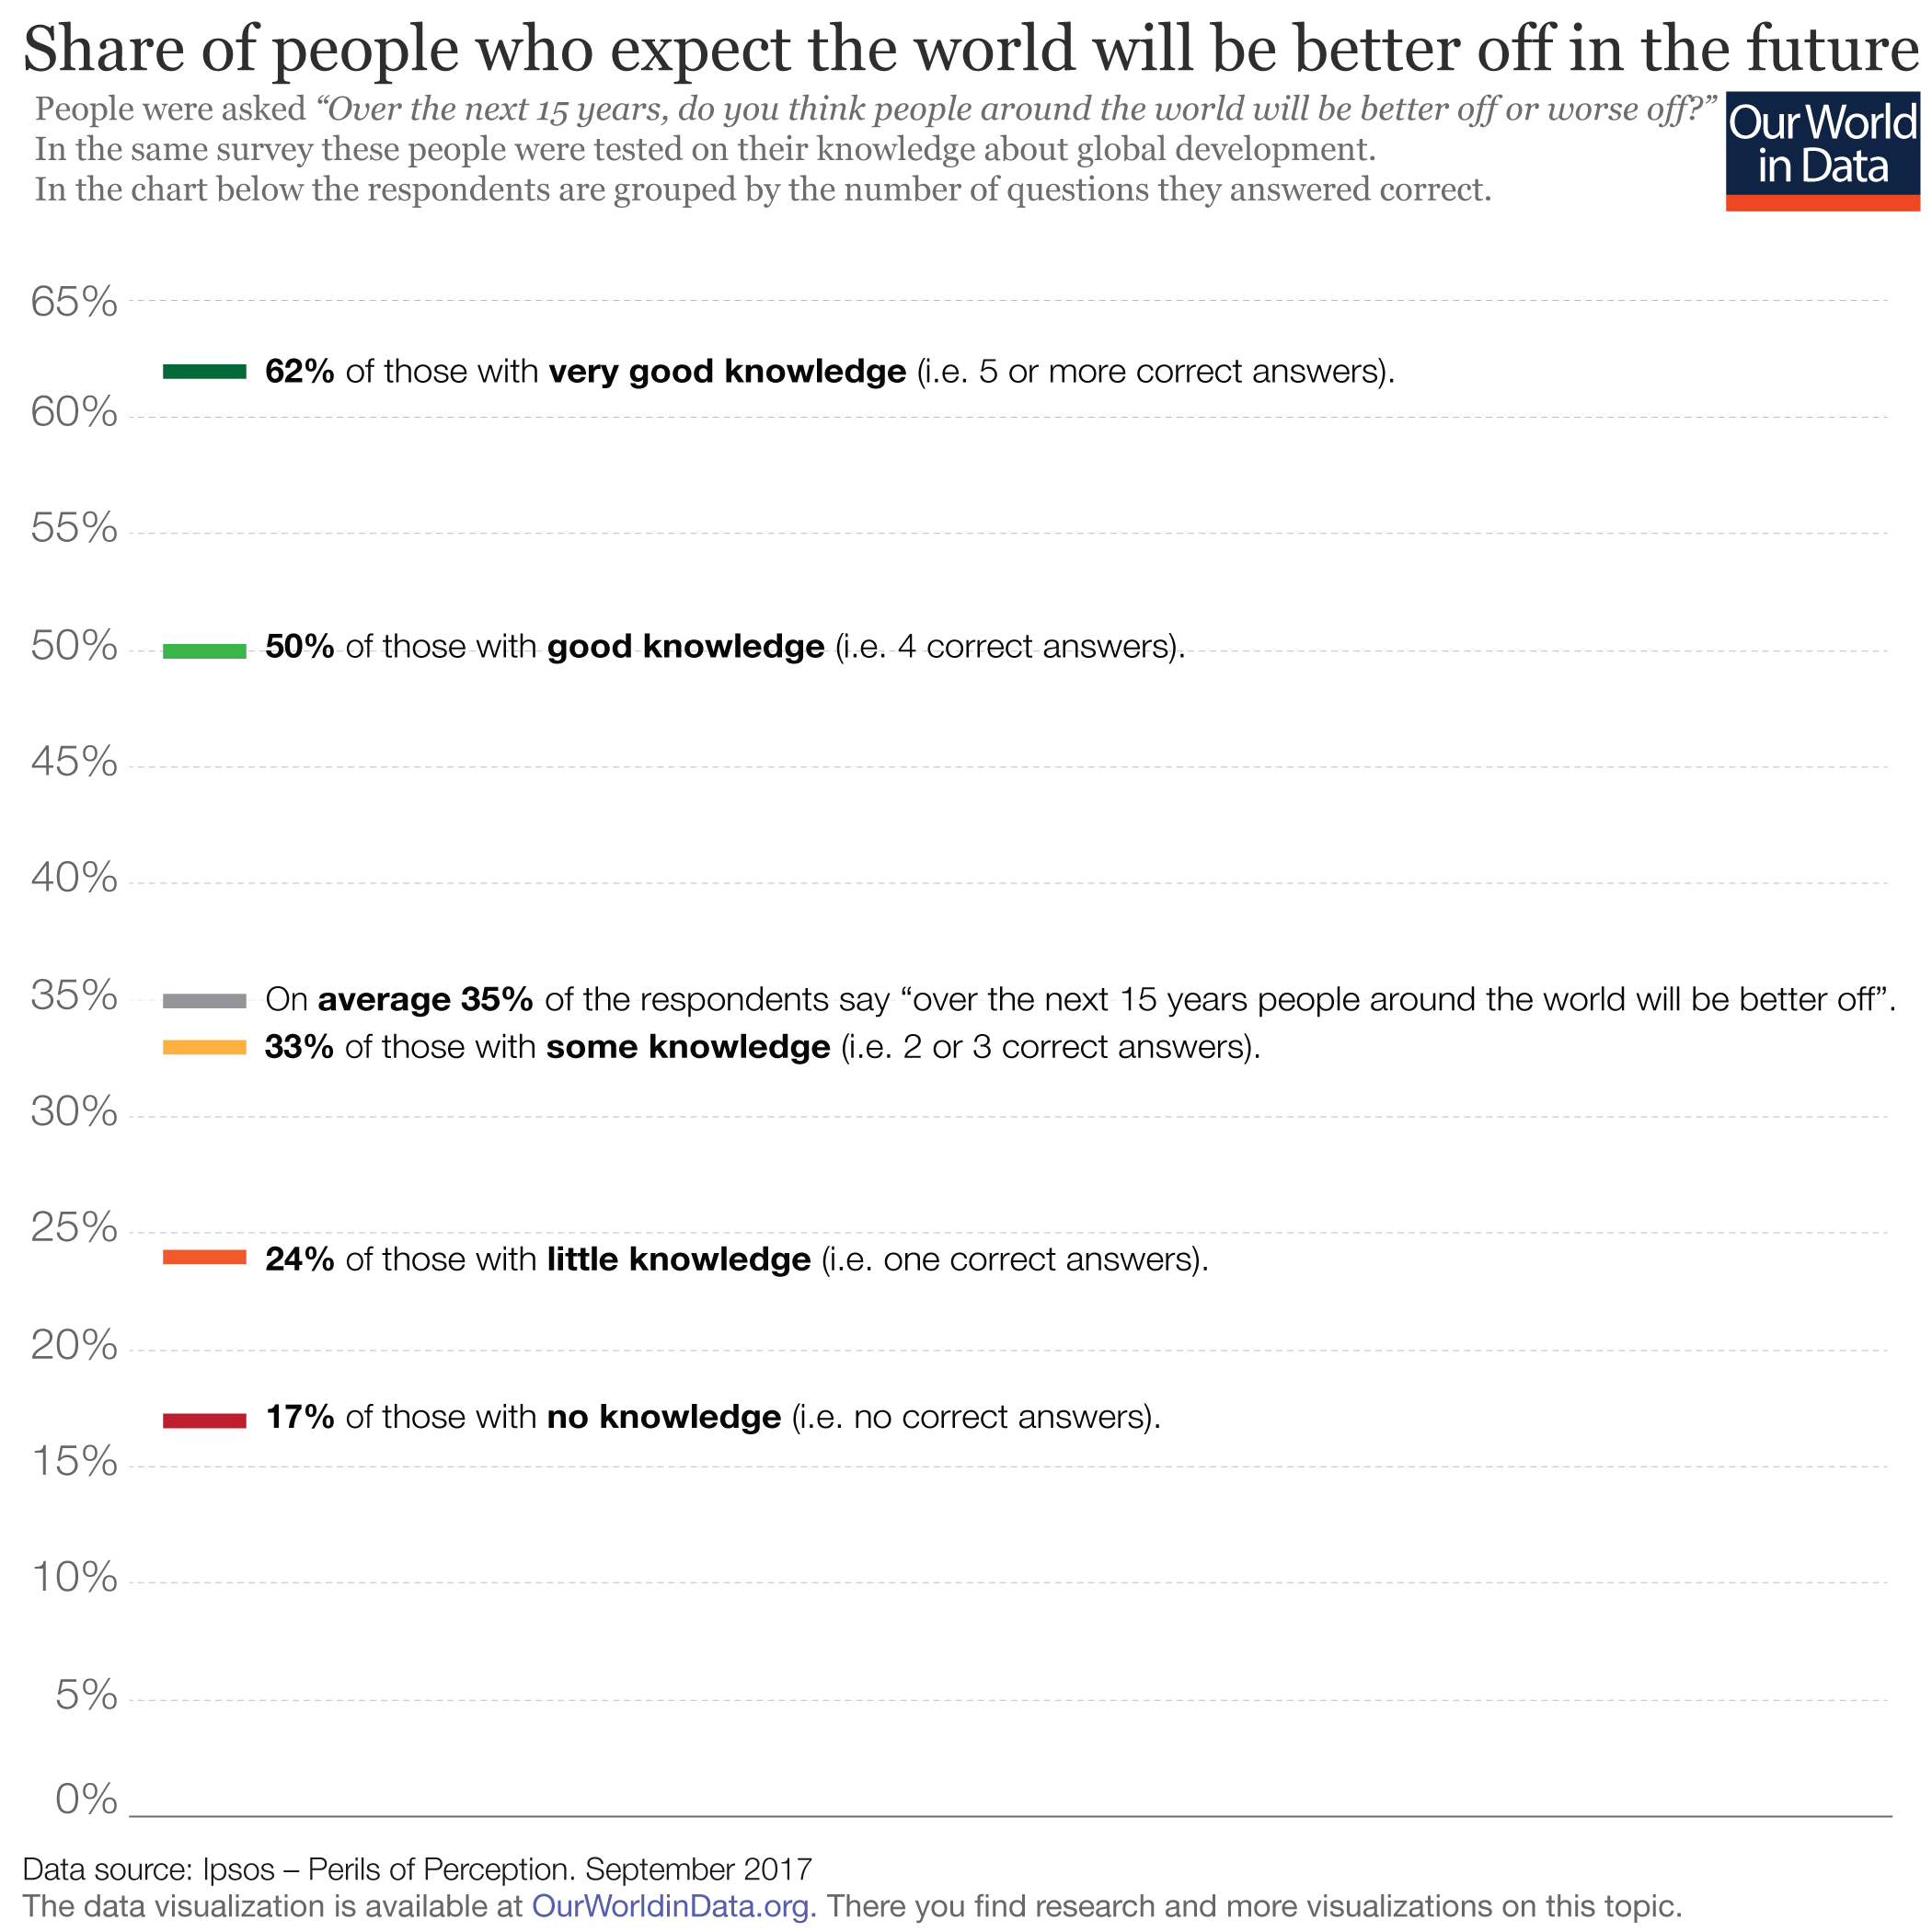
Relying on a 2017 survey, Oxford economist Max Roser finds “a connection between our perception of the past and our hope for the future.” The numbers suggest “that the degree of optimism about the future differs hugely by the level of people’s knowledge about global development. Those that were most pessimistic about the future tended to have the least basic knowledge on how the world has changed.”
At first blush, this may seem unrelated to policy. However, recent evidence suggests that declinism—a negative view of the state and evolution of society—and nostalgia for a supposedly better past are predictive of populist support.[ref]Mark Elchardus, Bram Spruyt, “Populism, Persistent Republicanism and Declinism: An Empirical Analysis of Populism as a Thin Ideology,” Government and Opposition 51:1 (2016): 111-113; Katie Simmons, Laura Silver, Courtney Johnson, Kyle Taylor, Richard Wike, “In Western Europe, Populist Parties Tap Anti-Establishment Frustration but Have little Appeal Across Ideological Divide,” Pew Research Center (July 2018): https://www.pewglobal.org/2018/07/12/in-western-europe-populist-parties-tap-anti-establishment-frustration-but-have-little-appeal-across-ideological-divide/[/ref]
Even though the data suggest more knowledgeable citizens are more likely to vote, there is also evidence that “more knowledgeable citizens are far more likely to falsely report voting than less knowledgeable ones…People who are knowledgeable and interested in politics but still choose not to vote are more likely to feel guilty for doing so, and therefore less willing to admit their nonvoting to the pollsters. As a result, the voting population is probably significantly closer in knowledge level to the general public than might be supposed.”[ref]Somin, Democracy and Political Ignorance, 45.[/ref]
While all policy decisions ultimately rely on value judgments (which go beyond the blunt empirics), the evidence in this section suggests that degrees of political knowledge do influence policy preferences. If one is concerned about policy outcomes, one should also be concerned about voter knowledge.
A critical literature review of political ignorance among the public. This section summarizes the scholarly explanations for the lack of political knowledge among the average citizen.
The Stuff I Said
Though political ignorance is rampant among American citizens, scholars are quick to distinguish between ignorance and stupidity. Despite rising educational attainment and IQ scores, political knowledge among the general public has remained largely stagnant since the 1930s.[ref]Ilya Somin, Democracy and Political Ignorance: Why Smaller Government is Smarter, 2nd ed. (Stanford, CA: Stanford University Press, 2016), 21, 73.[/ref] In fact, Somin determines (in agreement with previous economic theories of democracy) that most political ignorance is rational.[ref]Ibid., Ch. 3. Brennan follows suit. See Against Democracy (Princeton, NJ: Princeton University Press, 2016), Ch. 2.[/ref] Political knowledge is costly in time and effort with little payoff in terms of political influence. At best, an American voter has a 1-in-10 million chance of changing the outcome of a presidential election. This optimistic number occurs only within a few swing states and only if the voter votes for one of the candidates in the two major parties. On average, however, the chance is 1-in-60 million.[ref]Andrew Gelman, Nate Silver, Aaron Edlin, “What is the Probability Your Vote Will Make a Difference?” Economic Inquiry 50:2 (2012): 321-326.[/ref] Numbers improve when it comes to U.S. Congressional elections (1-in-89,000) and state legislator elections (1-in-15,000), but the probability of changing the outcome still remains insanely low.[ref]Casey B. Mulligan, Charles G. Hunter, “The Empirical Frequency of a Pivotal Vote,” Public Choice 116:1-2 (2003): 31-54.[/ref] Brennan argues that, from a strictly mathematical standpoint, the disutility of merely driving to the polls (i.e., the probability and cost of getting into an auto accident) is higher than the utility of the vote cast upon arrival.[ref]Jason Brennan, The Ethics of Voting (Princeton, NJ: Princeton University Press, 2011), 19-20.[/ref] Given these hard data, political ignorance appears to be a rational trade-off. As Somin puts it, “Even a 100 percent altruistic person—someone who always chooses to prioritize the welfare of others over his own whenever the two conflict—would not rationally devote much of his time to acquiring political information for the sake of casting an informed vote. No matter how great the benefits to others of a “correct” electoral outcome, the altruist’s ballot has almost no chance of bringing it about; in a large electorate the change that his vote will be decisive is vanishingly small.”[ref]Somin, Democracy and Political Ignorance, 77.[/ref]
Caplan’s explanation for voter ignorance extends beyond rational ignorance to what he calls rational irrationality: “Since delusional political beliefs are free, the voter consumes until he reaches his “satiation point,” believing whatever makes him feel best. When a person puts on his voting hat, he does not have to give up practical efficacy in exchange for self-image, because he has no practical efficacy to give up in the first place.”[ref]Bryan Caplan, The Myth of the Rational Voter (Princeton, NJ: Princeton University Press, 2007), 132 (italics original).[/ref] Not only does the acquisition of political knowledge provide a low return on investment, but irrationality can provide self-satisfaction at virtually no cost. This makes the choice to be seemingly irrational when it comes to politics understandable and arguably—if paradoxically—rational.
Caplan elsewhere provides another likely explanation for voter ignorance: poor information retention. Drawing on literature in educational psychology, Caplan finds the “transfer of learning” in our educational systems to be less than impressive. Most students are unable to retain or apply their newfound methodological reasoning outside of the classroom and can usually only do so within the classroom after being instructed to apply a particular principle to their problem-solving.[ref]Bryan Caplan, The Case Against Education: Why the Education System is a Waste of Time and Money (Princeton, NJ: Princeton University Press, 2018), 51-59.[/ref] “Telling subjects to use a principle is not transfer,” says psychologist Douglas Detterman. “It is following instructions.”[ref]Ibid., 51.[/ref] This insight complements the rational ignorance theory by demonstrating the difficult and costly nature of true education. This lack of transfer in learning shows up in various surveys of American adults who typically received public K-12 education:
The American Revolution Center tested 1,001 adult Americans’ knowledge of the American Revolution. Eighty-three percent earned failing grades. The Intercollegiate Studies Institute tested over 2,500 adult Americans’ knowledge of American government and American history. Seventy-one percent earned failing grades. Newsweek magazine gave 1,000 Americans the U.S. Citizenship Test. Thirty-eight percent scored too low to become citizens of their own country. On the 2000 American National Election Study, the typical person got 48% of the factual questions right; you would expect 28% by guessing…How many American adults know the Bill of Rights is part of the Constitution? The American Revolution Center reports a dismal 57%, but the truth is far worse. Since there were only four response options, you would expect roughly 25% of the ignorant to guess the right answer by chance…Not knowing the three branches of government isn’t like not knowing Hamlet; it’s like not knowing the letter “h.” If you don’t know that the Civil War came after the Declaration of Independence, you don’t understand American history. If you don’t know which parties control the House and the Senate, you don’t understand American politics.[ref]Ibid., 44.[/ref]
Ian Anson of the University of Maryland introduces a more disturbing angle on the persistence of voter ignorance. In a 2018 study, Anson points to what is known as the Dunning-Kruger effect: “[a] widely cited phenomenon in social psychology [that] holds that individuals with low levels of competence will judge themselves to be more competent than they really are, while those with high levels of competence will underestimate their excellence.”[ref]Ian G. Anson, “Partisanship, Political Knowledge, and the Dunning-Kruger Effect,” Political Psychology 39:5 (2018): 1173.[/ref] This overestimation of one’s abilities and/or knowledge “affect[s] the ability of low achievers to overcome their incompetence because they are unaware that they lag behind others until their objective performance is measured and reported to them.”[ref]Ibid.: 1174.[/ref] After surveying two groups (a total of 2,606 American adults) on political knowledge, Anson had participants evaluate their performance after priming them with partisan cues. The results showed that the worst performers (i.e., the most politically ignorant) were more likely to overestimate their performance. What’s worse, this overconfidence was exacerbated by partisanship. “This result is normatively worrying from the perspective of citizens’ ability to self-correct,” writes Anson, “as it may be that rationally ignorant Americans are especially confident that they are better informed than many of their (partisan) peers. The rationally ignorant fail to overcome their ignorance not just because they face steep costs and lack incentives to improve, but because they are unaware that they are relatively ignorant. They become increasingly hardened to the possibility that they are uninformed when partisan identities are activated, a commonplace feature of most contemporary political discussion.”[ref]Ibid.: 1187.[/ref] Anson’s findings are bolstered by a recent study, which found that (1) “people choose to hear from those who are politically like-minded on topics that have nothing to do with politics…in preference to those with greater expertise on the topic but have different political views,” (2) “all else being equal, people are more influenced by politically like-minded others on nonpolitical issues,” and (3) “people are biased to believe that others who share their political opinions are better at tasks that have nothing to do with politics, even when they have all information they need to make an accurate assessment about who is the expert in the room.”[ref]Joseph Marks, Eloise Copland, Eleanor Loh, Cass R. Sunstein, Tali Sharot, “Epistemic Spillovers: Learning Others’ Political Views Reduces the Ability to Assess and Use Their Expertise in Nonpolitical Domains,” Cognition (forthcoming), 10. https://doi.org/10.1016/j.cognition.2018.10.003.[/ref] This partisan selection process lowers the quality of the obtained information, further inflaming voter tendency toward ignorance and misinformation. Most scholars adhere to a theory of rational ignorance among voters: due to the poor incentives provided by a democratic system, most citizens determine that the costs of political knowledge (including the difficulty of making it stick) outweigh its benefits. Furthermore, the poorly informed suffer from “the double burden of incompetence”[ref]Anson, “Partisanship, Political Knowledge, and the Dunning-Kruger Effect,” 1187.[/ref] due to ignorance of their own ignorance, making change unlikely.
A critical literature review of political ignorance among the public. This section specifically explores the academic literature on the extent of political ignorance, demonstrating that Americans know very little when it comes to politics and policy.
The Stuff I Said
What makes this particular skit humorous is how much it reflects reality. According to political scientists Christopher Achens and Larry Bartels, there is a “folk theory” of democracy that is widespread in American culture. This theory paints average citizens as engaged, well-informed participants in the political process, deliberating policies and selecting leaders who represent their well-reasoned preferences. “Unfortunately,” write Achens and Bartels, “while the folk theory of democracy has flourished as an ideal, its credibility has been severely undercut by a growing body of scientific evidence…That evidence demonstrates that the great majority of citizens pay little attention to politics.”[ref]Christopher H. Achen, Larry M. Bartels, Democracy for Realists: Why Elections Do Not Produce Responsive Government (Princeton, NJ: Princeton University Press, 2016), 1.[/ref]
Michael Delli Carpini and Scott Keeter have defined political knowledge as “the range of factual information about politics that is stored in long-term memory.”[ref]Michael Delli Carpini, Scott Keeter, What Americans Know About Politics and Why It Matters (New Haven: Yale University Press, 1996), 10.[/ref] Most of the surveys on which claims about political knowledge are based consist of recall questions, which “are designed to measure whether or not a person has selected declarative memory.”[ref]Arthur Lupia, Uninformed: Why People Know So Little About Politics and What We Can Do About It (New York: Oxford University Press, 2016), 191.[/ref] Drawing on Carpini and Keeter’s work, Achens and Bartels display the ignorance of the typical American on these kinds of questions. For example, in 1952, “only 44% of Americans could name at least one branch of government. In 1972, only 22% knew something about Watergate. In 1985, only 59% knew whether their own state’s governor was a Democrat or a Republican. In 1986, only 49% knew which one nation in the world had used nuclear weapons.”[ref]Achens & Bartels, Democracy for Realists, 35.[/ref] Recent survey evidence continues to support these findings. A 2018 poll found that 67% of Americans cannot name all three branches of government. Another poll found that a sizeable minority (39%) of Americans think or are not sure if low GDP is better for the country than high GDP. The Woodrow Wilson Foundation recently found that only 1-in-3 Americans can pass the U.S. Citizenship Test, with less than half the population of all but one state (Vermont) being able to pass it. A 2014 Barna survey found that 84% of Americans are unaware that extreme poverty worldwide has decreased by more than half in the past three decades. Sixty-seven percent said they thought global poverty was actually increasing during that time. Similarly, a 2016 study found that only 8% of Americans believe extreme global poverty has decreased in the last 20 years.[ref]Martijn Lampert, Panos Papadongonas, Towards 2030 Without Poverty: Increasing Knowledge of Progress Made and Opportunities for Engaging Frontrunners in the World Population with the Global Goals (Amsterdam: Glocalities, 2016), 8.[/ref] (A 2017 study placed the percentage slightly higher at fifteen.) The late statistician Hans Rosling often tested his audience’s knowledge of the state of the world. Overall, he found that only 5% of Americans could answer a multiple-choice question about global poverty correctly: worse than chimpanzees picking at random.[ref]Hans Rosling with Ola Rosling and Anna Rosling Ronnlund, Factfulness:Ten Reasons We’re Wrong About the World—and Why Things Are Better Than You Think (New York: Flatiron Books, 2018), 6-9.[/ref] This ignorance not only extends to basic facts about government, politics, and the economy, but to party makeup as well. A 2018 study found that “Republicans, Democrats, and independents, all overestimate the share of party-stereotypical groups in both the major parties.”[ref]Douglas J. Ahler, Gaurav Sood, “The Parties in Our Heads: Misperceptions about Party Composition and Their Consequences,” The Journal of Politics 80:3 (2018): 979.[/ref] For example, respondents thought 39.3% of Democrats belonged to a labor union (actual: 10.5%), 38.2% of Republicans earned over $250,000 a year (actual: 2.2%), and 31.7% of Democrats were gay, lesbian, or bisexual (actual: 6.3%).[ref]Ibid.: 966.[/ref]
Georgetown political philosopher Jason Brennan divides the spread of political knowledge into four quartiles: “the top 25 percent of voters are well informed, the next 25 percent are badly informed, the next 25 percent are know-nothings, and bottom 25 percent are systematically misinformed.”[ref]Jason Brennan, Against Democracy (Princeton, NJ: Princeton University Press, 2016), 188.[/ref] According to data from the 1992 American National Election Studies, “93.4 percent of people in the top quartile, but only 13.1 percent of people in the bottom quartile, know that Republicans tend to be more conservative than Democrats. Among people in the lowest knowledge quartile, only 12.2 percent and 9.7 percent knew which party controlled the House of Representatives and Senate, respectively. The bottom 25 percent of citizens does worse than a coin flip when it comes to political knowledge—they are systematically in error.”[ref]Jason Brennan, The Ethics of Voting (Princeton, NJ: Princeton University Press, 2011), 164.[/ref] When it comes to the demographics of these quartiles, political knowledge within the U.S.
is strongly positively correlated with having a college degree, but negatively correlated with having a high school diploma or less. It is positively correlated with being in the top half of income earners, but negatively correlated with being in the bottom half. It is strongly positively correlated with being in the top quarter of income earners, and strongly negatively correlated with being in the bottom quarter. It is positively correlated with living in the western United States, and negatively correlated with living in the South. Political knowledge is positively correlated with being or leaning Republican, but negatively correlated with being a Democrat or leaning independent. It is positively correlated with being between the ages of thirty-five and fifty-four, but negatively correlated with other ages. It is negatively correlated with being black, and strongly negatively correlated with being female.[ref]Brennan, Against Democracy, 33.[/ref]
Legal scholar Ilya Somin’s work scours both the academic literature as well as a sweeping array of public surveys, including (but not limited to) the Annenberg Public Policy Center, Kaiser Health Tracking Poll, Pew Research Center, Bloomberg, Public Policy Research Institute, Reason-Rupe, and American National Election Studies. Voter ignorance is not merely in regards to “specific policy issues but about the basic structure of government and how it operates.”[ref]Ilya Somin, Democracy and Political Ignorance: Why Smaller Government is Smarter, 2nd ed. (Stanford, CA: Stanford University Press, 2016), 20.[/ref] He concludes, “Extensive evidence suggests that most Americans have little political knowledge. That ignorance covers knowledge of specific issues, knowledge of political leaders and parties, and knowledge of political institutions. The evidence extends to many of the crucial issues at stake in recent elections from 2000 to 2014. Moreover, much of the widespread ignorance relate to fairly basic issues about the politicians, parties, issues, and the structure of politics.”[ref]Ibid., 46.[/ref]
Relying on the 1996 Survey of Americans and Economists on the Economy (SAEE), GMU economist Bryan Caplan compares (1) the average belief of the general public on economic issues, (2) the average belief of Ph.D. economists, and (3) the estimated belief of a category Caplan labels the Enlightened Public. This latter category is the result of Caplan testing for both “self-serving” and “ideological” bias among economists by controlling for family income, job security, race, gender, age, and income growth. The Enlightened Public essentially are the answers to the questions “What would the average person believe if he had a Ph.D. in economics?” or “What would Ph.D. economists believe if their finances and political ideology matched those of the average person?”[ref]Bryan Caplan, The Myth of the Rational Voter: Why Democracies Choose Bad Policies (Princeton, NJ: Princeton University Press, 2007), 55.[/ref] Caplan discovers that the answers of economists/Enlightened Public differ greatly from the general public on most economic issues. For example, the general public is far more concerned about the supposed negative economic effects of taxes, foreign aid, immigration, business tax breaks, the number of people on welfare, affirmative action, business profits, executive compensation, technology in the workplace, job outsourcing, and corporate downsizing.[ref]Ibid., Ch. 3.[/ref] Caplan’s controls and comparisons indicate that (1) economic information and education changes one’s views about economic issues and (2) the general public is lacking in these qualifications. This gap between economists and the general public is further confirmed by a 2013 study by Paola Sapienza and Luigi Zingales.[ref]Paola Sapienza, Luigi Zingales, “Economic Experts versus Average Americans,” American Economic Review: Papers & Proceedings 103:3 (2013): 636-642.[/ref] Drawing on the Economic Expert Panel (EEP) and Financial Trust Index (FTI)—both from the University of Chicago—the researchers find that, “[o]n average, the percentage of agreement with a statement differs 35 percentage points between the two groups.”[ref]Ibid.: 637.[/ref]
Despite the strong consensus on the typical American’s political ignorance, Arthur Lupia of the University of Michigan is skeptical of the explanatory power of these survey data. He argues that in many cases, it is “not demonstrate[d] that recalling the items on [the] survey is a necessary condition for achieving high-value social outcomes”[ref]Lupia, Uninformed, 204.[/ref] and, therefore, not a good standard for measuring relevant political knowledge. He also questions the legitimacy of the American National Election Studies, showing that obviously correct answers were sometimes marked as incorrect due to an overly-rigid grading system.[ref]Ibid., 206-212.[/ref] Finally, he notes that “decades of surveys and experiments provide evidence that “don’t know” responses are mixtures of several factors. Ignorance is one such factor. Low motivation, personality, and gender also affect responses.”[ref]Ibid., 216.[/ref] However, Achens and Bartels point out that “insufficient motivation is endemic to mass politics, not an artifact of opinion surveys[.]”[ref]Achens & Bartels, Democracy for Realists, 37.[/ref] Furthermore, they hold Lupia’s feet to the fire for the vagueness of statements like “high-quality decisions” or “high-value social outcomes.”[ref]Ibid., 72-78.[/ref] Uninformed voters are supposedly capable of these things, yet Lupia provides no concrete examples. Brennan also argues that public polls actually overstate how much Americans really know about politics and policy. The first reason is because these polls “usually take the form of a multiple-choice test. When many citizens do not know the answer to a question, they guess. Some of them get lucky, and the surveys mark them as knowledgeable.” These polls “count a citizen as knowledgeable if they know that we spend more on social security than defense, but they typically don’t check if they know how much more we spend.” Finally, these questions are about “easily verifiable facts…While most voting Americans cannot answer such questions, these questions do not require specialized social scientific knowledge.”[ref]Jason Brennan, Against Democracy, 28.[/ref] Unfortunately, greater question complexity is associated with greater ignorance. According to Carpini and Keeter, “as the amount of detail requested increases and as less visible institutions or processes are asked about, the percentage of the public able to correctly answer questions declines.”[ref]Carpini & Keeter, What Americans Know, 72.[/ref]
In sum, the scholarly consensus appears to recognize that the average American citizen knows very little about the major players, institutions, and processes of their government. What’s more, there is a significant gap between expert views on policy-related issues and that of the average American.
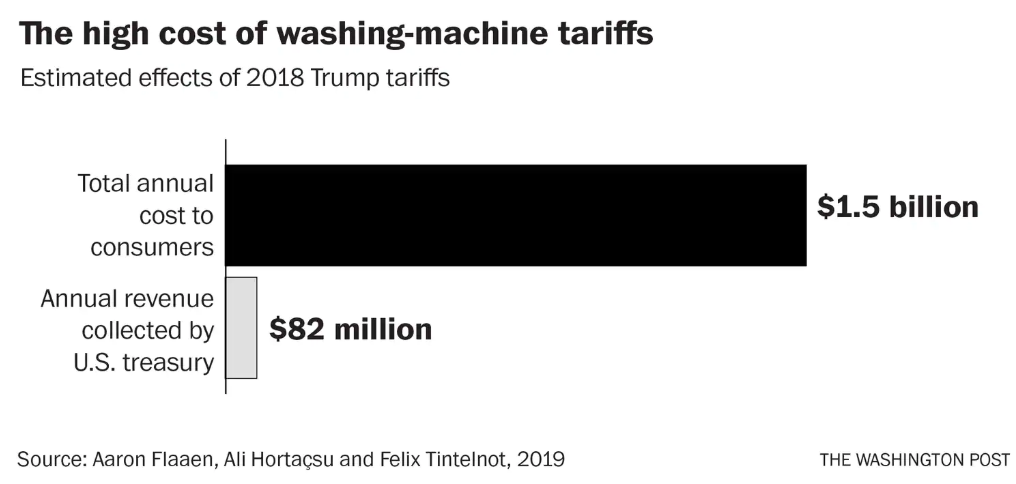
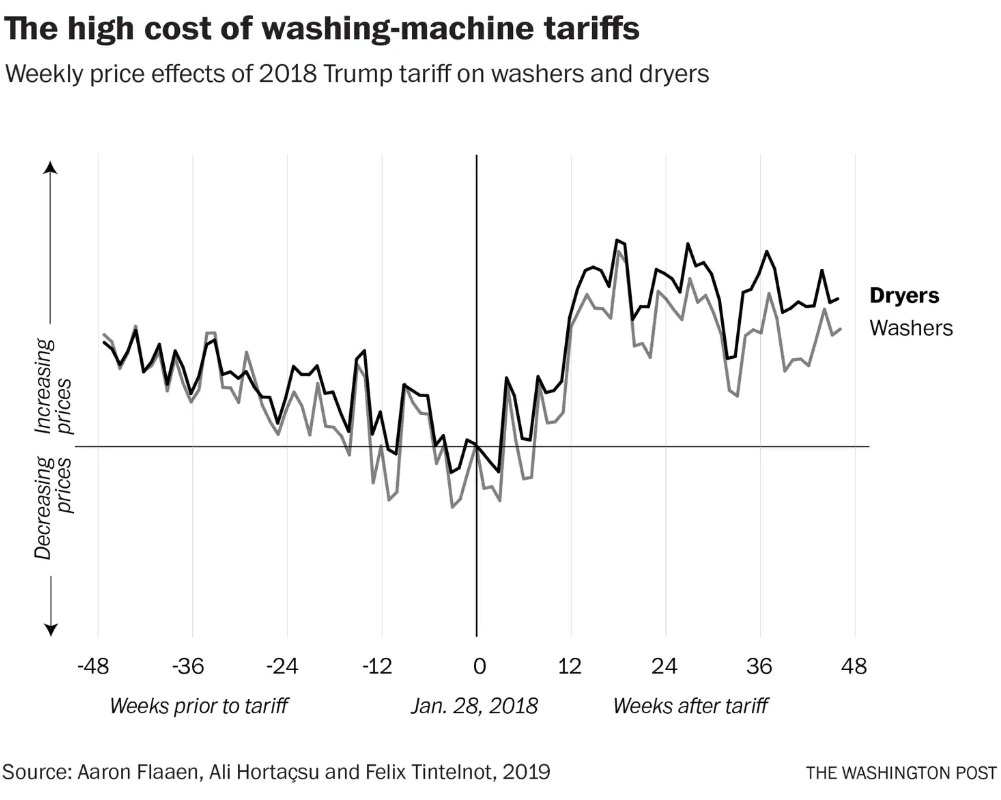
All told, the research shows, U.S. consumers are spending an additional $1.5 billion a year on washers and dryers as a result of the tariffs. That’s an extra $86 for each washing machine and $92 for each dryer, the authors estimate. And less than 10 percent of that goes to the U.S. treasury — about $82.2 million — the study showed…Foreign manufacturers are passing some costs on to consumers, while domestic ones are simply pocketing extra profits, according to the study.
…Manufacturers also capitalized on buyer habits when they bumped up the price of dryers, which were not subject to the tariffs. “Many consumers buy these goods in a bundle,” Tintelnot said. “Part of the price increase for washers was hidden by increasing the price of dryers.”
In sum, “U.S. consumers shouldered 125 to 225 percent of the costs of the washing-machine tariffs. And the duty was mostly a dud on the job-creation front,” costing consumers about $815,000 for every one of the 1,800 jobs created.
As theory would suggest, we find robust evidence that the impact of the minimum wage depends on how close a restaurant is to the margin of exit, proxied by its rating. Looking at city-level minimum wage changes in the San Francisco Bay Area (the “Bay Area”), we present two main findings. First, at all observed minimum wage levels, restaurants with lower ratings are more likely to exit, suggesting that they are less efficient in the economic sense. Moreover, lower rated restaurants are disproportionately affected by minimum wage increases. In other words, the impact of the minimum wage on exit is most pronounced among restaurants that are closer to the margin of exit.
…Our results suggest that a $1 increase in the minimum wage leads to an 14 percent increase in the likelihood of exit for the median 3.5-star restaurant, but no impact for five-star restaurants (the point estimate is in fact negative, suggesting that the likelihood of exit might even decrease for five-star restaurants, but the estimate is not statistically different from zero). These effects are robust to a number of different specifications, including controlling for time-varying county characteristics that may influence both minimum wage policies and restaurant demand, city-specific time trends to account for preexisting trends, as well as county-year fixed effects to control for spatial heterogeneity in exit trends.
…Overall, our findings shed on the economic impact of the minimum wage. Basic theory predicts that the minimum wage will cause firms that cannot adjust in other ways to cover their increased costs to exit the market. We find that lower rated firms (which are already closer to the margin of exit) are disproportionately impacted by the minimum wage. After a minimum wage increase, they are more likely to exit the market altogether and more likely to raise their prices (pg. 2-5).
This matches previous research, which finds that labor-intensive restaurants tend to exit and make room for capital-intensive restaurants.[ref]This same research finds that consumers bear the costs of minimum wage hikes (as my last post also showed). Lastly, the authors found “a short-run disemployment effect of just under −0.1 that likely grows by three to five times in the long run” (pg. 71).[/ref]
Most firms responded to the minimum wage by raising wages instead of destroying jobs. Our estimates imply that out of 290 thousand minimum wage workers in Hungary, around 30 thousand (0.076% of aggregate employment) lost their job, while the remaining 260 thousand workers experienced a 60% increase in their wages. As a result, firms employing minimum wage workers experienced a large increase in their total labor cost that was mainly absorbed by higher output prices and higher total revenue. We also estimated that firms substituted labor with capital and their profits fell slightly. These results suggest that the incidence of the minimum wage fell mainly on consumers. Given the relatively small effect on employment, our results also suggest that minimum wages can redistribute income from consumers to low-wage workers without large efficiency losses. Our findings also indicate that the optimal level of the minimum wage is likely to vary across industries,cities and countries. In countries where low-wage jobs are concentrated in the local service sector (such as Germany or the U.S.) raising the minimum wage is likely to cause limited disemployment effects or efficiency losses. Moreover, in cities where mainly rich consumers enjoy the services provided by low wage workers this redistribution will be from rich to poor. The heterogenous responses across industries also underline the advantages of sector-specific minimum wage polices used in some European countries such as Italy or Austria. For instance, setting a higher minimum wage in the non-tradable sector than in the tradable sector can push up wages relatively more where it will generate more modest disemployment effects (pg. 23-24).
Passing the costs on to consumers fits with previous evidence. This also makes evident that the kind of industry (e.g., tradable vs. non-tradable) also matters when it comes to positive/negative effects of the minimum wage.[ref]One of the study’s authors has found this elsewhere as have other scholars.[/ref]
1. Do you feel that a country can thrive in an insular or isolated capacity? Is exchanges needed for a country to be successful? Do you see any examples of countries who have been reluctant to adopt new ideologies or integration?
2. What did we learn from the Columbian exchange that would be applicable to modern day society?
The Stuff I Said
1. While I think a country can thrive to some extent in isolation depending on a number of factors, it will not thrive as much as it couldhave had it been integrated into a larger exchange network. An extreme historical case is Tasmania: when the island was cut off from the mainland by rising sea levels, the population not only failed to progress, but actually regressed. Anthropologist Joseph Henrich surveyed the archaeological evidence and found that the isolation caused Tasmanians to lose a number of skills and technologies they had once possessed, including bone tools, cold-weather clothing, nets, fishing spears, barbed spears, etc. Even their canoeing skills and technologies worsened. Beyond comparative advantage, trade leadstoinnovation (what author Matt Ridley calls “ideas having sex”). And it is innovation–technological innovation in particular–that truly transforms standards of living.
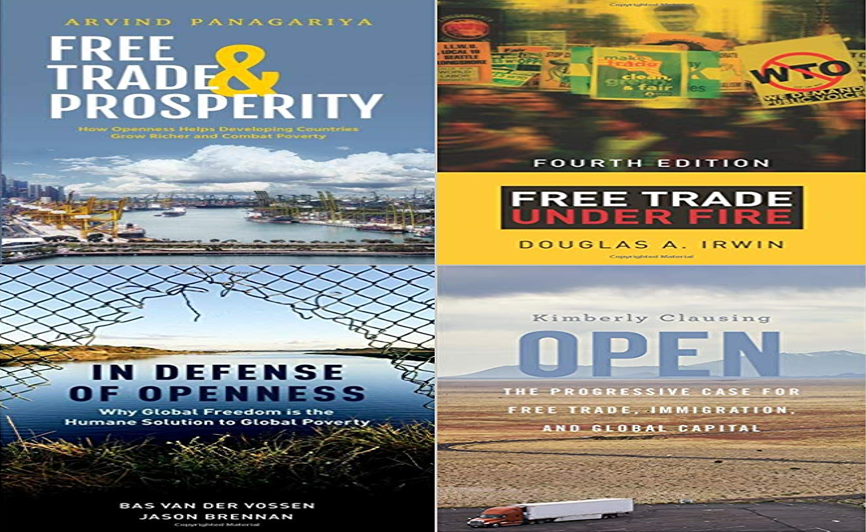
Protectionism and isolationism have had a bit of a global resurgence lately, but these positions fly in the face of the expert consensus as far as economic welfare is concerned (check out the survey data on tariffs at the bottom of the post). This populist backlash to globalization led to a string of recent academic books empirically and philosophically defending economic openness:
2. I’ll rely on Nobel laureate Angus Deaton for the next question:
The historian Ian Morris has described how increased trade around the second century CE merged previously separate disease pools that, since the beginning of agriculture, had evolved in the West, South Asia, and East Asia, “as if they were on different planets.” Catastrophic plagues broke out in China and in the eastern outposts of the Roman Empire. The Columbian exchange after 1492 is an even better-known example. Many historical epidemics started from new trade routes or new conquests.
…Yet globalization also opens its routes to the enemies of disease. We have already seen how the germ theory of disease–a set of ideas and practices developed in the North–spread rapidly to the rest of the world after 1945. Knowledge about drugs to control high blood pressure spread rapidly across the world after 1970, producing…synchronized declines in mortality…That cigarette smoking caused cancer did not have to be rediscovered country by country. While the origins of HIV/AIDS are in dispute, there is no dispute about its rapid spread from one continent to another. The scientific response–the discovery of the virus, the deduction of its means of transmission, and the development of chemotherapy that is transforming the disease from a fatal to a chronic condition–was extraordinarily rapid by historical standards, although hardly rapid enough for the millions who died as they waited. Today’s understanding of the disease, although still incomplete, has underpinned the response–not just in the rich world–and in the worst affected African countries rates of new infection have fallen in the past few years, and life expectancy is beginning to rise again (The Great Escape, pg. 150-151).
Acemoglu et al argue that inefficient institutions persist for a number of major reasons. First, the lack of third-party enforcement of commitments prevents elites from relinquishing their monopoly on political power. Furthermore, the beneficiaries of the economic status quo are usually unwilling to risk their economic welfare through competition. This leads them to promote protectionism and further engage in rent-seeking activities. Institutions that encourage these kinds of activities fail to grow. We see this kind of conflict manifest in various areas of the economy, from labor and financial markets to regulations in pricing. The more institutions concentrate political power in the hands of the few, the more incentives are warped and distort paths to economic growth.
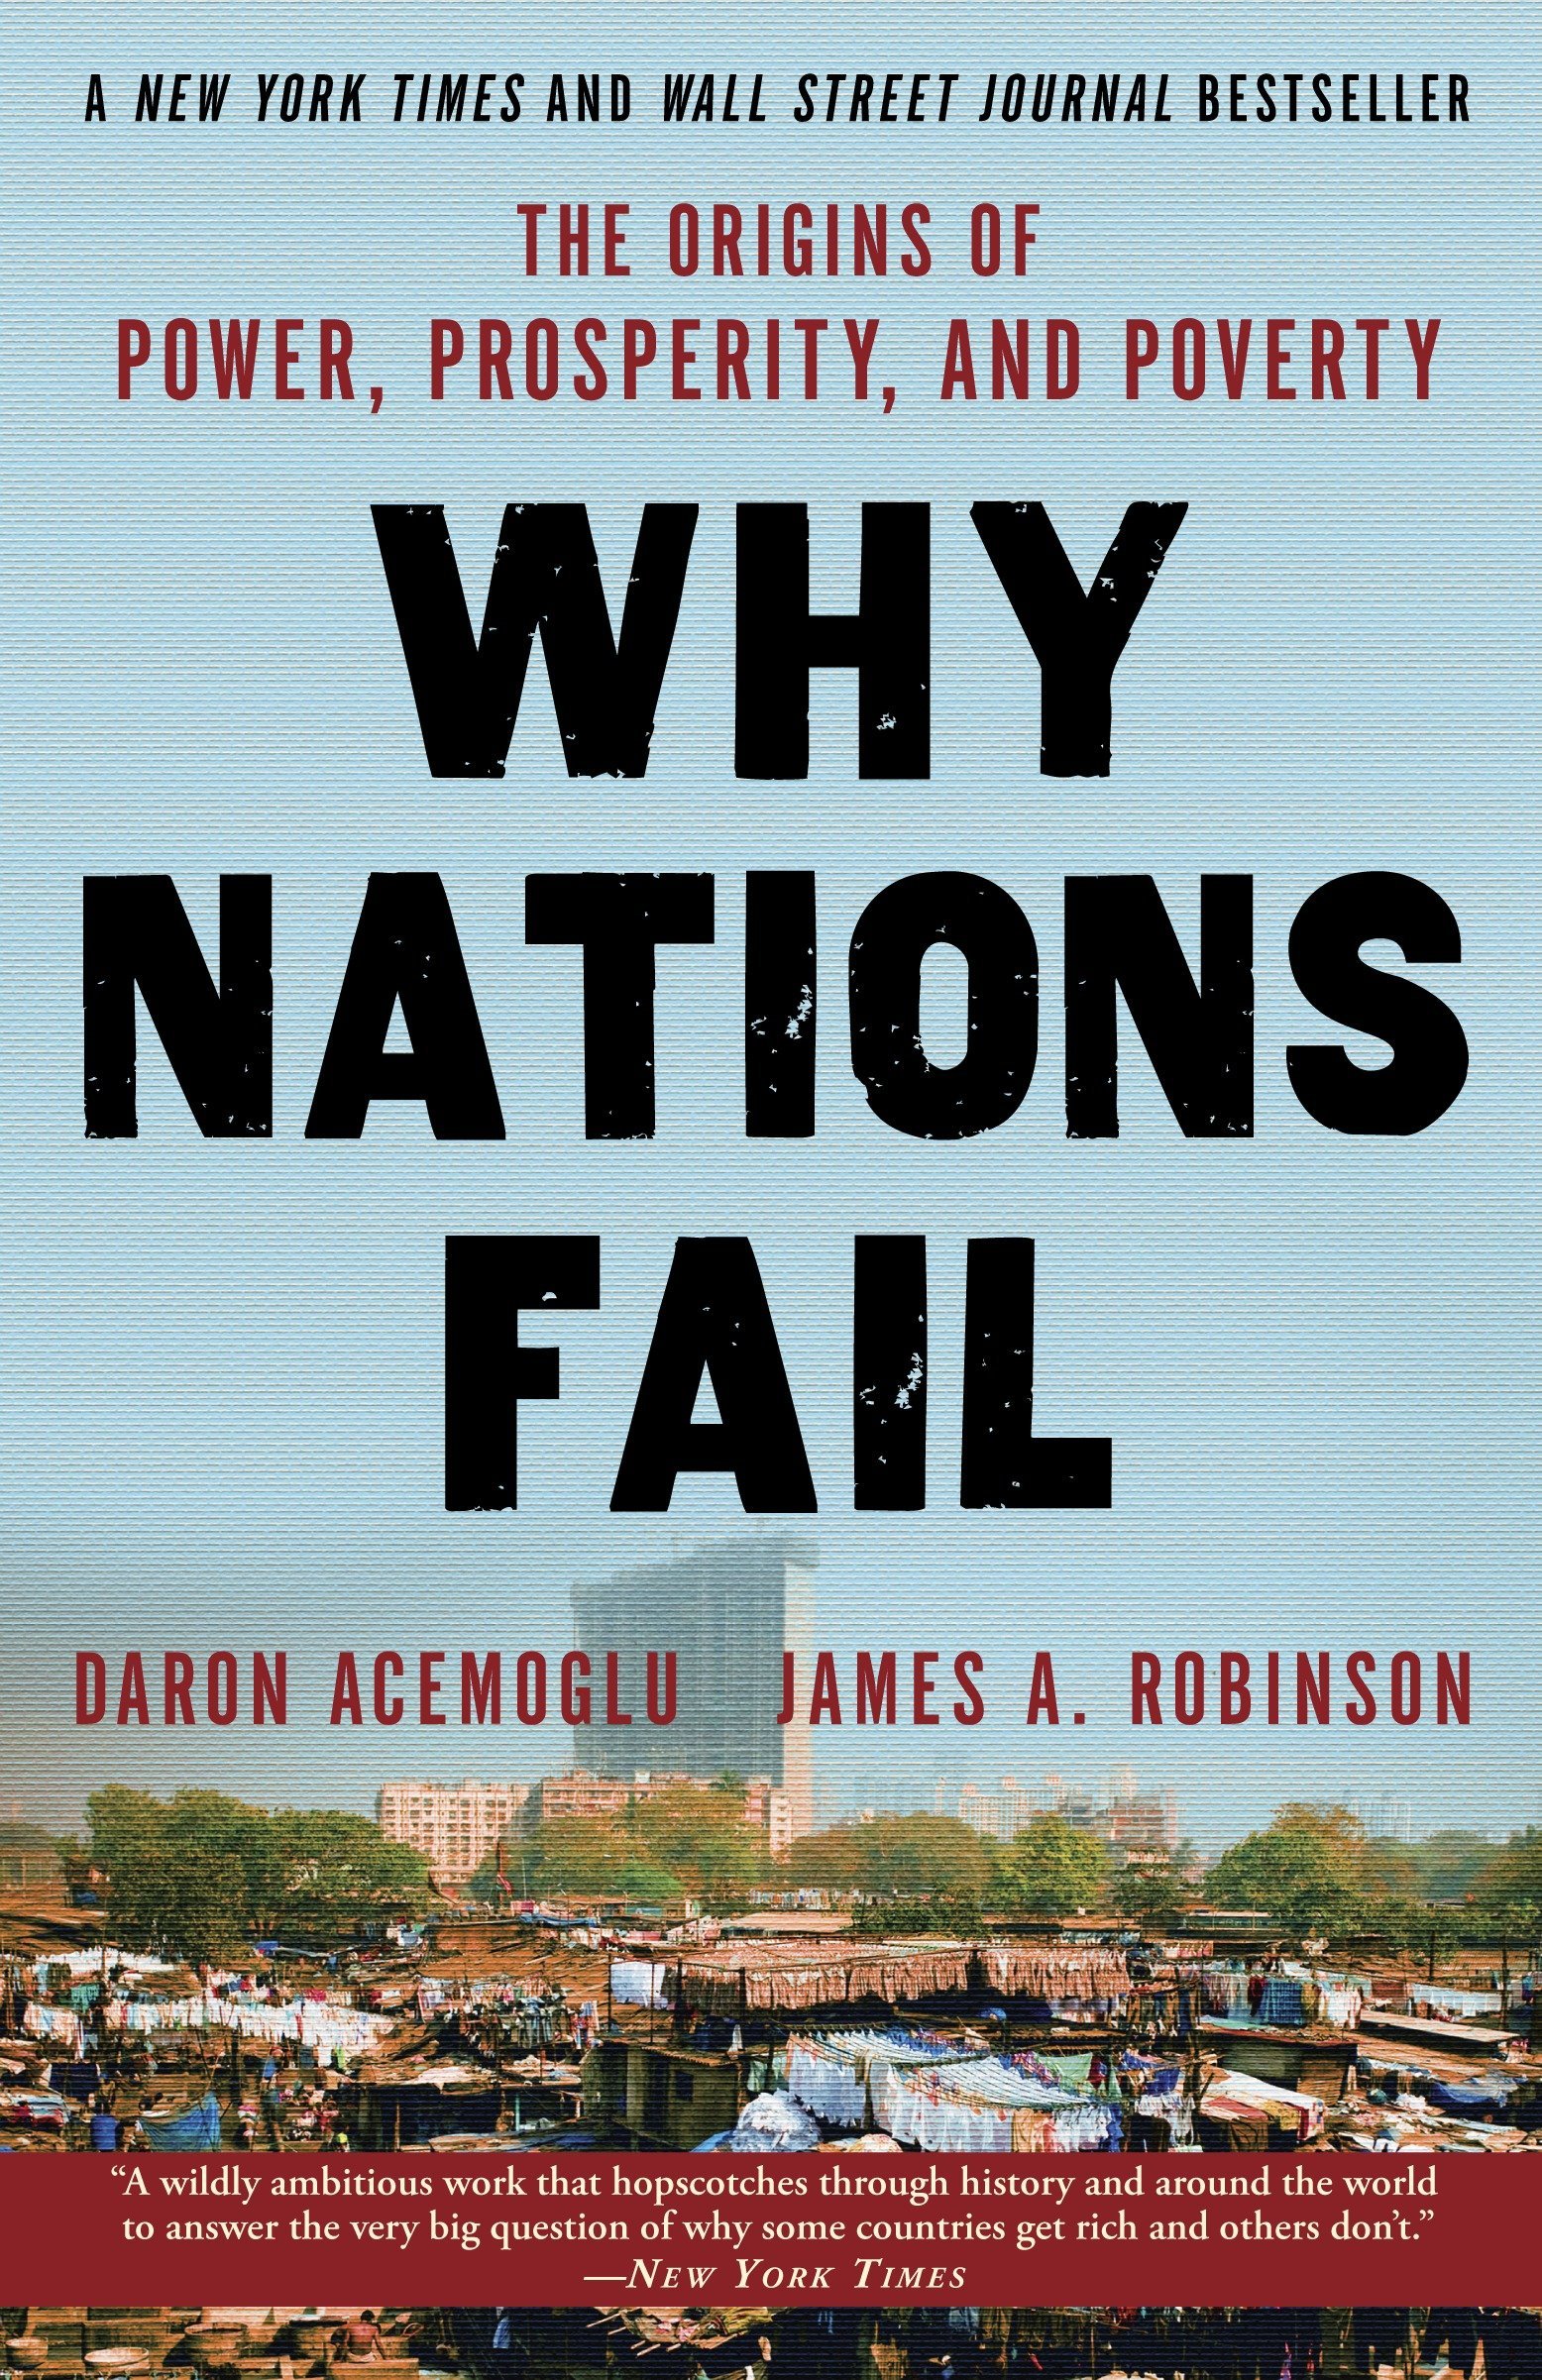
In their book Why Nations Fail: The Origins of Power, Prosperity, and Poverty, Daron Acemoglu and James Robinson distinguish between inclusive and extractive institutions, with the former creating the conditions for prosperity. “Inclusive economic institutions,” they write,
…are those that allow and encourage participants by the great mass of people in economic activities that make best use of their talents and skills and that enable individuals to make the choices they wish. To be inclusive, economic institutions must feature secure private property, an unbiased system of law, and a provision of public services that provides a level playing field in which people can exchange and contract; it also must permit the entry of new business and allow people to choose their careers…Inclusive economic institutions foster economic activity, productivity growth, and economic prosperity (pg. 74-75).
On the other hand, extractive economic institutions lack these properties and instead “extract incomes and wealth from one subset of society to benefit a different subset,” empowering the few at the expense of the many (pg. 76).
The importance of getting institutions right is highlighted by Rodrik and Subramanian’s study. Three theoretical culprits have been blamed for the vast income inequality between countries: (1) geography, (2) integration (globalization, international trade), and (3) institutions. Regression analyses indicate that institutions trump all other explanations. This is also shown from the outset of Acemoglu and Robinson’s Why Nations Fail, in their story of Nogales, Arizona (United States of America) and Nogales, Sonora, (Mexico). Acemoglu and Robinson lay out their archetype story of two towns with the same essential culture, geography, and relative free trade (NAFTA), in most ways they are the same place. The only reason they are two towns is an institutional barrier between two separate countries. Yet one is rich and one is poor because of institutions. The direct effects of geography are weak at best, while there were no direct effects from integration. However, there were indirect effects of integration: institutions have significant, positive effects on integration, while integration has a positive impact on institutions. This, in some sense, creates a virtuous, growth-enhancing cycle. Rodrik and Subramanian point out that the institutional factors emphasized the most have largely been market-oriented (e.g., property rights, enforceable contracts). Yet, factors such as regulation, financial stabilization, and social insurance also matter in getting institutions right.
The interaction between political and economic institutions is an important insight. For example, even though mostresearch finds that seemingly liberal political institutions like democracy have no direct impact on economic growth, more recent evidence from Acemoglu and colleagues suggests that they may in fact contribute to growth. What’s more, the evidence strongly suggests that economic openness—particularly international trade—contributes to growth.[ref]David N. Weil, Economic Growth, 3rd ed. (New York: Pearson, 2013), Ch. 11.[/ref] A 2010 study used data from 131 developed and developing countries and found that reductions in trade protections led to higher levels of income per capita. A World Bank study found that between 1950 and 1998, “countries that liberalized their trade regimes experienced average annual growth rates that were about 1.5 percentage points higher than before liberalization. Postliberalization investment rates rose 1.5-2.0 percentage points, confirming past findings that liberalization fosters growth in part through its effect on physical capital accumulation…Trade-centered reforms thus have significant effects on economic growth within countries” (pg. 212). A 2016 IMF paper found that trade liberalization boosts productivity through increased competition and greater variety and quality of inputs. All this suggests that Sachs and Warner were correct when they found “that open policies together with other correlated policies were sufficient for growth in excess of 2 percent during 1970-89” (pg. 45; fn. 61). Their findings also suggest “that property rights, freedom, and safety from violence are additional determinants of growth” (pg. 50). Acemoglu and Robinson in a 2005 paper found “robust evidence that property rights institutions have a major influence on long-run economic growth, investment, and financial development, while contracting institutions appear to affect the form of financial intermediation but have a more limited impact on growth, investment, and the total amount of credit in the economy” (pg. 988).
In short, inclusive institutions are necessary to fully reap the benefits of an open economy.
As another Bible dictionary clarifies, “Though Leviticus 25 does not explicitly discuss debt cancellation, the return of an Israelite to his land plus the release of slaves implies the cancellation of debts that led to slavery or the loss of land.”
So does Warren’s plan benefit “the marginalized”?
According to Adam Looney at the Brookings Institution, Warren’s proposal is “regressive, expensive, and full of uncertainties…[T]he top 20 percent of households receive about 27 percent of all annual savings, and the top 40 percent about 66 percent. The bottom 20 percent of borrowers by income get only 4 percent of the savings. Borrowers with advanced degrees represent 27 percent of borrowers, but would claim 37 percent of the annual benefit.”
He continues,
Debt relief for student loan borrowers, of course, only benefits those who have gone to college, and those who have gone to college generally fare much better in our economy than those who don’t. So any student-loan debt relief proposal needs first to confront a simple question: Why are those who went to college more deserving of aid than those who didn’t? More than 90 percent of children from the highest-income families have attended college by age 22 versus 35 percent from the lowest-income families. Workers with bachelor’s degrees earn about $500,000 more over the course of their careers than individuals with high school diplomas. That’s why about 50 percent of all student debt is owed by borrowers in the top quartile of the income distribution and only 10 percent owed by the bottom 25 percent. Indeed, the majority of all student debt is owed by borrowers with graduate degrees.
Drawing on 2016 data from the Federal Reserve’s Survey of Consumer Finances, Looney’s final analysis
shows that low-income borrowers save about $569 in annual payments under the proposal, compared to $900 in the top 10 percent and $2,653 in the 80th to 90th percentiles. Examining the distribution of benefits, top-quintile households receive about 27 percent of all annual savings, and the top 40 percent about 66 percent. The bottom 20 percent of borrowers by income get 4 percent of the savings…[W]hile households headed by individuals with advanced degrees represent only 27 percent of student borrowers, they would claim 37 percent of the annual savings. White-collar workers claim roughly half of all savings from the proposal. While the Survey of Consumer Finances does not publish detailed occupational classification data, the occupational group receiving the largest average (and total) amount of loan forgiveness is the category that includes lawyers, doctors, engineers, architects, managers, and executives. Non-working borrowers are, by and large, already insured against having to make payments through income-based repayment or forbearances; most have already suspended their loan payments. While debt relief may improve their future finances or provide peace of mind, it doesn’t offer these borrowers much more relief than that available today.
I’m not sure whether or not Warren’s plan is a good one (I’m skeptical, especially given some of the results abroad). But I’m not big on acting like college graduates in a rich country are the marginalized of society.