I’ve lamented about this before. Funny enough, it was largely about the same source: The Guardian. A recent piece suggests that “neoliberalism” is responsible for, in the words of Forbes‘ Tim Worstall, the destruction of “everything that is good and holy about society.” This is based on a new IMF study that reviews the following:
Our assessment of the agenda is confined to the effects of two policies: removing restrictions on the movement of capital across a country’s borders (so-called capital account liberalization); and fiscal consolidation, sometimes called “austerity,” which is shorthand for policies to reduce fiscal deficits and debt levels. An assessment of these specific policies (rather than the broad neoliberal agenda) reaches three disquieting conclusions:
•The benefits in terms of increased growth seem fairly difficult to establish when looking at a broad group of countries.
•The costs in terms of increased inequality are prominent. Such costs epitomize the trade-off between the growth and equity effects of some aspects of the neoliberal agenda.
•Increased inequality in turn hurts the level and sustainability of growth. Even if growth is the sole or main purpose of the neoliberal agenda, advocates of that agenda still need to pay attention to the distributional effects.
In other words, it worries about financial openness and austerity. However, The Guardian describes it as such:
Three senior economists at the IMF, an organisation not known for its incaution, published a paper questioning the benefits of neoliberalism. In so doing, they helped put to rest the idea that the word is nothing more than a political slur, or a term without any analytic power. The paper gently called out a “neoliberal agenda” for pushing deregulation on economies around the world, for forcing open national markets to trade and capital, and for demanding that governments shrink themselves via austerity or privatisation. The authors cited statistical evidence for the spread of neoliberal policies since 1980, and their correlation with anaemic growth, boom-and-bust cycles and inequality.
Unfortunately for the author, that’s not quite accurate. The IMF researchers actually say,
There is much to cheer in the neoliberal agenda. The expansion of global trade has rescued millions from abject poverty. Foreign direct investment has often been a way to transfer technology and know-how to developing economies. Privatization of state-owned enterprises has in many instances led to more efficient provision of services and lowered the fiscal burden on governments.
Perhaps The Guardian author needs to be reminded that the IMF came out against protectionism last year in the midst of anti-trade rhetoric from politicians. Similarly, it released a report around the same time extolling the benefits of trade. Furthermore, the new IMF study qualifies its concerns:
The link between financial openness and economic growth is complex. Some capital inflows, such as foreign direct investment—which may include a transfer of technology or human capital—do seem to boost long-term growth. But the impact of other flows—such as portfolio investment and banking and especially hot, or speculative, debt inflows—seem neither to boost growth nor allow the country to better share risks with its trading partners (Dell’Ariccia and others, 2008; Ostry, Prati, and Spilimbergo, 2009). This suggests that the growth and risk-sharing benefits of capital flows depend on which type of flow is being considered; it may also depend on the nature of supporting institutions and policies.
…In sum, the benefits of some policies that are an important part of the neoliberal agenda appear to have been somewhat overplayed. In the case of financial openness, some capital flows, such as foreign direct investment, do appear to confer the benefits claimed for them. But for others, particularly short-term capital flows, the benefits to growth are difficult to reap, whereas the risks, in terms of greater volatility and increased risk of crisis, loom large.
This doesn’t strike me as a denunciation of “neoliberalism.” I’m going to follow Worstall’s lead on this one and refer to Max Roser’s work.

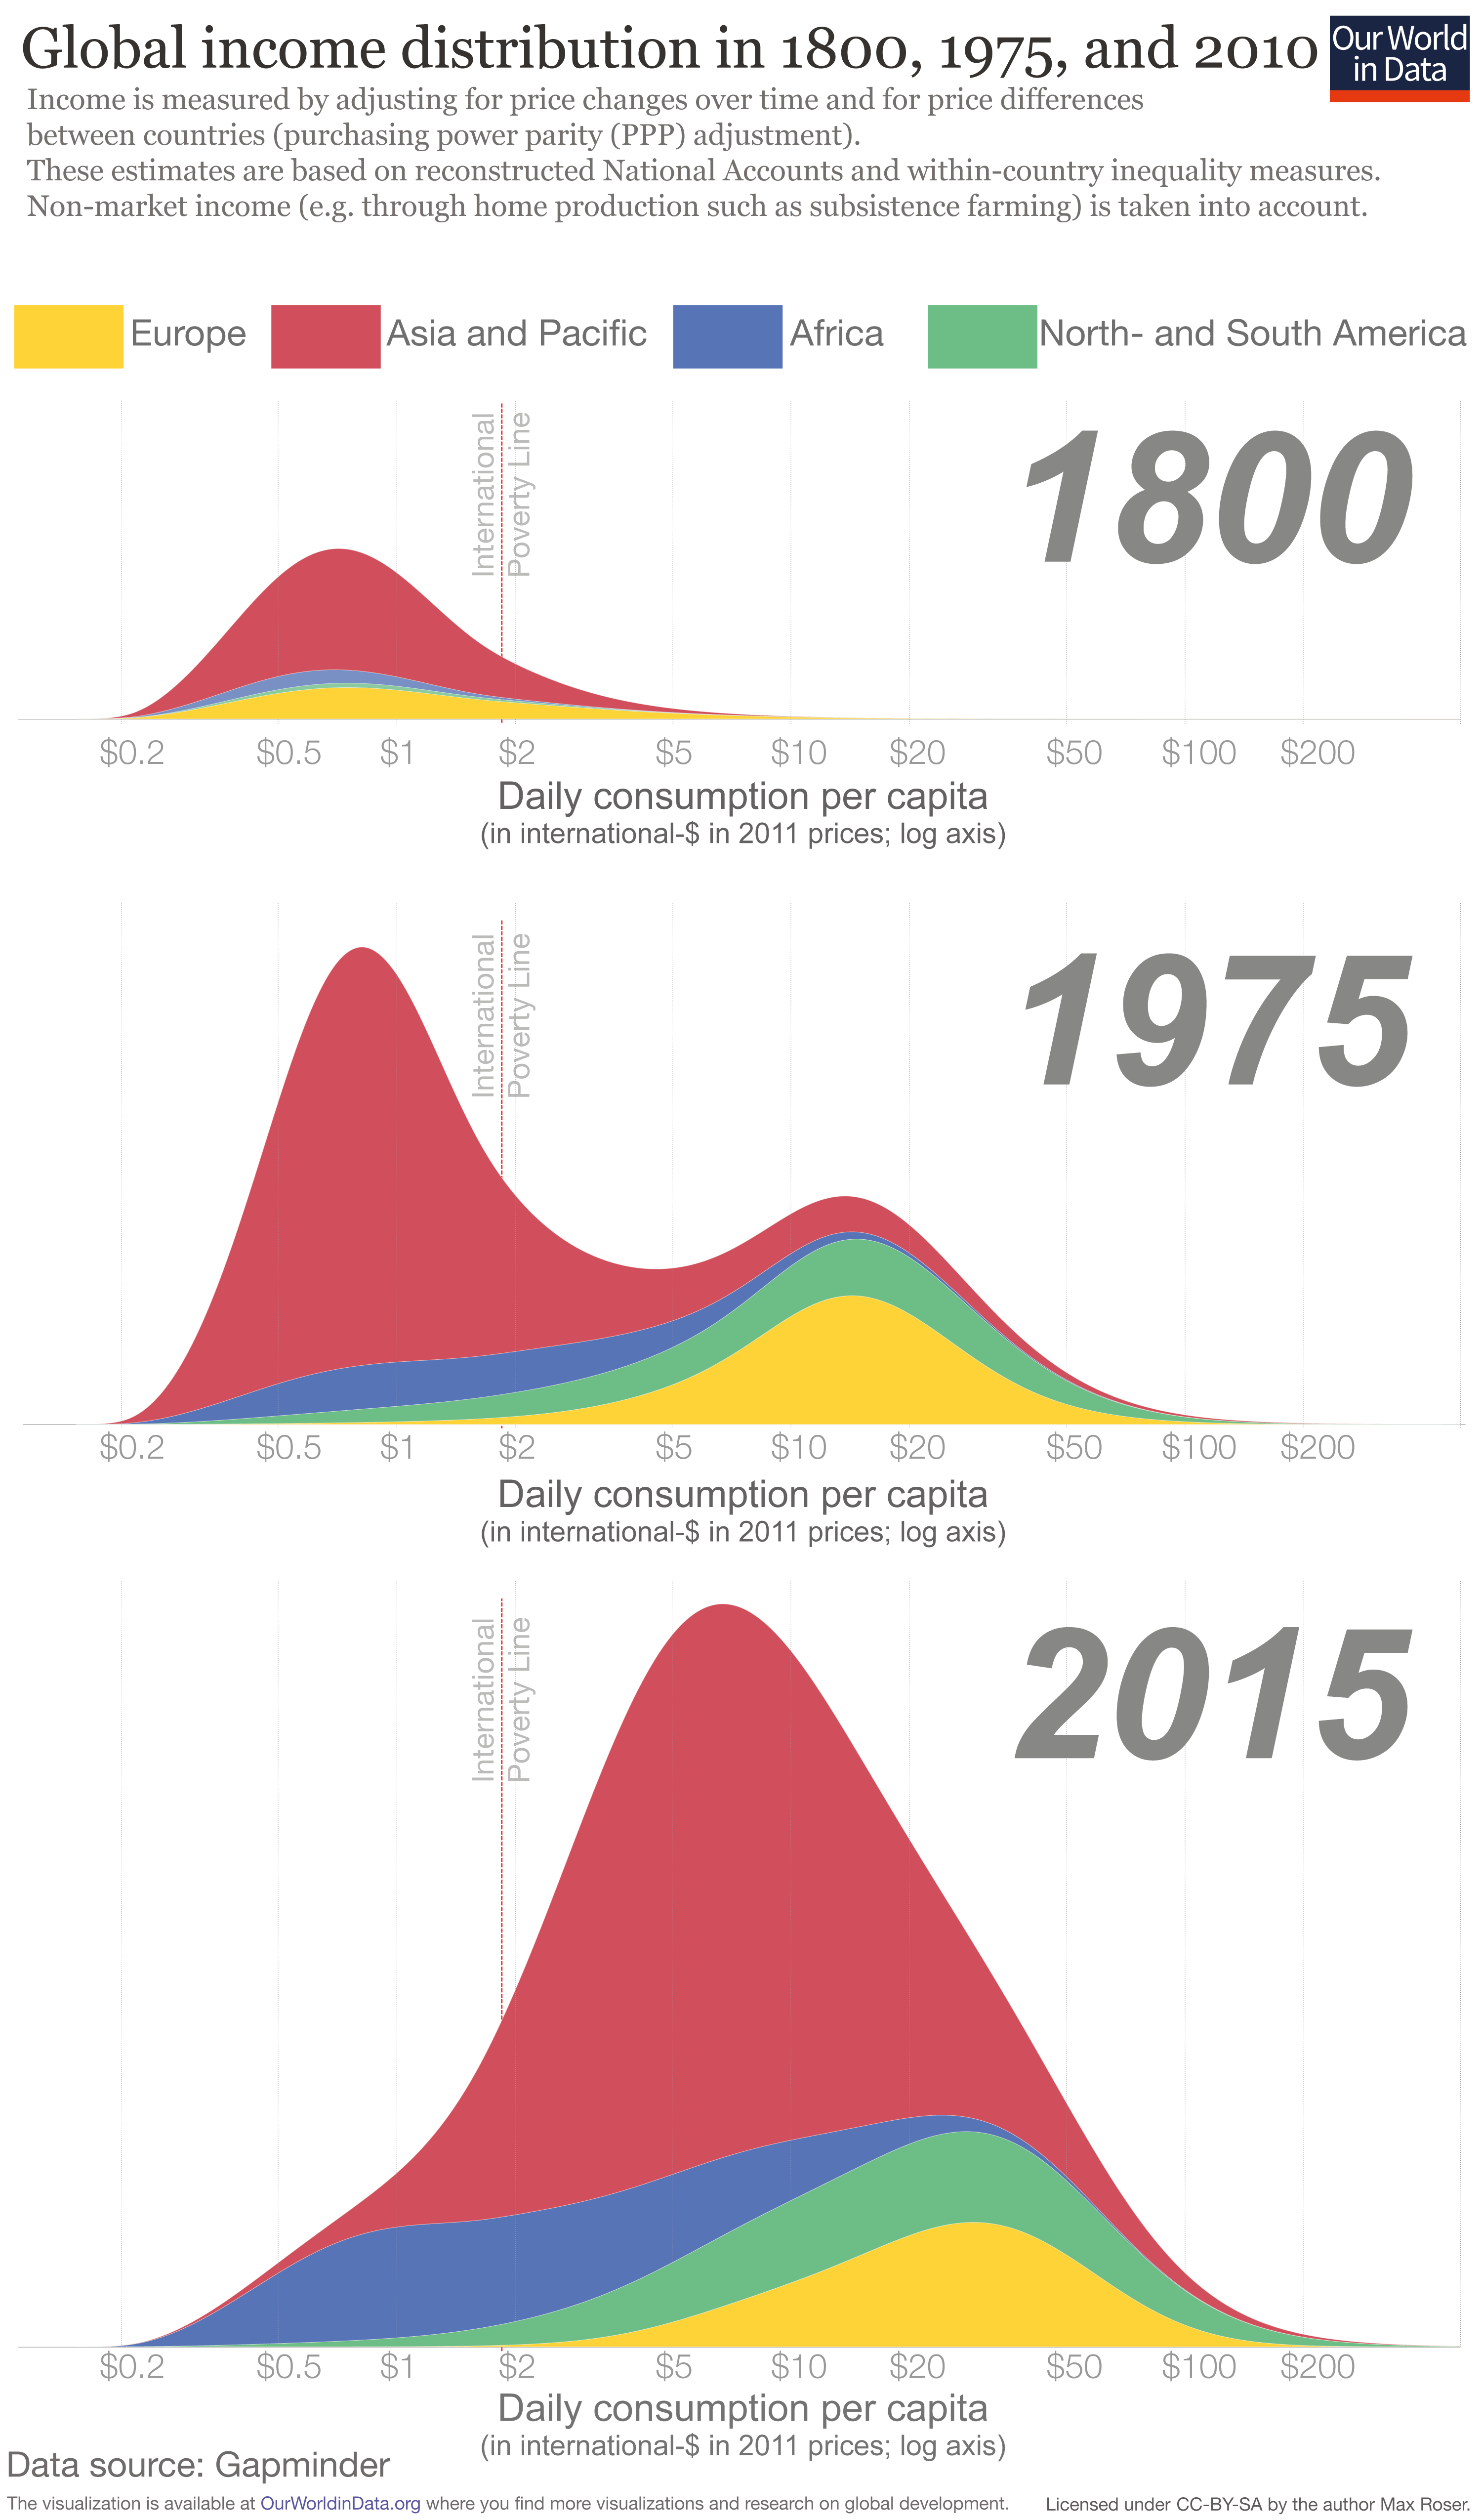
The distribution of incomes is shown at 3 points in time:
-
In 1800 only few countries achieved economic growth. The chart shows that the majority of the world lived in poverty with an income similar to the poorest countries in today. Our entry on global extreme poverty shows that at the beginning of the 19th century the huge majority – more than 80% – of the world lived in material conditions that we would refer to as extreme poverty today.
-
In the year 1975, 175 years later, the world has changed – it became very unequal. The world income distribution has become bimodal. It has the two-humped shape of a camel. One hump below the international poverty line and a second hump at considerably higher incomes – the world was divided into a poor developing world and a more than 10-times richer developed world.
-
Over the following 4 decades the world income distribution has again changed dramatically. The poorer countries, especially in South-East Asia, have caught up. The two-humped “camel shape” has changed into a one-humped “dromedar shape”. World income inequality has declined. And not only is the world more equal again, the distribution has also shifted to the right – the incomes of the world’s poorest citizens have increased and poverty has fallen faster than ever before in human history.
That’s right: global inequality is decreasing. The World Bank reports,
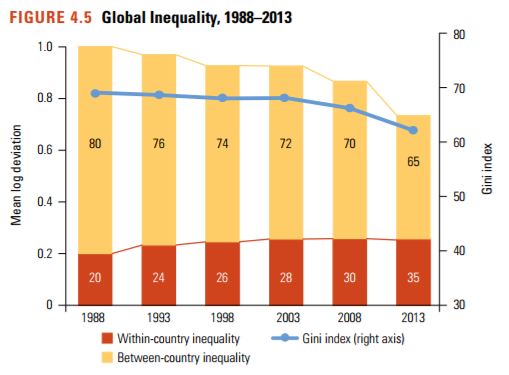
Globally, there has been a long-term secular rise in interpersonal inequality. Figure 4.3 shows the global Gini index since 1820, when relevant data first became available. The industrial revolution led to a worldwide divergence in incomes across countries, as today’s advanced economies began pulling away from others. However, the figure also shows that, in the late 1980s and early 1990s, the global Gini index began to fall. This coincided with a period of rapid globalization and substantial growth in populous poor countries, such as China and India.
…Global inequality has diminished for the first time since the industrial revolution. The global Gini index rose steadily by around 15 Gini points between the 1820s and the early 1990s, but has declined since then (see figure 4.3). While the various methodologies and inequality measures show disagreement over the precise timing and magnitude of the decline, the decline since the middle of the last decade is confirmed across multiple sources and appears robust. The estimates
presented in figure 4.5 show a narrowing in global inequality between 1988 and 2013. The Gini index of the global distribution (represented by the blue line) fell from 69.7 in 1988 to 62.5 in 2013, most markedly since 2008 (when the global Gini index was 66.8). Additional exercises confirm that these results are reasonably robust, despite the errors to which the data are typically subject (pg. 76, 81).
Harvard’s Andrei Shleifer has shown that between 1980 and 2005, world per capita income grew about 2% per year. During these 2.5 decades, serious hindrances on economic freedom declined, including the world median inflation rate, the population-weighted world average of top marginal income tax rates, and the world average tariff rates. “In the Age of Milton Friedman,” summarizes Shleifer, “the world economy expanded greatly, the quality of life improved sharply for billions of people, and dire poverty was substantially scaled back. All this while the world embraced free market reforms” (pg. 126).
Go away Guardian.
