One of the most distinctive elements of Mormonism is food storage. It’s not going to be at the very tip-top of anyone’s list of “What do you think about when you think about Mormons?” but it’s still up there. If we were playing Family Feud, it wouldn’t be the #1 survey response, but it would be on the board.
This is kind of funny when you contrast it with what the Church actually teaches about welfare. Here’s a quote from Elder Brown’s talk:
May I remind you of the six elements of personal and family preparedness, all of which should be taught.
They are: first, literacy and education; second, career development; third, financial and resource management; fourth, home production and storage; fifth, physical health; and sixth, social-emotional strength.
It’s so interesting to me that the stuff everyone thinks about first–food storage and practical self-reliance–is actually fourth on this list, and only one item out of six.
This is one of the reasons it’s so important to pay attention to General Conference every spring and fall, and why it’s beneficial to go back and read through these old ones: because what we think the message is and what the message really turns out to be are not always the same. The messages, priorities, and narratives we absorb from our social network have all been through many, many rounds of telephone.
If we want to get the information from the source, we need to listen to what the General Authorities tell us themselves, and we need to come to that with a willingness to revisit our preconceptions, assumptions, and paradigms to actually really hear that they’re trying to tell us.
The Handmaid’s tale as a TV show is apparently a big deal. I don’t know about that. I really liked the book when I read it a few years ago, but I dreaded it being made for TV and haven’t checked the show out. Anyway, because the show is a big deal, I see lots of references to it on Facebook. Here’s one that stood out:
Better never means better for everyone. It always means worse for some.
The line is from the book, and it made it into the show, too. Of course it did.
The sentiment is very, very far from unique. In fact, it’s pretty close to universal among the left-wing of American politics. It’s actually pretty common on the right, too, since it’s more about populism than it is about left/right ideology. It crops up all the time. Just as one more example, here’s another left-leaning author in another overtly ideological (but not nearly as aesthetically accomplished) book[ref]It’s A Closed and Common Orbit by Becky Chambers. Here’s my review.[/ref]:
“Everybody’s history is one long slog of all the horrible shit we’ve done to each other.”
“It’s not all that,” Tak said. “A lot of it, yes, but there’s good things, too. There’s art, and cities, and science. All the things we’ve discovered. All the things we’ve learned and made better.”
“All the things made better for some people. Nobody has ever figured out how to make things better for everybody.”
“I know,” Tak said.
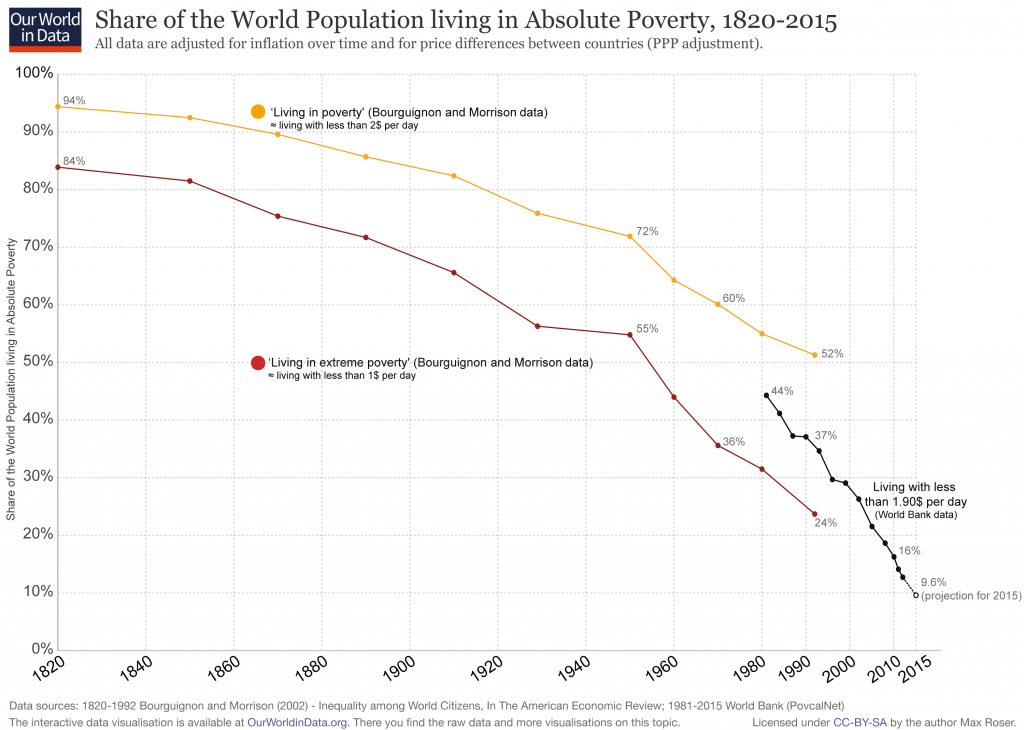
So, that’s one theory of human existence: in all of our history (and for hundreds of years into our imagined future) progress for everyone is impossible.
On the other hand, here’s the reality[ref]This is Walker’s favorite graph, btw.[/ref]:
I understand the idea of living in a fantasy world if the fantasy is better than reality. I can even understand extending this wishful thinking to fantasies that don’t actually seem very nice. That’s what conspiracy theories are all about, after all. Some people would rather believe in a world where things happen for a reason (and that reason is the Illuminati) rather than believe in a world where things are pretty random and chaotic because the Illuminati running everything is less scary than nobody running anything. OK. Not my cup of tea, but OK.
What I don’t understand is choosing to live in fantasy world that is so much grimmer than reality for no discernible benefit.
Which makes you wonder: what motivates this belief–contradicted by all available evidence–that universal improvement is impossible?
A new study published in JAMA Psychiatry this month finds that the rate of alcohol use disorder, or what’s colloquially known as “alcoholism,” rose by a shocking 49 percent in the first decade of the 2000s. One in eight American adults, or 12.7 percent of the U.S. population, now meets diagnostic criteria for alcohol use disorder, according to the study.
The study’s authors characterize the findings as a serious and overlooked public health crisis, noting that alcoholism is a significant driver of mortality from a cornucopia of ailments: “fetal alcohol spectrum disorders, hypertension, cardiovascular diseases, stroke, liver cirrhosis, several types of cancer and infections, pancreatitis, type 2 diabetes, and various injuries.”
Indeed, the study’s findings are bolstered by the fact that deaths from a number of these conditions, particularly alcohol-related cirrhosis and hypertension, have risen concurrently over the study period. The Centers for Disease Control and Prevention estimates that 88,000 people a year die of alcohol-related causes, more than twice the annual death toll of opiate overdose.
…The study found that rates of alcoholism were higher among men (16.7 percent), Native Americans (16.6 percent), people below the poverty threshold (14.3 percent), and people living in the Midwest (14.8 percent). Stunningly, nearly 1 in 4 adults under age 30 (23.4 percent) met the diagnostic criteria for alcoholism.
…The study’s data go only through 2013. If the observed trend continues, the true rate of alcoholism today would be even higher.
How is “alcoholic” defined? The study defined “alcohol abuse” with the following criteria:
Recurrent use of alcohol resulting in a failure to fulfill major role obligations at work, school, or home (e.g., repeated absences or poor work performance related to alcohol use; alcohol-related absences, suspensions, or expulsions from school; neglect of children or household).
Recurrent alcohol use in situations in which it is physically hazardous (e.g., driving an automobile or operating a machine when impaired by alcohol use).
Recurrent alcohol-related legal problems (e.g., arrests for alcohol-related disorderly conduct).
Continued alcohol use despite having persistent or recurrent social or interpersonal problems caused or exacerbated by the effects of alcohol (e.g., arguments with spouse about consequences of intoxication).
And “alcohol dependence” by the following:
Need for markedly increased amounts of alcohol to achieve intoxication or desired effect; or markedly diminished effect with continued use of the same amount of alcohol.
The characteristic withdrawal syndrome for alcohol; or drinking (or using a closely related substance) to relieve or avoid withdrawal symptoms.
Drinking in larger amounts or over a longer period than intended.
Persistent desire or one or more unsuccessful efforts to cut down or control drinking.
Important social, occupational, or recreational activities given up or reduced because of drinking.
A great deal of time spent in activities necessary to obtain, to use, or to recover from the effects of drinking.
Continued drinking despite knowledge of having a persistent or recurrent physical or psychological problem that is likely to be caused or exacerbated by drinking.
Why the rise?
“I think the increases are due to stress and despair and the use of alcohol as a coping mechanism,” said the study’s lead author, Bridget Grant, a researcher at the National Institutes of Health. The study notes that the increases in alcohol use disorder were “much greater among minorities than among white individuals,” likely reflecting widening social inequalities after the 2008 recession.
The ivory towers of King’s College London’s Maughan Library (Public Domain)
I’ve often met academics who seem mystified and horrified at the extent and depth of conservative animus towards academia. This excellent article does a great job of explaining (1) where this dislike comes from and (2) why it should concern everyone, and not just conservatives.
First:
Entire disciplines—Literature, Anthropology, Sociology, and the various interdisciplinary programs that end in the word “Studies” – have all become more strongly associated with a particular species of left-wing interpretation that now influences the broader discourse in journalism and on social media. In some departments, the social categories of analysis—race, class, and gender—have attained complete hegemony. The most recent convention of the Modern Language Association, the most prominent organization associated with the study of language and literature, hosted three times as many panels on post-colonialism as it did on Shakespeare.
Second:
Conservatives will point to statistics such as the imbalance in the ratio between registered Democrats and Republicans as evidence of a political imbalance. Students it is argued are only getting one side of the story. While this sentiment is certainly understandable, it ignores an element of the current phenomena that might be even more deleterious to student learning and thus all the more intractable. The problem isn’t simply one of political imbalance, an absence of parity between Left and Right voices, but the extent to which humanities departments have become politicized.
I’m a conservative (more or less), and so I have an interest in conservatives being able to get their message out. But–independent of that partisan concern which I cannot pretend I do not feel–I have a sincere, non-partisan interest in the quality of public discourse. The politicization of everything is corroding that discourse. When everything is evaluated first in political terms, the conversation often fails to ever get beyond those preliminaries. Battle lines are drawn over rhetoric, terminology, tone, and framing. What’s left is a zombie-discourse, the husk of a conversation serving as a thin veneer for power games.
It’s bad for everyone.
It’s especially bad for academia. If folks like those at Heterodox Academy don’t manage to hold onto a middle-ground position, I’m not sure what the future of the academy in the United States looks like, but it will likely be quite grim. Elite institutions are already much more about the perpetuation of elitism than education. When the academic content of academia effectively disappears, there will be nothing left except the quasi-covert apparatus of aristocracy.
I’m sure most of you have heard about the controversial Google Memo making the rounds throughout the media. Social psychologists Sean Stevens and Jonathan Haidt provide an excellent source[ref]Thanks to Megan Conley for linking to this on Facebook.[/ref] for those interested in browsing the academic literature on the subject. They provide both supportive and critical responses[ref]Update: Add this to the critical pile.[/ref] to the memo as well as highlight findings within the research that both agree and disagree with the memo’s assertions. Overall, they conclude,
1. Gender differences in math/science ability, achievement, and performance are small or nil.* (See especially the studies by Hyde; see also this review paper by Spelke, 2005). The one exception to this statement seems to be spatial abilities, such as the ability to rotate 3-dimensional objects in one’s mind. This ability may be relevant in some areas of engineering, but it’s not clear why it would matter for coding. Thus, the large gender gap in coding (and in tech in general) cannot be explained as resulting to any substantial degree from differences in ability between men and women.
2. Gender differences in interest and enjoyment of math, coding, and highly “systemizing” activities are large. The difference on traits related to preferences for “people vs. things” is found consistently and is very large, with some effect sizes exceeding 1.0. (See especially the meta-analyses by Su and her colleagues, and also see this review paper by Ceci & Williams, 2015).
3. Culture and context matter, in complicated ways. Some gender differences have decreased over time as women have achieved greater equality, showing that these differences are responsive to changes in culture and environment. But the cross-national findings sometimes show “paradoxical” effects: progress toward gender equality in rights and opportunities sometimes leads to larger gender differences in some traits and career choices. Nonetheless, it seems that actions taken today by parents, teachers, politicians, and designers of tech products may increase the likelihood that girls will grow up to pursue careers in tech, and this is true whether or not biology plays a role in producing any particular population difference. (See this review paper by Eagly and Wood, 2013).
“One issue frequently raised by migrants whom I have met in transit (most recently in Agadez, Niger) is the absence of a level playing field in their home country,” reports Richard Danziger at the World Economic Forum. “Without knowing the right people, being from the right community or having the money to buy their way into a job, they will never get ahead. This, in turn, is part of the broader problem of poor governance, which has resulted in everything from a sharp drop in the quality of education and other services; to investment in sectors that lead to impressive GDP growth indicators, but result in little by way of job creation. While an increasing number of countries across Africa are holding free and fair elections, democratically elected governments have yet to prove themselves truly responsive to the needs of vast swathes of the population. In countries where there is already a tradition of migration, for many, voting with one’s feet can appear more effective than a trip to the ballot box.”
Danziger continues,
There has been relatively little research on the issue of poor governance as a driver of migration. A recently published study by GIZ specifically examining the link between corruption and migration and forced displacement is a rare example of research into this sensitive subject…The concept of poor governance is very broad and can cover a multitude of areas of mismanagement or criminal activity horizontally across sectors and vertically across levels of management. Indonesians for example talk of KKN: the Bahasa acronym for Corruption, Collusion and Nepotism. It might perhaps be more useful to explain what is meant by good governance and here we can refer to Sustainable Development Goal (SDG) 16: “Promote peaceful and inclusive societies for sustainable development, provide access to justice for all and build effective, accountable and inclusive institutions at all levels.” More specifically 16.5, 16.6 and 16.7; address corruption, transparency and accountability, and inclusiveness and participation.
As for the link to migration, the New York Declaration for Refugees and Migrants refers to the promotion of the rule of law and the need to address marginalization and exclusion. It also refers to the SDGs and the promotion of peaceful and inclusive societies, carefully sidestepping any mention of KKN or related abuses. Yet if we are to create a truly new and effective global migration framework there is a need for the Global Compact on Migration to include explicit reference to these issues.
I have an article currently under review at BYU Studies Quarterly on the subject of the Church and immigration. The more I read about the subject, the more I’m convinced I’m right.
When it comes to the motivations behind redistribution, it turns out that fairness has little to do with it. Instead, researchers find[ref]Full access here.[/ref] that compassion, envy, and self-interest are the main drivers. From the abstract:
Why do people support economic redistribution? Hypotheses include inequity aversion, a moral sense that inequality is intrinsically unfair, and cultural explanations such as exposure to and assimilation of culturally transmitted ideologies. However, humans have been interacting with worse-off and better-off individuals over evolutionary time, and our motivational systems may have been naturally selected to navigate the opportunities and challenges posed by such recurrent interactions. We hypothesize that modern redistribution is perceived as an ancestral scene involving three notional players: the needy other, the better-off other, and the actor herself. We explore how three motivational systems—compassion, self-interest, and envy—guide responses to the needy other and the better-off other, and how they pattern responses to redistribution. Data from the United States, the United Kingdom, India, and Israel support this model. Endorsement of redistribution is independently predicted by dispositional compassion, dispositional envy, and the expectation of personal gain from redistribution. By contrast, a taste for fairness, in the sense of (i) universality in the application of laws and standards, or (ii) low variance in group-level payoffs, fails to predict attitudes about redistribution.
Let’s dive into the details:
We conducted 13 studies with 6,024 participants in four countries to test the hypothesis that compassion, envy, and self-interest jointly predict support for redistribution. Participants completed instruments measuring their (i) support for redistribution; (ii) dispositional compassion; (iii) dispositional envy; (iv) expected personal gain or loss from redistribution (our measure of self-interest); (v) political party identification; (vi) aid given personally to the poor; (vii) wealthy-harming preferences; (viii) endorsement of procedural fairness; (ix) endorsement of distributional fairness; (x) age; (xi) gender; and (xii) socioeconomic status (SES) (pg. 8422).
The results?:
To test this prediction, we regressed participants’ support for redistribution simultaneously on their dispositional compassion, their dispositional envy, and their expected personal gain (or loss) from redistribution. As predicted, the three motives have positive, significant, and independent effects on support for redistribution. This is true in the four countries tested: the United States (US) (study 1a), India (IN) (study 1b), the United Kingdom (GB) (study 1c), and Israel (IL) (study 1d)—standardized regression coefficients (β values): compassion, 0.28–0.39; envy, 0.10–0.14; self-interest, 0.18–0.30. Jointly, these motives account for 13–28% of the variance in support for redistribution. Adding to the regression models age and gender, or age, gender, and S[ocio]E[conomic]S[tatus], does not appreciably alter the effect of the emotion/motivation triplet, or the total variance accounted for. We note that age did not have significant effects in any country. Gender had significant effects in the United States and the United Kingdom (females more opposed to redistribution), but not in India or Israel. SES had a significant (negative) effect in the United Kingdom, but not in the other countries (Ibid.).
Unsurprisingly, in the U.S. “self-described Democrats endorsed redistribution to a greater extent than Republicans and Libertarians did. Democrats also reported more compassion and more expected personal gain from redistribution than Republicans and Libertarians did; envy did not differ by party” (Ibid.). Interestingly enough, “dispositional compassion was the only reliable predictor of giving aid to the poor” in all four countries. However, “support for government redistribution was not a unique predictor of personally aiding the poor in the regressions…Support for government redistribution is not aiding the needy writ large—in the United States, data from the General Social Survey indicate that support for redistribution is associated with lower charitable contributions to religious and nonreligious causes” (Ibid.).
Compassion
Now consider these absurd answers from the survey respondents:
Participants in the United States, India, and the United Kingdom (studies 1a–c) were given two hypothetical scenarios and asked to indicate their preferred one. In one scenario, the wealthy pay an additional 10% in taxes, and the poor receive an additional sum of money. In the other scenario, the wealthy pay an additional 50% in taxes (i.e., a tax increment five times greater than in the first scenario), and the poor receive (only) one-half the additional amount that they receive in the first scenario. That is, higher taxes paid by the wealthy yielded relatively less money for the poor, and vice versa (63). To clarify the rationale for this trade-off, we told participants that the wealthy earned more when tax rates were low, thereby generating more tax revenue that could be used to help the poor. Fourteen percent to 18% of the American, Indian, and British participants indicated a preference for the scenario featuring a higher tax rate for the wealthy even though it produced less money to help the poor…We regressed this wealthy-harming preference simultaneously on support for redistribution, the emotion/motivation triplet, age, gender, and SES. Dispositional envy was the only reliable predictor (Ibid.).
In short, “Compassion and envy motivate the attainment of different ends. Compassion, but not envy, predicts personally helping the poor. Envy, but not compassion, predicts a desire to tax the wealthy even when that costs the poor” (Ibid.). The cries for fairness, though, have little to do with support for redistribution:
To sum up the set of fairness studies, in predicting support for redistribution, the effect of fairness as a group-wide concern is unreliable and of far smaller magnitude than the effect of the emotion/motivation triplet. This is true whether fairness is operationalized as uniformity in the application of laws and standards or as low (or null) variance in payoffs; whether distributional fairness is assayed between individuals (studies 2a, 2c, S1a, S2a, S2b) or between groups (“the rich,” “the poor”; studies 2b, S1b, S2c, S2d); and whether allocational decisions are hypothetical (studies 2a, 2b, S1a, S1b, S2c, S2d) or consequential (studies 2c, S2a, S2b) (pg. 8423).
So, why do people support redistribution?
They care about the poor and want to help them (Compassion).
I liked Elder Simpson’s talk on The Lord’s Support System. He starts with an analogy about how a multil-billion-dollar space mission can be held up by something as trivial as a flaw in a thirty-cent part.
Just as space probes depend upon tens of thousands of other lesser components in their so-called support system, so does the Lord depend upon tens of thousands in His support system, that His ultimate objective of blessing the lives of people and qualifying them for eternal life might be accomplished on schedule.
He also uses an analogy of life being like a school drama where there are only a few starring roles to go around. For the rest of us? We’re the spear carriers. But then comes this interesting paragraph:
There could be many surprises in the hereafter as we look up ahead and exclaim in our amazement, “But he was only a home teacher.” You know and I know that if he was the kind of home teacher that the handbook talks about and if he lived worthily, that man could likely stand eligible to inherit all that the Father has. And there is no greater blessing than that.
I remember one day in high school when I happened to be standing at a friend’s open locker and noticed she had taped up a black-and-white photo of several male models. (I think it was a cologne ad or a jeans ad or something.) I stared absently at the models for a minute or two, wondering if I’d ever be as good-looking as they were. In theory, I figured I could have muscles as toned as them if I really worked at it. But when it came to their faces? Not really anything I could do in that department. I’m not a bad-looking guy (if I do say so myself), but I’m not a model either and it occurred to me for the first time then that that was never going to change. They say you can be anything you want when you grow up, but it’s not true.
I’ve had a few experiences like that since then, for example in playing competitive sports with people who are simply not in my league, where no matter how hard I try I not only couldn’t win; I couldn’t even make it a challenge. I’ve met people who are so smart, that it takes everything I’ve got just to recognize their intelligence. Here’s the reality: I’m never going to be that good looking, that strong, or that smart. I’m just not.
I suppose that could be depressing, but I’m not really depressed by it at all. For a variety of reasons. But here’s the one that’s relevant: I’ve come to honestly believe that the only kind of excellence that matters is excellence relative to your talents and opportunities. I’ve come to believe it doesn’t matter at all—not even a tiny bit—what you end up with. It only matters what you did with what you started with.
I do have a collection of real talents: things I’m good at, opportunities I inherited from my parents, and so on.[ref]In modern parlance: privileges.[/ref] My goal in this life is make the most out of them that I can and to do so in the service of God and my fellow humans. If—God willing—I succeed then I will have achieved the only measure of success that really matters.
So, in a way, I kind of reject the analogy of the spear carriers and the thirty-cent transistors inside of rockets or satellites. Don’t get me wrong, it’s a good analogy. It’s just not quite far enough. What I’m saying is that in God’s view a thirty-cent transistor isn’t valuable because the billion-dollar space telescope can’t work without it (or whatever). That’s an instrumental theory of value, albeit implicitly. What I’m saying is that if the thirty-cent transistor is the best thirty-cent transistor that it can be, then it’s worth exactly the same as the billion-dollar space telescope without caveat or qualification. Not because it enables the space telescope, but because all that matters is being excellent relative to our opportunities and privileges. Nothing else counts.
Economists Bruce D. Meyer and James X. Sullivan have a brand new NBER paper on inequality; specifically consumption inequality. From the abstract:
Official income inequality statistics indicate a sharp rise in inequality over the past five decades. These statistics do not accurately reflect inequality because income is poorly measured, particularly in the tails of the distribution, and current income differs from permanent income, failing to capture the consumption paid for through borrowing and dissaving and the consumption of durables such as houses and cars. We examine income inequality between 1963 and 2014 using the Current Population Survey and consumption inequality between 1960 and 2014 using the Consumer Expenditure Survey. We construct improved measures of consumption, focusing on its well-measured components that are reported at a high and stable rate relative to national accounts. While overall income inequality (as measured by the 90/10 ratio) rose over the past five decades, the rise in overall consumption inequality was small. The patterns for the two measures differ by decade, and they moved in opposite directions after 2006. Income inequality rose in both the top and bottom halves of the distribution, but increases in consumption inequality are only evident in the top half. The differences are also concentrated in single parent families and single individuals. Although changing demographics can account for some of the changes in consumption inequality, they account for little of the changes in income inequality. Consumption smoothing cannot explain the differences between income and consumption at the very bottom, but the declining quality of income data can. Asset price changes likely account for some of the differences between the measures in recent years for the top half of the distribution.
Meyer and Sullivan have been updating their data over the years. As the 2013 version (which measures inequality from 1960 to 2011) concludes,
Consumption inequality is less pronounced than income inequality and changes in consumption inequality differ considerably from changes in income inequality. While income inequality falls in the 1960s, consumption inequality rises slightly. Both consumption and income indicate rising inequality during the 1980s, but the rise is more noticeably for income. Since the mid-2000s, income inequality has risen while consumption inequality has fallen. Over the past three decades, both income and consumption inequality have risen, but the rise is much more noticeable for income (45 percent) than for consumption (19 percent). Differences between income and consumption are also evident for different parts of the distribution. Income inequality in the top half of the distribution rose steadily between 1980 and 2011, while consumption inequality for the top half of the distribution rose between 1980 and 2005, but then fell noticeably. Although changing demographics can account for some of the changes in consumption inequality, they do not account for changes in income inequality.
Comparisons of survey data to administrative records and national income accounts data indicate under-reporting of both income and consumption. There is evidence of considerable under-reporting of government transfers in income surveys, and the extent of under-reporting has grown overtime. Such under-reporting could lead to significant bias in the level and pattern of income inequality. There is also evidence of under-reporting of consumption data, although major components of consumption such as food at home and housing are reported at a high and stable rate relative to aggregate data. The differences between income and consumption inequality changes through 2005 are almost exclusively in the bottom half of the distribution, indicating that the under-reporting of consumption by the rich is not an explanation for the differences (pg. 21).
To quote Tyler Cowen, “This is one big reason why you can believe income inequality is high and/or rising, and not see it as the most significant normative issue.”
A new study suggests that when it comes to the early stages of economic development, education may not play that big of a role. From the ungated version:
The accumulation of human capital is considered as an important determinant in the process of economic growth. Despite a large literature there is still an ambiguity regarding its role in growth as a number of empirical studies have found an insignificant, in some cases even negative, impact of human capital on growth. However, the focus of these studies has been more on issues related to the use of data and methodology and they assume that the impact of human capital is the same across countries.
Using a dynamic threshold model, we show that the reason for the apparent irrelevance of human capital (proxied by average years of schooling) for generating growth in an economy lies with its level of development. This implies that human capital accumulation cannot assert its productive role in the process of growth until an economy crosses a threshold level of development. Our finding remains robust across various tests. What helps human capital to assert its productivity at a higher level of development provides an interesting opportunity for further work (pg. 9).
It seems like the institutions of growth–largely those associated with increased economic freedom–play the most vital role in getting economies off the ground.


 I’m sure most of you have heard about the
 To test this prediction, we regressed participants’ support for redistribution simultaneously on their dispositional compassion, their dispositional envy, and their expected personal gain (or loss) from redistribution. As predicted, the three motives have positive, significant, and independent effects on support for redistribution. This is true in the four countries tested: the United States (US) (study 1a), India (IN) (study 1b), the United Kingdom (GB) (study 1c), and Israel (IL) (study 1d)—standardized regression coefficients (β values): compassion, 0.28–0.39; envy, 0.10–0.14; self-interest, 0.18–0.30. Jointly, these motives account for 13–28% of the variance in support for redistribution. Adding to the regression models age and gender, or age, gender, and S[ocio]E[conomic]S[tatus], does not appreciably alter the effect of the emotion/motivation triplet, or the total variance accounted for. We note that age did not have significant effects in any country. Gender had significant effects in the United States and the United Kingdom (females more opposed to redistribution), but not in India or Israel. SES had a significant (negative) effect in the United Kingdom, but not in the other countries (Ibid.).
 Participants in the United States, India, and the United Kingdom (studies 1a–c) were given two hypothetical scenarios and asked to indicate their preferred one. In one scenario, the wealthy pay an additional 10% in taxes, and the poor receive an additional sum of money. In the other scenario, the wealthy pay an additional 50% in taxes (i.e., a tax increment five times greater than in the first scenario), and the poor receive (only) one-half the additional amount that they receive in the first scenario. That is, higher taxes paid by the wealthy yielded relatively less money for the poor, and vice versa (63). To clarify the rationale for this trade-off, we told participants that the wealthy earned more when tax rates were low, thereby generating more tax revenue that could be used to help the poor. Fourteen percent to 18% of the American, Indian, and British participants indicated a preference for the scenario featuring a higher tax rate for the wealthy even though it produced less money to help the poor…We regressed this wealthy-harming preference simultaneously on support for redistribution, the emotion/motivation triplet, age, gender, and SES. Dispositional envy was the only reliable predictor (Ibid.).

 A
A