Does the “Profit Motive” Inhibit Art?

“Profit and profitability are…crucial–for society even more than for the individual business,” wrote the late Peter Drucker.

Yet profitability is not the purpose of, but a limiting factor on business enterprise and business activity. Profit is not the explanation, cause, or rationale of business behavior and business decisions, but rather the test of their validity. If archangels instead of businessmen sat in directors’ chairs, they would still have to be concerned with profitability, despite their total lack of personal interest in making profits. The root of the confusion is the mistaken belief that the motive of a person–the so-called profit motive of businessmen–is an explanation of his behavior or his guide to right action. Whether there is such a thing as a profit motive at all is highly doubtful…In fact, the concept is worse than irrelevant: it does harm. It is a major cause of the misunderstanding of the nature of profit in our society and of the deep-seated hostility to profit, which are among the most dangerous diseases of an industrial society…And it is in large part responsible for the prevailing belief that there is an inherent contradiction between profit and a company’s ability to make a social contribution. Actually, a company can make a social contribution only if it is highly profitable.[ref]The Essential Drucker, pgs. 18-20.[/ref]

Drucker goes a little too far (his dismissal of economic explanations is a bit, well, wrong), but I was nonetheless reminded of this with the passing of science fiction authior Ursula Le Guin. In her speech at the 2014 National Book Awards, she said, “Books aren’t just commodities; the profit motive is often in conflict with the aims of art.” This is because “we live in capitalism” and “its power seems inescapable.” I suppose that could be true of profit to an extent, but the best evidence we have suggests the opposite. Economist Federico Etro’s work has shown that profitability helped drive artistic innovation over the centuries. For example, in Renaissance Italy, Etro found

a slow decline in real prices up to the 1420s, when the real price of paintings starts a rapid increase that continued for all the rest of the century. This process is more spectacular for the expected profitability of painting (the index based on the baseline regression), which suggests that the artistic profession was becoming more profitable. The expected compensations of a young apprentice (unaware of his future talent) were increasing during the XV century. But a similar increase in profitability applies also conditioning on the talent of the painter: the index of the expected compensation of a given painter (the one based on the full regression with artists’ fixed effects) reaches levels in the 1480s that are about three times as those of the 1420s. This suggests that the quality of the active painters was increasing over time, but even the most talented artists during the mid 1400s could expect an increase in their compensations along their career. Finally, notice that in the first half of the XVI century the real price of paintings finally stabilized at a relatively high level, which, as I argued, was not differentiated between regions. 

This evolution suggests a Schumpeterian pattern. Part of the artistic creativity associated with Renaissance, and the artistic innovations of this period, such as the introduction of exact perspective (since the 1420s), oil colors (around the 1470s), the sfumato (with Leonardo), the colorito (with Titian) and an impressive differentiation of styles, may be due to increasing profitability of the profession made possible by the increasing demand for artistic goods. My data do not allow me to test directly for causality, but show for the first time that the expected profitability of the artistic profession was increasing rapidly during the XV century compared to the profitability of other professions (since we adjust prices for the purchasing power in terms of unskilled work). We should not underestimate the opinion of a privileged contemporary, Vasari, who repeatedly cited competition as a main driver of the achievements of the Florentine painters[.]

…An economic perspective suggests that it was the unprecedented increase in relative demand for artistic goods by wealthy patrons ready to compete for (and able to judge) quality in an interregional market that attracted large enough groups of painters in towns such as Florence, Venice and Rome. Competition incentivized these painters to differentiate styles and compete in quality, where higher quality was interpreted as the ability to solve a series of new technical problems in the realistic reproduction of the world in painted images. Under these rules of the game, positive externalities from the close interaction of painters in these towns strengthened their innovative ability (pgs. 25-28).

This was also true in Baroque era Italy:

We have studied the Italian market for oil paintings of historical subject during the Baroque era through econometric analysis of a unique data set containing the prices derived from the original contracts. Our main purpose was to show that looking at the market for paintings as a fully fledged market could shed light on the determination of the prices of some of the most valuable handmade objects of humankind. The market for oil paintings was extremely competitive and populated by players very similar to what we may now define as representatives of the homo economicus

…In a celebrated historical account of the demand for art in the Renaissance period, Richard A. Goldthwaite has pointed out that Italian cities have generated the first modern markets for durable luxury goods, which have been at the origins of modern capitalism based on consumerism. “Today the consumer instinct is taken for granted: the challenge to producers is to introduce new products, reduce prices, and change fashion… If, on the one hand, we decry what this consumerism has developed into in our own times, with its commodity culture of planned obsolescence, throwaway goods, and fashion-ridden boutiques, on the other hand, we have enshrined its very spirit in our great museums. These veritable temples to the consumption habits of the past, where we worship as art one of the dynamics that gives life to the economic system of the West, mark the supreme achievement of capitalism.” The market for paintings in the sixteenth-seventeenth century is not only one of the first markets for durable luxury goods of the modern capitalistic society. Its surviving documentary evidence and even its surviving products are witnesses that it was also one of the first markets to follow the main laws of economics and rational market behavior (pg. 437).

Etro has found similar patterns in the Venetian Republic between 1550 and 1750, Amsterdam during the Golden Age, and the Spanish Golden Age. Profitability and market forces don’t necessarily inhibit art. Most of the time, they allow art to flourish.


Was the China Shock Actually a Boom?

I’ve talked about the China Shock before. The concern is that imports from China reduced the amount of jobs in the United States. However, new research suggests otherwise:

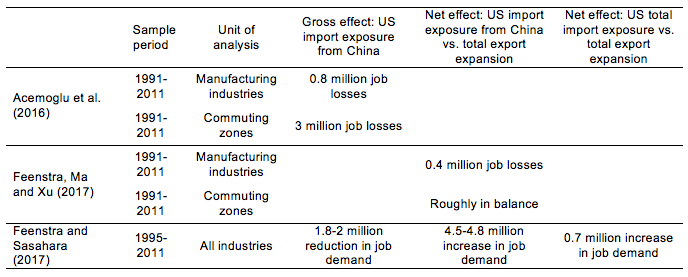
Our empirical results show important job gains due to US export expansion. We find that although imports from China reduce jobs, the global export expansion of US products creates a considerable number of jobs. Based on the industry-level estimation, our results show that on balance over the entire 1991-2007 or 1991-2011 periods, job gains due to changes in US global exports largely offset job losses due to China’s imports, resulting in about 300,000 to 400,000 job losses in net. Estimation at the commuting zone level generate even bigger job creation effects: in net, global export expansion substantially offsets the job losses due to imports from China, resulting in about 200,000 net job losses over the period 1991-2007, and a roughly balanced net effect if we extend the analysis to 1991-2011.

In Feenstra and Sasahara (2017), we quantify the employment effect of US imports and exports using a global input-output analysis. Following the technique of Los et al. (2015), we use the world input-output table from WIOD and examine the employment effects of US total exports and imports from China and from all countries during the period 1995-2011. Admittedly, this approach only indicates the impact of trade on labour demand, without taking into account the (regional) supply of labour in general equilibrium.

We find that the growth in US exports created demand for 2 million manufacturing jobs, 500,000 resource-sector jobs, and a remarkable 4.1 million jobs in services, totalling 6.6 million. The positive job creation effect of exports in the manufacturing sector, 2 million, is quantitatively similar to the result in Feenstra et al. (2017), in which 1.9 million jobs were created by US exports from the instrumental-variable regression approach. On the import side, our analysis shows that manufacturing imports from China reduced demand for US jobs by 1.8-2.0 million, which is similar to the result in Autor et al. (2016), who finds a decline of 2.0 million jobs due to imports from China.

One advantage of the input-output approach is that it is easy to extend the analysis to other sectors such as services and natural resources. Our results show that, when focusing on the manufacturing sector and the natural resource sector, the net effect of overall trade with all countries in all sectors is slightly negative: 80,000 reduction in demand for jobs in manufacturing, and a 250,000 job reduction in the natural resource sector during 1995-2011. However, when looking at the service sector, we find a substantial net job gain, with a 1.03 million increase in the demand for jobs due to overall trade with all countries. This is large enough to compensate for the net job losses in the manufacturing and natural resource sectors. After taking all of these into account, the net effect of overall trade with all countries led to a net increase in labour demand of 700,000 jobs.

They conclude,

Our results fit the textbook story that job opportunities in exports make up for jobs lost in import-competing industries, or nearly so. Once we consider the export side, the negative employment effect of trade is much smaller than is implied in the previous literature. Although our analysis finds net job losses in the manufacturing sector for the US, there are remarkable job gains in services, suggesting that international trade has an impact on the labour market according to comparative advantage. The US has comparative advantages in services, so that overall trade led to higher employment through the increased demand for service jobs.


Does More Gender Egalitarianism Reduce Gender Differences?

Image result for we're different gif

Perhaps surprisingly, the answer appears to be “no.” A 2017 study in the International Journal of Psychology found,[ref]Previous studies have come to similar conclusions.[/ref]

Gender differences in most psychological traits—Big Five, Dark Triad, self-esteem, subjective well-being, depression and values—are larger in cultures with more gender egalitarianism. Gendered socialization practices, sociopolitical institutions and gender role stereotypes—some of which appear universal across cultures (Low, 1989; Nosek et al., 2009; Williams & Best, 1990)—undoubtedly influence men’s and women’s personalities to some degree (Kring & Gordon, 1998; Twenge, 1997). Nevertheless, the limited evidence reviewed here casts serious doubts on social role theory’s ability to accurately predict and explain cross-cultural variations in the relative size of psychological gender differences. Simply put, when the men and women of a nation perceive the most similar gender roles, receive the most similar gender role socialization, and experience the greatest sociopolitical gender equity, gender differences in personality are almost always at their largest.

Beyond personality traits, similar disconfirmations of social role theory’s cross-cultural predictions have been demonstrated across a variety of human attributes. For instance, gender differences in romantic attitudes and behaviours—including dismissing attachment, intimate partner violence, love, enjoying casual sex and mate preferences for attractiveness—also appear noticeably larger in cultures with more gender egalitarianism (Schmitt, 2015; for notable exceptions, see Schmitt, 2005; Zentner & Eagly, 2015). Gender differences in many objectively tested cognitive measures—such as spatial location, spatial rotation and episodic memory abilities—also appear larger in cultures with more gender egalitarianism (Silverman, Choi, & Peters, 2007; Weber, Skirbekk, Freund, & Herlitz, 2014). Lippa, Collaer, and Peters (2010) tested spatial rotation abilities in men and women across 40 nations, the largest gender differences in spatial rotation ability were found in Norway, the smallest were found in Pakistan. In a review of gender differences in mathematics test scores within and across cultures, Stoet and Geary (2013) concluded the evidence is mixed, but “If anything, economically developed countries with strong gender-equality and human development scores tended to have a larger sex difference in mathematics” (p. 4). Even gender differences in physical characteristics such as height, obesity and blood pressure are conspicuously larger in cultures with more gender egalitarianism (Schmitt, 2015) (pg. 49).

In short,

the vast weight of the extant evidence suggests the relatively large gender differences observed in Northern European nations are unlikely to be the result of psychological blank slates in boys and girls being written on by especially potent gender role socialization practices or especially strong sociopolitical patriarchy within Scandinavian cultures. Instead, psychological gender differences—in Big Five traits, Dark Triad traits, self-esteem, subjective well-being, depression and values—are demonstrably the largest in cultures with the lowest levels of bifurcated gender role socialization or sociopolitical patriarchy. Ultimately, the view that men and women start from a blank slate simply does not jibe with the current findings, and scholars who continue to assert gender invariably starts from a psychological blank slate should find these recurring cross-cultural patterns challenging to their foundational assumptions (pg. 50).

The researchers conclude,

It is undeniably true that men and women are more similar than different genetically, physically and psychologically. Even so, important gender differences in personality exist that likely stem, at least in part, from evolved psychological adaptations. Some of these adaptations generate culturally-universal gender differences, and many are further designed to be sensitive to local socioecological contexts in ways that facultatively generate varying sizes of gender differences across cultures. It is also true evolved gender differences in personality can be accentuated or attenuated by factors that have little to do with evolved sensitivities to socioecological contexts (Schmitt, 2015). Even gender differences in our bones can embody peculiarities of local cultural forms (Fausto-Sterling, 2005). To shift away from the dominant gender difference paradigm in psychological science—the view that perceived gender roles, gendered socialization and patriarchal sociocultural institutions are the primary causes of psychological gender differentiation (also called the Standard Social Science Model; Tooby & Cosmides,1992)—will no doubt take some time (pg. 52).

Related image

Economic Freedom of North America 2017

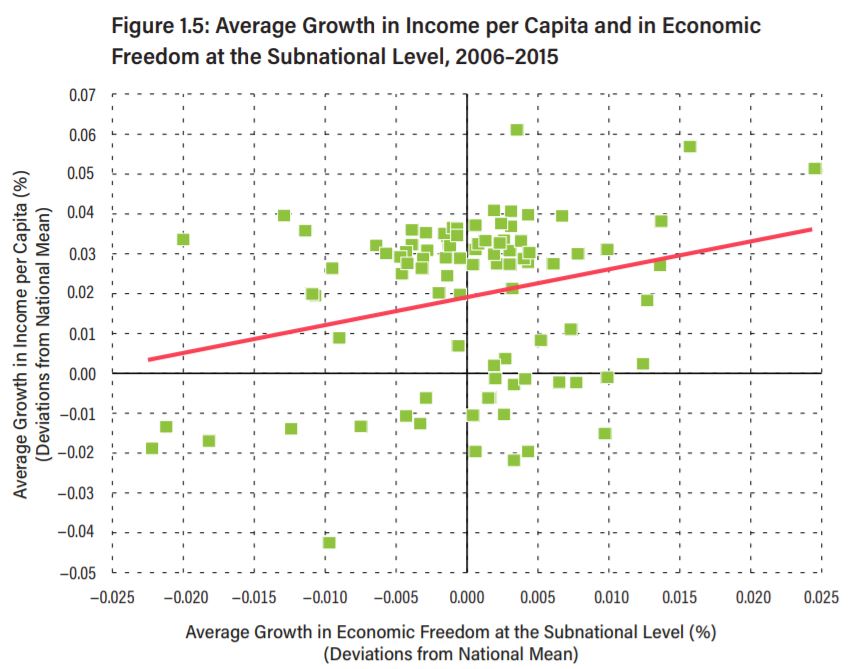
The Fraser Institute–who publishes the oft-cited Economic Freedom of the World report–published their latest Economic Freedom of North America report toward the end of December. This report looks at states within Canada, the United States, and Mexico. Once again, there is a link between economic freedom and economic well-being.

I’m happy to report that Texas is tied with Florida for the 2nd most economically free state in the United States and tied for 3rd (along with 10 other U.S. states, including Florida, South Dakota, Nevada, and Georgia) at the national level. Yet, the Cato Institute’s Freedom in the 50 States report finds that we could do better when it comes to personal freedom:

Personal freedom is relatively low in Texas, but it should rise with the Obergefell decision, setting aside Texas’s super-DOMA…Criminal justice policies are generally aggressive—though Texas has emerged as a leading voice in the national reform movement. Even controlling for crime rates, the incarceration rate is far above the national average and has not improved since 2000. Drug arrest rates have fallen over time but are still above average for the user base. Nondrug victimless crime arrest rates have also fallen over time and are now below the national average. Asset forfeiture is mostly unreformed, and law enforcement frequently participates in equitable sharing. Cannabis laws are harsh. A single offense not involving minors can carry a life sentence. Even cultivating a tiny amount carries a mandatory minimum of six months. In 2013–14, the state banned the mostly harmless psychedelic Salvia divinorum. Travel freedom is low. The state takes a fingerprint for driver’s licenses and does not regulate automated license plate readers at all. It has little legal gambling. Private school choice programs are nonexistent, but at least private schools and homeschools are basically unregulated. Tobacco freedom is moderate, as smoking bans have not gone as far as in other states. Gun rights are moderately above average and should improve a bit in the next edition with the new open-carry law. Alcohol freedom is above average, with taxes low. Texas has virtually no campaign finance regulations.

Both are useful indices.

Public Ignorance on Corporate Profits

Numerous studies over the years have demonstrated how ignorant the general public is regarding political matters.[ref]See Ilya Somin, Democracy and Political Ignorance: Why Smaller Government Is Smarter, 2nd ed. (Stanford, CA: Stanford University Press, 2016); Bryan Caplan, The Myth of the Rational Voter: Why Democracies Choose Bad Policies (Princeton, NJ: Princeton University Press, 2007); Christopher H. Achen, Larry M. Bartels, Democracy for Realists: Why Elections Do Not Produce Responsive Government (Princeton, NJ: Princeton University Press, 2016); Jason Brennan, Against Democracy (Princeton, NJ: Princeton University Press, 2016), Ch. 2: “Ignorant, Irrational, Misinformed Nationalists.”[/ref] This systemic ignorance and misinformation in turn warps the public’s policy preferences. AEI’s Mark Perry points out another example of public ignorance: corporate profits. He writes,

When a random sample of American adults were asked the question “Just a rough guess, what percent profit on each dollar of sales do you think the average company makes after taxes?” for the Reason-Rupe poll in May 2013, the average response was 36%! That response was very close to historical results from the polling organization ORC International polls for a slightly different, but related question: What percent profit on each dollar of sales do you think the average manufacturer makes after taxes? Responses to that question in 9 different polls between 1971 and 1987 ranged from 28% to 37% and averaged 31.6%.

How do the public’s estimates of corporate profit margins compare to reality? Not surprisingly they are off by a huge margin. According to this NYU Stern database for more than 7,000 US companies (updated in January 2018) in many different industries, the average profit margin is 7.9% for all companies and 6.9% for more than 6,000 companies excluding financials…Interestingly, for nearly 100 industries analyzed by NYU Stern, there’s only one industry that had a profit margin as high as 36% – and that was tobacco at 43.3%. The next highest profit margin was 26.4% for financial services, but more than 72% of industry profit margins were single-digits and the median industry profit margin is 6%. 

“Big Oil” companies make a lot of profits, right? Well, that industry (Integrated Oil/Gas) had a below-average profit margin of 5.6% in the most recent period analyzed, and separately, the Production and Exploration Oil/Gas industry is losing money, reflected in a -6.6% profit margin. For the general retail sector, the average profit margin is only 2.3% and for the grocery and food retail industry, it’s even lower at only 1.6%. And evil Walmart only made a 2.1% profit margin in 2017 (first three quarters) which is less than the industry average for general retail, possibly because grocery sales now make up more than half of Walmart’s revenue and profit margins are lower on food than general retail. Interestingly, Walmart’s profit margin of 2.1% is actually less than one-third of the 6.5% the average state/local government takes of each dollar of Walmart’s retail sales for sales taxes. Think about it – for every $100 in sales for Walmart, the state/local governments get an average of $6.50 in sales taxes (and as much as $10.12 in Louisiana and $9.45 in Tennessee, see data here), while Walmart gets only $2.10 in after-tax profits!

Perry concludes, “The public’s complete overestimation of how much companies earn in profits as a share of sales explains a lot…The general public that believes in the fantasy-world of unrealistically, sky-high 36% profit margins would naturally think companies are just being greedy and stingy when they don’t pay higher “living wages” and have to be forced to do so through minimum wage legislation. If the average person could realize that a 36% profit margin isn’t even close to reality and that the typical, median firm has a profit margin of only less than 8% or almost 30 percentage points below what the public thinks is a normal profit margin, then hopefully the average person would become a little more realistic about how the business world operates. Companies aren’t being stingy when they pay competitive wages, they’re just trying to survive on what are sometimes razor-thin profit margins, in a competitive environment where there’s not a large margin of error.”[ref]Perry also has a great post and WSJ article about CEO pay.[/ref]

Does College Partying Increase the Number of Rapes?

Image result for college party gif

According to a new study,

There are several mechanisms through which partying may increase the incidence of rape among college students. The most obvious relate to alcohol consumption, which has direct pharmacological effects on aggression and cognitive functioning. Moreover, consistent with Becker’s (1968) seminal model of crime, potential perpetrators may believe that the probability of being punished (and the degree of punishment) will be lower if they and/or their victims are inebriated. That said, partying may also increase the incidence of rape by increasing social contact and by altering the context in which social contact takes place. These potential pathways are supported by statistics indicating that over a half of incapacitated rapes and a quarter of forcible rapes take place at parties (Krebs et al. 2009) and statistics indicating that two-thirds of student rape victims are intoxicated or impaired by drugs at the time of the incident (Kilpatrick et al. 2007). Moreover, 77 percent of students agree that reducing drinking would be very effective, or somewhat effective, in preventing sexual assault on their campus (Washington Post-Kaiser Family Foundation 2015) (pg. 236).

So how do the researchers determine if there is an empirical link? By focusing on

the effects of football games–which intensify partying among college students–on the incidence of rape at schools with Division 1 programs. Specifically, we use panel data from the National Incident Based Reporting System to estimate the increases in reports of rape caused by football games using an identification strategy that exploits plausibly random variation in the timing of game days. Intuitively, we identify the effects by comparing reports of rape to law enforcement agencies serving students on game days to reports on nongame days, while controlling for differences expected across different days of the week and across different times of the year. This approach is similar to that of Rees and Schnepel (2009), who analyze the effects of college football games on assault, vandalism, disorderly conduct, and alcohol-related crimes. We find significant and robust evidence that football game days increase reports of rape victimization among 17–24-year-old women by 28 percent. Home games increase reports by 41 percent on the day of the game and away games increase reports by 15 percent. These effects are greater for schools playing in the more prominent subdivision of Division 1 and for relatively prominent games. There is no evidence that these effects are offset by reductions in nearby areas, on adjacent days, or during other times of the fall term. Moreover, the effects are driven largely by 17–24-year-old offenders and by offenders unknown to the victim, though we also find significant effects on incidents involving offenders of other ages and on incidents involving offenders known to the victim. Estimates by race indicate that the main results are not driven solely by white victims or black victims, nor by white offenders or black offenders.

Back of the envelope calculations based on our estimates imply that the effects of Division 1A football games explain 5 percent of fall semester (September through December) reports of rape involving 17–24-year-old victims to law enforcement agencies serving students attending these schools. Moreover, they imply that these games cause 724 additional rapes per year across the 128 schools participating in Division 1A. Based on an estimated social cost of $267,000 per rape (McCollister, French, and Fang 2010), this implies an annual social cost of rapes caused by Division 1A games of $193 million. The estimated effects for schools participating in Division 1AA are smaller, suggesting 108 additional rapes per year across 125 schools (pg. 237).

They also find evidence for “that the effects are larger-than-average for schools that have reputations as “party schools.” Finally, an analysis of the timing of the impacts reveals significant effects on reports of rape the night before, during, and after home games whereas effects are only apparent after away games. This evidence is consistent with there being an effect of pregame partying, which we would expect to be much more common for home than away games” (pg. 238).

A case where empirical evidence backs intuition.

Do Markets Pave the Way for Anticorruption Reforms?

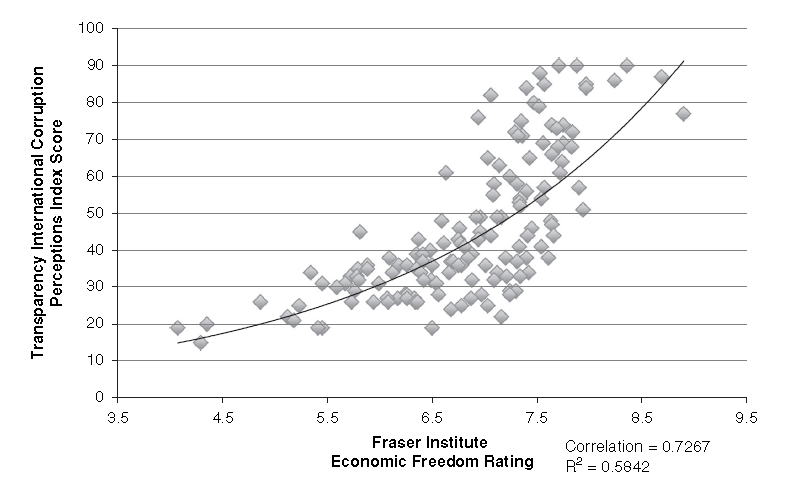
In a paper I have under review, I cite an article by Jason Brennan that points to “a robust positive correlation between countries’ degree of economic freedom (as measured by the Fraser Institute’s economic freedom ratings) and countries’ lack of corruption (as measured by Transparency International’s Corruption Perceptions Index.”[ref]Jason Brennan, “Do Markets Corrupt?” in Economics and the Virtues: Building a New Moral Foundation, ed. Jennifer A. Baker, Mark D. White (New York: Oxford University Press, 2016), 240.[/ref]

Recent studies offer further support to this correlation:

These twin policies [anticorruption reforms and high-quality market institutions] resonate with economic research revealing a mutually reinforcing feedback loop between corruption and stalled development. Corrupt officials misappropriating government money defund public goods and services, including those that might deter corruption. Bribing corrupt officials for regulatory favours or subsidies diverts corporate spending away from investing in productivity and corporate attention away from market signals. This stalls growth, and stalled growth locks in corruption (Krueger 1974, Fisman and Svensson 2007, Ayyagari et al. 2014).

Unfortunately, corruption is an enticing ‘second best’ optimal policy for key actors in an economy with an interventionist government. Bribes grease squeaky bureaucratic wheels to help businesses get things done where officials, not markets, allocate key resources. Bribes supplement officials’ incomes where stunted economic activity keeps government revenues low (Fisman 2001, Wei 2001, McMillan and Woodruff 2002, Li et al. 2008, Calomiris et al. 2010, Agarwal et al. 2015, Zeume 2016).

But once entered, this second-best thinking can entrap a whole economy in a low-level pit (e.g. Murphy et al. 1993, Morck et al. 2005). Powerful officials rationally focus on maximising bribe income (even erecting artificial regulatory barriers they can take bribes for removing), rather than institution building. Profit-maximising firms rationally invest in bribing officials because bribes, not enhancing productivity or responding to market signals, have higher returns. This explains clear empirical findings (e.g. Mauro 1995) linking worse corruption to slower growth.  

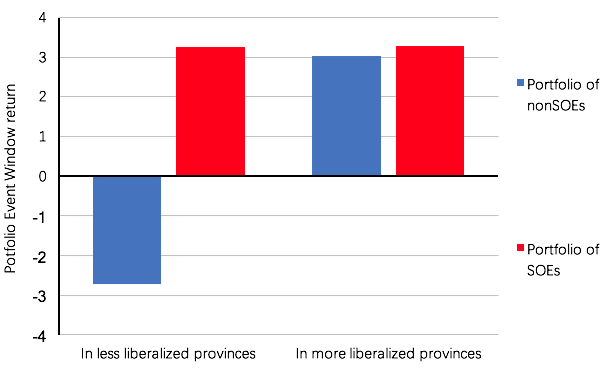
The authors note that almost “half of China’s listed firms are S[tate ]O[wned ]E[nterprise]s, and the anticorruption Policy affected SOEs and non-SOEs differently.” They continue,

In less liberalised provinces, officials still allocate key resources, so bribing them is critical to get anything done. Deprived of the ability to pay bribes, their non-SOEs might be caught in frozen bureaucratic gears (e.g. Wei 2001). Expecting this, shareholders would price non-SOEs in less liberalised provinces lower on news of the anticorruption Policy. 

In more liberalised provinces, where market forces allocate resources, officials still solicit bribes, but as fees for passing artificial ‘toll booths’ they erect in non-SOEs paths. The new Policy was designed to suppress this behaviour, freeing non-SOEs of these tollbooth fees. Expecting this, shareholders would price non-SOEs in more liberalised provinces higher on news of the anticorruption Policy.

Figure 2, based on findings in Lin et al. (2017), shows exactly this pattern across portfolios of mainland traded shares. SOE shares gain on news of the reform. Non-SOEs in economically liberalised provinces also gain, but non-SOEs in less reformed provinces drop sharply. 

With the announcement of anticorruption reforms, investors “expect[ed] curtailed corruption to advantage non-SOEs previously more encumbered by official ‘toll booths’. Their regressions also show more non-SOEs with higher productivity, more external financing needs, and greater growth potential gaining more on news of the Policy if located in more liberalised provinces.” Furthermore, “Li et al. (2017) find evidence of a shift in credit allocation towards non-SOEs and away from SOEs as the anticorruption reforms took hold. Event studies of subsequent news of follow-on provincial anticorruption policies show non-SOEs, but not SOEs, gaining more (e.g. Ding et al. 2017). These findings are readily interpretable as reinforcing Lin et al.’s findings – investors’ initial expectations about the impact of reforms on SOEs remained unchanged, but the provincial buy-ins led investors to further boost the valuations on non-SOEs in more liberalised provinces.” The authors conclude,

Reducing corruption creates more value where market reforms are already more fully implemented. If officials, rather than markets, allocate resources, bribes can be essential to grease bureaucratic gears to get anything done. Thus, non-SOEs stocks actually decline in China’s least liberalised provinces – e.g. Tibet and Tsinghai – on news of reduced expected corruption. These very real costs of reducing corruption can stymie reforms, and may explain why anticorruption reforms often have little traction in low-income countries where markets also work poorly.   

China has shown the world something interesting: prior market reforms clear away the defensible part of opposition to anticorruption reforms. Once market forces are functioning, bribe-soliciting officials become a nuisance rather than tools for getting things done. Eliminating pests is more popular than taking tools away.    

These patterns in Chinese stock price reactions to news of a genuinely unexpected and seemingly real anticorruption reform suggest the existence of a feedback loop that reform-minded leaders might activate. Market reforms clear the way for anticorruption reforms, and create an advantage for more productive market-ready private sector firms. These are the sorts of firms that are more likely to invest shareholders’ money in productivity-enhancing growth opportunities and less willing to pay bribes. As these firms grow stronger and more important, their self-interest in further market liberalisation and anticorruption reforms would lead them to support political leaders advocating further such reforms. A self-reinforcing upward spiral towards increased wealth and better institutions ensues. 

A virtuous cycle ensues – persistent anticorruption efforts encourage market-oriented behaviour, which makes anticorruption reforms more effective, which further encourages market oriented behaviour. President Xi is right to state that anticorruption reforms are the path to developing high-quality market institutions.

The DR Book Collection: Catch-Up #3

This is part of the DR Book Collection.

I’m once again behind on my book reviews, so here’s a list of the books I’ve read recently, their descriptions, and accompanying videos.

Image result for religious literacyStephen Prothero, Religious Literacy: What Every American Needs to Know–And Doesn’t (HarperCollins, 2007): “The United States is one of the most religious places on earth, but it is also a nation of shocking religious illiteracy.

  • Only 10 percent of American teenagers can name all five major world religions and 15 percent cannot name any.
  • Nearly two-thirds of Americans believe that the Bible holds the answers to all or most of life’s basic questions, yet only half of American adults can name even one of the four gospels and most Americans cannot name the first book of the Bible.

Despite this lack of basic knowledge, politicians and pundits continue to root public policy arguments in religious rhetoric whose meanings are missed—or misinterpreted—by the vast majority of Americans. “We have a major civic problem on our hands,” says religion scholar Stephen Prothero. He makes the provocative case that to remedy this problem, we should return to teaching religion in the public schools. Alongside “reading, writing, and arithmetic,” religion ought to become the “Fourth R” of American education. Many believe that America’s descent into religious illiteracy was the doing of activist judges and secularists hell-bent on banishing religion from the public square. Prothero reveals that this is a profound misunderstanding. “In one of the great ironies of American religious history,” Prothero writes, “it was the nation’s most fervent people of faith who steered us down the road to religious illiteracy. Just how that happened is one of the stories this book has to tell.” Prothero avoids the trap of religious relativism by addressing both the core tenets of the world’s major religions and the real differences among them. Complete with a dictionary of the key beliefs, characters, and stories of Christianity, Islam, and other religions, Religious Literacy reveals what every American needs to know in order to confront the domestic and foreign challenges facing this country today” (Amazon).

Image result for the 16 strivings for godSteven Reiss, The 16 Strivings for God: The New Psychology of Religious Experience (Mercer University Press, 2015): “This ground-breaking work will change the way we understand religion. Period. Previous scholars such as Freud, James, Durkheim, and Maslow did not successfully identify the essence of religion as fear of death, mysticism, sacredness, communal bonding, magic, or peak experiences because religion has no single essence. Religion is about the values motivated by the sixteen basic desires of human nature. It has mass appeal because it accommodates the values of people with opposite personality traits. This is the first comprehensive theory of the psychology of religion that can be scientifically verified. Reiss proposes a peer-reviewed, original theory of mysticism, asceticism, spiritual personality, and hundreds of religious beliefs and practices. Written for serious readers and anyone interested in psychology and religion (especially their own), this eminently readable book will revolutionize the psychology of religious experience by exploring the motivations and characteristics of the individual in their religious life” (Amazon).

Image result for free meleAlfred R. Mele, Free: Why Science Hasn’t Disproved Free Will (Oxford University Press, 2014): “Does free will exist? The question has fueled heated debates spanning from philosophy to psychology and religion. The answer has major implications, and the stakes are high. To put it in the simple terms that have come to dominate these debates, if we are free to make our own decisions, we are accountable for what we do, and if we aren’t free, we’re off the hook. There are neuroscientists who claim that our decisions are made unconsciously and are therefore outside of our control and social psychologists who argue that myriad imperceptible factors influence even our minor decisions to the extent that there is no room for free will. According to philosopher Alfred R. Mele, what they point to as hard and fast evidence that free will cannot exist actually leaves much room for doubt. If we look more closely at the major experiments that free will deniers cite, we can see large gaps where the light of possibility shines through. In Free: Why Science Hasn’t Disproved Free Will, Mele lays out his opponents’ experiments simply and clearly, and proceeds to debunk their supposed findings, one by one, explaining how the experiments don’t provide the solid evidence for which they have been touted. There is powerful evidence that conscious decisions play an important role in our lives, and knowledge about situational influences can allow people to respond to those influences rationally rather than with blind obedience. Mele also explores the meaning and ramifications of free will. What, exactly, does it mean to have free will — is it a state of our soul, or an undefinable openness to alternative decisions? Is it something natural and practical that is closely tied to moral responsibility? Since evidence suggests that denying the existence of free will actually encourages bad behavior, we have a duty to give it a fair chance” (Amazon).

Image result for human capitalismBrink Lindsey, Human Capitalism: How Economic Growth Has Made Us Smarter–and More Unequal (Princeton University Press, 2013): “What explains the growing class divide between the well educated and everybody else? Noted author Brink Lindsey, a senior scholar at the Kauffman Foundation, argues that it’s because economic expansion is creating an increasingly complex world in which only a minority with the right knowledge and skills–the right “human capital”–reap the majority of the economic rewards. The complexity of today’s economy is not only making these lucky elites richer–it is also making them smarter. As the economy makes ever-greater demands on their minds, the successful are making ever-greater investments in education and other ways of increasing their human capital, expanding their cognitive skills and leading them to still higher levels of success. But unfortunately, even as the rich are securely riding this virtuous cycle, the poor are trapped in a vicious one, as a lack of human capital leads to family breakdown, unemployment, dysfunction, and further erosion of knowledge and skills. In this brief, clear, and forthright eBook original, Lindsey shows how economic growth is creating unprecedented levels of human capital–and suggests how the huge benefits of this development can be spread beyond those who are already enjoying its rewards” (Amazon).

Image result for better than beforeGretchen Rubin, Better Than Before: What I Learned About Making and Breaking Habits–to Sleep More, Quit Sugar, Procrastinate Less, and Generally Build a Happier Life (Broadway Books, 2015): “How do we change? Gretchen Rubin’s answer: through habits. Habits are the invisible architecture of everyday life. It takes work to make a habit, but once that habit is set, we can harness the energy of habits to build happier, stronger, more productive lives. So if habits are a key to change, then what we really need to know is: How do we change our habitsBetter than Before answers that question. It presents a practical, concrete framework to allow readers to understand their habits—and to change them for good. Infused with Rubin’s compelling voice, rigorous research, and easy humor, and packed with vivid stories of lives transformed, Better than Before explains the (sometimes counter-intuitive) core principles of habit formation. Along the way, Rubin uses herself as guinea pig, tests her theories on family and friends, and answers readers’ most pressing questions—oddly, questions that other writers and researchers tend to ignore:

• Why do I find it tough to create a habit for something I love to do?
• Sometimes I can change a habit overnight, and sometimes I can’t change a habit, no matter how hard I try. Why?
• How quickly can I change a habit?
• What can I do to make sure I stick to a new habit?
• How can I help someone else change a habit?
• Why can I keep habits that benefit others, but can’t make habits that are just for me?

Whether readers want to get more sleep, stop checking their devices, maintain a healthy weight, or finish an important project, habits make change possible. Reading just a few chapters of Better Than Before will make readers eager to start work on their own habits—even before they’ve finished the book” (Amazon).

Image result for the hikeDrew Magary, The Hike: A Novel (Penguin, 2016): “When Ben, a suburban family man, takes a business trip to rural Pennsylvania, he decides to spend the afternoon before his dinner meeting on a short hike. Once he sets out into the woods behind his hotel, he quickly comes to realize that the path he has chosen cannot be given up easily. With no choice but to move forward, Ben finds himself falling deeper and deeper into a world of man-eating giants, bizarre demons, and colossal insects. On a quest of epic, life-or-death proportions, Ben finds help comes in some of the most unexpected forms, including a profane crustacean and a variety of magical objects, tools, and potions. Desperate to return to his family, Ben is determined to track down the “Producer,” the creator of the world in which he is being held hostage and the only one who can free him from the path. At once bitingly funny and emotionally absorbing, Magary’s novel is a remarkably unique addition to the contemporary fantasy genre, one that draws as easily from the world of classic folk tales as it does from video games. In The Hike, Magary takes readers on a daring odyssey away from our day-to-day grind and transports them into an enthralling world propelled by heart, imagination, and survival” (Amazon).

Does Pot Legalization Decrease Drug-Related Violence?

Yes, according to a new economics paper. From an earlier draft,

To test our theory we use crime data from several different sources. First, we use the Uniform Crime Report (UCR) data, which is a panel data set with violent and property crime rates for each county, split into seven crime categories. Out of these seven, our analysis focuses on homicides, aggravated assaults, and robberies as these crimes are often connected to activities of DTOs and their affiliated gangs (see NGIC, 2011). Given that we focus on identifying supply side effects we abstract from analyzing property crime which might be more likely to be influences by the demand side. Second, we use the Supplementary Homicide Reports (SHR) data, which gives information on the circumstances surrounding homicides committed in the US. This data allows us to see whether homicides are related to drug violence. Both data sets cover the period 1994-2012.

Our main analysis applies a difference-in-difference-in-difference (DDD) methodology where we divide counties in four groups depending on i.) whether the county is located in a Mexican border state or an inland state, and ii.) whether the state introduced M[edical] M[arijuana] L[aws] or not. The DDD methodology allows us to fully control for all shocks to the crime rate that affect all states on the border. Examples of such shocks are increases in border patrols and Mexican law enforcement. In addition, we explicitly control for observable confounding factors that may be correlated to both the introduction of MML and the crime rate, and we include state-linear time trends to control for possible unobservable confounding factors. We augment the analysis, by adding a specification where we interact the treatment dummy for the introduction of MML with the distance to the border. This allows us to verify that within Mexican-border states the effect of MML on crime is strongest for counties located close to the border.

…Turning to our main result, we show that MML lead to a strong reduction in the violent crime rate for counties in Mexican-border states. In these counties the violent crime rate decreases by between 10-20 percent depending on the specification. The decrease is strongest in robberies which decrease by 26 percent, followed by homicides at 11 percent and aggravated assaults with 10 percent. When we consider the distance to the border, we find that the strongest decrease in the violent crime rate occurs in counties in close proximity to the border while the effect weakens with the distance of a given county from the border. We find no robust significant effect of MML on crime in counties that are located more than 350 kilometer from the border.

Our point estimates suggest that crime decreases in all 3 border states that have introduced MML. However, the effect is most robust in California. This may be due to the fact that California has a higher take up rate of medical marijuana, as measured by high density of dispensaries within the state.

Our analysis of the SHR data reveals that MML decrease drug-law, juvenile-gang, and robbery related homicides by 46, 34, and 30 percent, respectively within states on the Mexican border. This result is strongly suggestive of the fact that MML in the Mexican-border region are effective in reducing drug-trade and gang-related crimes (pgs. 3-4).

Drug legalization is doing what economists said it would do. Fancy that.

Trump’s Approval Ratings Among Religions

Well, this is disappointing:

President Donald Trump received well-above-average job approval ratings in 2017 from Mormons and Protestants, and well-below-average ratings from those who identify with a non-Christian faith, including Muslims and Jews, and from those who have no formal religious identity. Catholics’ approval of Trump roughly matched the national average.

  • Mormon: 61%
  • Protestant/Other Christian: 48%
  • National adults: 39%
  • Catholic: 38%
  • Jewish: 26%
  • None/Atheist/Agnostic: 23%
  • Other non-Christian religion: 22%
  • Muslim: 18%

The hell people?[ref]Obama’s rating among Mormons was equivalent to Muslims under Trump.[/ref]