What Are the Effects of Housing Constraints on Economic Growth?

According to a new working paper, the effects are huge:

Image result for housingWe use data from 220 metropolitan areas in the US from 1964 to 2009 to perform two calculations. First, we quantify the effect of spatial misallocation. We find that most of the increased spatial dispersion in the marginal product of labor is due to the growing spatial dispersion in housing prices. In turn, the growing spatial dispersion of housing prices is largely driven by strict zoning laws in cities such as New York and the San Francisco Bay Area with strong productivity growth. We find that the increased spatial misallocation of labor due to housing supply constraints in cities with high productivity growth rates lowered aggregate growth by almost 50% between 1964 and 2009.

Second, we calculate the contribution of each US city to aggregate US growth and compare it to an “accounting” measure based solely on the growth of the city’s GDP. The difference reflects the effect of a city’s growth on the efficiency of labor allocation across cities. While the accounting measure suggests that New York, San Francisco and San Jose’s contribution to aggregate GDP growth between 1964 and 2009 is 12%, viewed through the lenses of our model, these cities were only responsible for 5% of growth. The difference is because the aggregate benefit of TFP growth in New York and Bay Area was in part offset by increased misallocation of labor across cities. In contrast, for Southern cities the accounting and model-based measures are the same. Due to an elastic supply of housing, much of the growth in the South took the form of employment growth, with no effect on misallocation.

We conclude that local land use regulations that restrict housing supply in dynamic labor markets have important externalities on the rest of the country. Incumbent homeowners in high productivity cities have a private incentive to restrict housing supply. By doing so, these voters de facto limit the number of US workers who have access to the most productive of American cities. In general equilibrium, this lowers income and welfare of all US workers (pgs. 2-3; bold mine).

We’ve blasted zoning laws here at Difficult Run several times before. Just one more reason to do so.

Do Immigrants Assimilate?

Image result for you will be assimilated

“In the past,” writes one pair of economists,

new immigrants arrived from Southern and Eastern Europe, joining earlier waves of migrants from Britain, Germany and Ireland. Today, many immigrants hail from Latin America and Asia, entering a country that is already more diverse. Are fears that immigrants retain their own cultural practices and fail to fully join American society justified by the data?

In recent work with our co-author Katherine Eriksson, we study the cultural assimilation of immigrants during the Age of Mass Migration (1850-1913), during which 30 million migrants moved from Europe to the US (Abramitzky et al. 2016). We trace out a ‘cultural assimilation profile’ with time spent in the US, using changes in the foreignness of names that immigrant parents selected for their children as a measure of cultural adaptation. Children’s names offer an attractive measure of the assimilation process, both because names carry cultural content and because naming is a pure choice for immigrant parents, unconstrained by financial limitations or by discrimination on the part of natives. In particular, we measure the relative probability that each first name was held by a foreigner versus a native in the 1920 Census, and use this to construct a Foreignness Index, a measure between zero (name only held by natives) and one (name only held by foreigners).

By this measure, we find that recent immigrants gave their children more foreign names than did long-standing immigrants, which we take to be evidence of cultural assimilation with time spent in the US.

This change in names yielded benefits for the children of immigrants:

We link over a million children of immigrants across historical Censuses from their childhood families in 1920 into adulthood in 1940, and find that children with less foreign names completed more years of schooling, earned more and were less likely to be unemployed. Children with less foreign names were also less likely to marry a spouse who was born abroad or who had a very foreign name herself.

To summarize,

Despite arriving with a distinct set of cultural practices (proxied here by name choices), immigrants closed half of their cultural gap with natives after 20 years in the US. By 1930, more than two-thirds of immigrants had applied for US citizenship and almost all reported some ability to speak English. A third of first-generation immigrants who arrived in the US before marrying and more than half of second-generation immigrants married spouses from different origins.

I’m really not all that worried about cultural diversity. But for those who are, looks like you don’t have much to fear from immigrants.

The Economic Consequences of Political Partisanship

Image result for partisanship

I’ve mentioned the tribal nature of politics before and its tendency to make us mean and dumb. Now check out the findings from a new paper:

In the first experiment, carried out in a nationwide online labor market, we assess whether partisan congruence between employer and employee influences the willingness of the latter to work, as well as the quality of work they perform. We do so by tracking the wage proposals and task performance of freelance editors when the document they edit indicates whether their employers are co-partisans or supporters of the out-party. Study 2 examines whether partisan considerations also affect consumer behavior. Specifically, we explore whether people are less likely to pursue an attractive purchasing opportunity if the seller is affiliated with the out-party, and more likely to do so if the seller is a co-partisan. We conducted another field experiment that uses an online marketplace to study this question in a more naturalistic setting, albeit one that relies on ecological inferences. Finally, we replicate these patterns in the context of an incentivized, population-based survey experiment, where we find that fully three-quarters of respondents are willing to forego higher personal remuneration to avoid benefitting the opposing party.

Taken together, our studies offer substantial evidence that partisanship shapes real-world economic decisions. All four experiments offer evidence that partisanship influences economic behavior even when there are real pecuniary or professional costs. Although the effect sizes vary somewhat across contexts, in some situations, they are quite large. For example, the effect of partisanship on reservation wages in the labor market experiment is comparable to the effect of task-relevant skills such as education and experience. In the marketplace, consumers are much more likely—almost two times as likely—to engage in a transaction when their partisanship matches that of the seller. In our survey experiment, three quarters of all subjects forego a higher monetary payment to avoid helping the other party. We show that these effects of partisanship are at least as large as the effects of religion, another well-known and salient social cleavage. Even among weak or leaning partisans, fully two-thirds of them reject the partisan offer. In sum, partisanship’s effect on economic decisions is not only real but often also sizable, extending throughout the electorate.

…The results underscore the power of partisanship as a social identity in an era of polarized parties—partisanship can shape apolitical behavior, including economic transactions. The results also call for paying greater attention to potential discrimination based on partisan affiliation. To date, few social norms are in place to constrain it, as they are with respect to unequal treatment along other social divides (e.g., race and gender). Our analysis suggests that partisan-based discrimination may occur even in the most basic economic settings, and as such should be the subject of more systematic scrutiny (pgs. 3-5).

Hooligans in action.

Solving Conflict With Business

From the World Economic Forum:

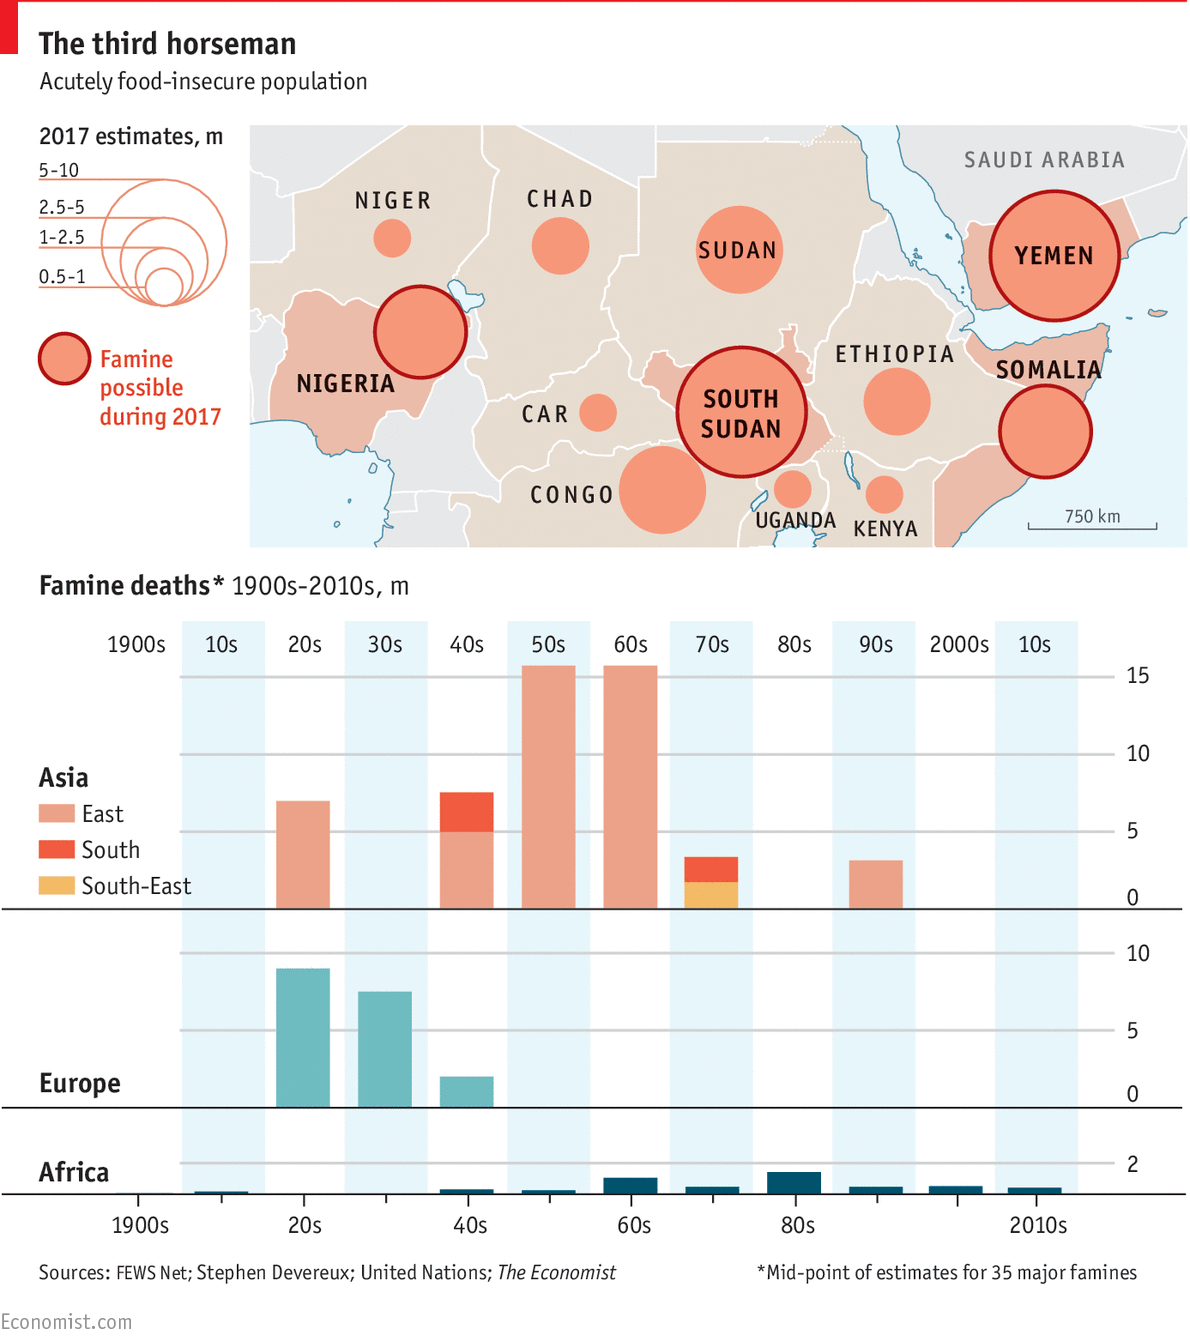
Last year, the World Bank revised its position on conflict – upgrading it from being one of many drivers of suffering and poverty, to being the primary driver. In Somalia, despite some political progress, the conflict has put more than half the population in need of assistance, with 363,000 children suffering acute malnutrition. In Nigeria, conflict with Boko Haram in the country’s northeast has left 1.8 million people still displaced, farmers unable to grow crops, and 4.8 million people in need of food assistance. In Yemen, an escalation in conflict since 2015 has worsened a situation already made dire by poor governance, poverty and weak rule of law. Now more than 14 million people need food aid.

Only if we understand conflict can we understand these hunger crises…Across the places we work, where people are facing starvation, the pattern is the same. Hunger is not some freak environmental event; it is human-made, the result of a deadly mix of conflict, marginalization, and weak governance…In South Sudan, as in Somalia, Nigeria and Yemen it is not generally a lack of food that has caused famine-like conditions to occur. The crises exist because of violence and conflict. They don’t need more food, they need investment into conflict prevention and the stability that brings.

Who do they turn to to help stabilize these conflict-prone regions? Businesses:

The World Economic Forum’s Global Agenda Council on Fragility, Violence and Conflict found that corporate partners can foster stable, inclusive and prosperous societies that respect the rule of law and benefit from accountable governance. Both local and multinational businesses can play an important role, often working alongside each other to support and grow local and national economies and, in the process, help support efforts undertaken by others to reduce fragility and conflict.

The WE Forum has highlighted the way businesses can foster peace before.[ref]You can find the referenced study here.[/ref] Business leaders should take note.

Quality vs. Size of Government

Economist Ed Dolan has a couple of interesting posts at the Niskanen Center. His first one draws on data from the Economic Freedom of the World index, the Legatum Prosperity Index, and the Human Freedom Index. Based on his breakdown, personal freedom and economic freedom are positively correlated.

freedom1

And while the relationship between personal freedom and economic freedom and real GDP is nonlinear, a “one-point increase in EFI is…associated with a 0.61 point increase in the PFI rather than the 0.91 point increase that was estimated without including GDP.  All of these results are statistically significant at a 0.01 level of confidence.”

freedom2

In short, “personal freedom and economic freedom are positively associated with each other, and…both freedom indexes are positively associated with prosperity as measured by real GDP per capita. Good libertarians should expect these results and be gratified to find them confirmed.”

These indices also demonstrate that “human freedom in both its economic and personal manifestations contributes positively to human well-being as measured by data on education, health, and personal safety—another result sure to please libertarian readers.”

p170326-1

And yet, “[w]hen we look at the simple correlations between the personal freedom index and the EFI components, we find they are all are positive, as expected, except that for the size of government (SoG), which is negative. The correlation of SoG with the personal freedom index is -0.16. Remember that for all components of the EFI, a higher value means more freedom, so the negative coefficient means that a larger government is associated with greater freedom. That is not what most libertarians would expect. Is this just an anomaly or a real statistical regularity?”

After pointing out some of the shortcomings of the EFI’s “size of government” measure, Dolan instead employs data regarding the ratio of total government expenditures to GDP from the IMF World Economic Outlook. Check the comparisons below:

p170413-1

p170413-2

What these measurements show is:

  1. First, the data appear to support notion that economic freedom makes a positive contribution to personal freedom and prosperity. That holds true whether we measure prosperity in a narrowly economic sense, as GDP per capita, or in a broader sense, using noneconomic indicators of education, health, and personal safety.
  2. Second, the data do not support the notion that a larger government is necessarily detrimental to either freedom or prosperity.  On the contrary, countries with larger government sectors tend to have more personal freedom and higher indicators of education, health, and personal safety.

I’m reminded of Nathaniel’s review of Francis Fukuyama’s books on political order: “Fukuyama is dismissive of arguments about the quantity of government in favor of arguments about the quality of government.” In Dolan’s second post, he attempts to measure the quality of government using subsets of the same three databases as before:

  • “Legal system and property rights” (EFI): “indicators of judicial independence, impartiality of courts, and protection of property rights.”
  • “Rule of Law” (HFI): “indicators of procedural justice, civil justice, and criminal justice. These subcomponents consider factors such as adherence to due process and the presumption of innocence, the risk of arbitrary arrest, and the degree to which civil and criminal courts are subject to corruption and improper government influence.”
  • “Governance” (LPI): “measures of confidence in the government and elections; the corruption perceptions index from Transparency International; a measure of the level of democracy; and an overall measure of government effectiveness from the World Bank’s Doing Business survey.”

Check out how quality and size of government go together below:

image1

And to drive the point home:

image3

Dolan obviously provides much more detailed explanations than what I’ve shown here, but the graphs alone should make his conclusions fairly clear:

  • The size of government per se is not an especially useful indicator. Simple correlations based on cross-country data suggest that by and large, people who live in countries with relatively large governments, as measured by the share of GDP devoted to government spending, are better educated, healthier, safer, and generally more prosperous. They also tend to enjoy greater personal freedoms.
  • On the other hand, cross-country data on the rule of law, protection of property rights, and other measures of the quality of government show strong, positive associations with quantitative indicators of freedom and prosperity.
  • When size and quality indicators are compared directly, using multivariate analysis that controls for the effects of per-capita GDP, quality dominates. In such tests, the size of government turns out to have little effect one way or the other on most measures of freedom and prosperity.

Dolan is quick to point out, “There is a lot of variety in the world. Too strong a focus either on statistical regularities or on selected outliers can draw us too strongly toward conclusions that, in reality, admit of many exceptions. For example, the small-government city states of Singapore and Hong Kong are rightly admired for their prosperity and economic freedoms. However, it gives one pause to note how many small-government countries enjoy neither. Chad, Bangladesh, and the Democratic Republic of Congo, labeled in the chart, are just the outliers among a whole cluster of countries in that category.”

Perhaps the focus should be on improving our government rather than simply shrinking it.


An Economic View of Mental Health

Image result for mental health work

“The factors involved in mental health are many and varied,” writes economist Isamu Yamamoto,

but for a working person, work styles in the workplace are an important factor. For example, if workers have to put in long hours, have little discretion over their work, or get few opportunities to change assignments or workplaces, this adds to their stress and increases the likelihood of deteriorating mental health.

On the other hand, there has been little research on mental health problems in the field of labour economics, which focuses on analysing work styles in the workplace. As for Japanese work styles, we see moves everywhere to try to change from so-called ‘Japanese employment’ practices. New aspects now include reducing long working hours, seeking a better work/life balance, diversity management, and encouraging women to be more involved in the workplace. These moves suggest that work styles under conventional Japanese employment practices create some kind of difficulty for workers. In other words, there are concerns that work styles under Japanese employment practices are a major factor in causing mental health to deteriorate.

In Yamamoto’s view, there are at least two economic approaches that could be utilized regarding mental health research:

  1. “The first approach is to reveal the characteristics of work styles, based on labour supply-and-demand mechanisms and internal labour market models, and use those characteristics to explain the impact that work styles have on workers’ mental health and the role of the business in mental health.”
  2. “The other approach is to reveal work style factors that impact mental health from observed data (controlling for heterogeneities between individual employees and businesses, and other noise), and to show how mental health affects objective indicators such as business productivity and profitability.”

Using findings from the Labor Market Analysis Using Matched Employer-Employee Panel Data research project, Yamamoto provides the following insights:

First, the research shows that factors affecting employees’ mental health include long work hours, job characteristics, workplace management methods, workplace climate, job transfers, and promotions, among others (Kuroda and Yamamoto 2016a, Sato 2016). Second, mechanisms that cause employee mental health to deteriorate include working irrationally long work hours because of such psychological tendencies as overconfidence bias (i.e. the employee has too much confidence in his or her own health), which could result in unexpected health damage (Kuroda and Yamamoto 2016b). Research also has looked at the impact of deteriorating mental health on corporate performance, with the results showing that businesses with higher sick leave or turnover rates of employees with mental disorders tend to have poorer performance as measured by return on sales (Kuroda and Yamamoto 2016c).

There are still just a few examples of research that validate mental health problems from an economic perspective, and more research needs to be done. Moreover, mental health is a major issue that is relevant to a number of fields, including medicine, epidemiology, industrial health, and psychology. As such, it is important to address it with interdisciplinary research, and researchers in various fields should collaborate in this regard.

How Important is Human Capital for Economic Development?

Image result for human capital

How important was human capital–specialized scientific knowledge typically in the hands of relatively few elites–to the British Industrial Revolution? According to a 2016 working paper, not as important as you’d think. Economist B. Zorina Khan finds that “evidence from the backgrounds and patenting of the great inventors in Britain suggest that the formal acquisition of human capital did not play a central role in the generation of new inventive activity, especially in the period before the second industrial revolution” (pg. 21). It turns out that “scientists were not well-represented among the great British inventors nor among patentees during the height of industrial achievements…Instead, many of the most productive inventors, such as Charles Tennant, were able to acquire or enhance their inventive capabilities through apprenticeships and informal learning, honed through trial and error experimentation” (pg. 23).

By examining the patent record, Khan finds that

the patterns are consistent with the notion that at least until 1870 a background in science did not add a great deal to inventive productivity. If scientific knowledge gave inventors a marked advantage, it might be expected that they would demonstrate greater creativity at an earlier age than those without such human capital. Inventor scientists were marginally younger than nonscientists, but both classes of inventors were primarily close to middle age by the time they obtained their first invention (and note that this variable tracks inventions rather than patents). Productivity in terms of average patents filed and career length are also similar among all great inventors irrespective of their scientific orientation. Thus, the kind of knowledge and ideas that produced significant technological contributions during British industrialization seem to have been rather general and available to all creative individuals, regardless of their scientific training (pg. 18).

In short,

The overall empirical findings together suggest that, by focusing their efforts in a particular industry, relatively uneducated inventors were able to acquire sufficient knowledge that allowed them to make valuable additions to the available technology set. After 1820, as the market expanded and created incentives to move out of traditional industries such as textiles and engines, both scientists and nonscientists responded by decreasing their specialization. The patent reforms in 1852 encouraged the nonscience-oriented inventors to increase their investments in sectoral specialization, but industrial specialization among the scientists lagged significantly. This is consistent with the arguments of such scholars as Joel Mokyr, who argued that any comparative advantage from familiarity with science was likely based on broad unfocused capabilities such as rational methods of analysis that applied across all industries (pg. 20).

“More generally,” she writes,

the experience of the First Industrial Nation indicates that creativity that enhances economic efficiency is somewhat different from additions to the most advanced technical discoveries. The sort of creativity that led to spurts in economic and social progress comprised insights that were motivated by perceived need and by institutional incentives, and could be achieved by drawing on practical abilities or informal education and skills. Elites and allegedly “upper-tail knowledge” were neither necessary nor sufficient for technological productivity and economic progress. In the twenty-first century, specialized human capital and scientific knowledge undoubtedly enhance and precipitate economic growth in the developed economies. However, for developing countries with scarce human capital resources, such inputs at the frontier of “high technology” might be less relevant than the ability to make incremental adjustments that can transform existing technologies into inventions that are appropriate for general domestic conditions. As Thomas Jefferson pointed out, a small innovation that can improve the lives of the mass of the population might be more economically important than a technically-advanced discovery that benefits only the few (pgs. 23-24).

I’m reminded of something Matt Ridley said in his TED talk years ago:

We’ve gone beyond the capacity of the human mind to an extraordinary degree. And by the way, that’s one of the reasons that I’m not interested in the debate about I.Q., about whether some groups have higher I.Q.s than other groups. It’s completely irrelevant. What’s relevant to a society is how well people are communicating their ideas, and how well they’re cooperating, not how clever the individuals are. So we’ve created something called the collective brain. We’re just the nodes in the network. We’re the neurons in this brain. It’s the interchange of ideas, the meeting and mating of ideas between them, that is causing technological progress, incrementally, bit by bit…Because through the cloud, through crowd sourcing, through the bottom-up world that we’ve created, where not just the elites but everybody is able to have their ideas and make them meet and mate, we are surely accelerating the rate of innovation.

The State of Social Mobility Research

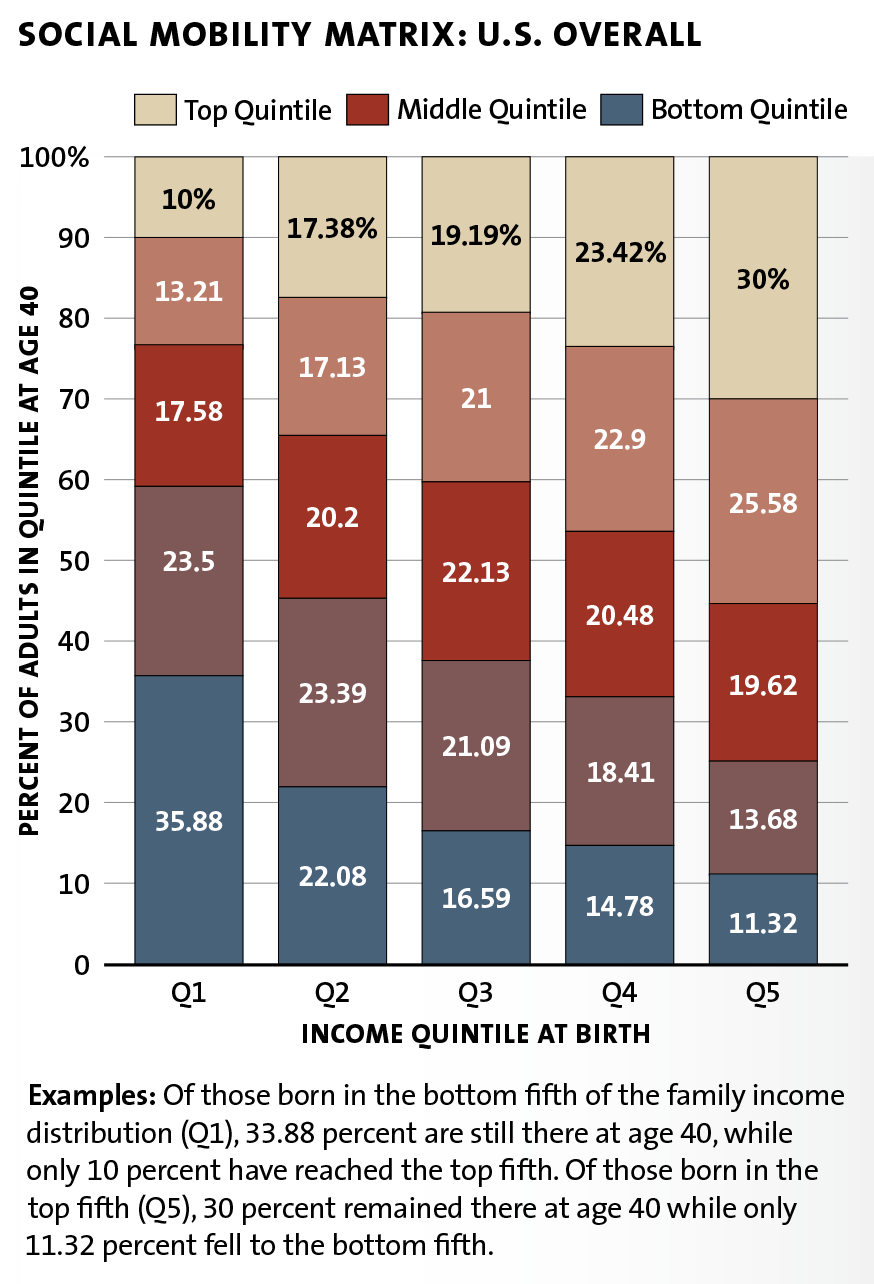
Brookings scholars Richard Reeves and Isabel Sawhill have an informative article in the Milken Institute Review that provides a nice summary of the research on social mobility. “So how are we doing?” they ask.

The good news is that economic standards of living have improved over time. Most children are therefore better off than their parents. Among children born in the 1970s and 1980s, 84 percent had higher incomes (even after adjusting for inflation) than their parents did at a similar age, according to a Pew study. Absolute upward income mobility, then, has been strong, and has helped children from every income class, especially those nearer the bottom of the ladder. More than 9 in 10 of those born into families in the bottom fifth of the income distribution have been upwardly mobile in this absolute sense.

That’s good news, but “[t]here’s a catch…Strong absolute mobility goes hand in hand with strong economic growth. So it is quite likely that these rates of generational progress will slow, since the potential growth rate of the economy has probably diminished.” Furthermore, “[i]f you are born to parents in the poorest fifth of the income distribution, your chance of remaining stuck in that income group is around 35 to 40 percent. If you manage to be born into a higher-income family, the chances are similarly good that you will remain there in adulthood. It would be wrong, however, to say that class positions are fixed. There is still a fair amount of fluidity or social mobility in America – just not as much as most people seem to believe or want. Relative mobility is especially sticky in the tails at the high and low end of the distribution. Mobility is also considerably lower for blacks than for whites, with blacks much less likely to escape from the bottom rungs of the ladder. Equally ominously, they are much more likely to fall down from the middle quintile.”

But are these rates of relative mobility getting worse? “Current evidence suggests not. In fact, the trend line for relative mobility has been quite flat for the past few decades, according to work by Raj Chetty of Stanford and his co-researchers. It is simply not the case that the amount of intergenerational relative mobility has declined over time.”

social mobility chart 01

Some other interesting points:

  • “Interestingly, the most recent research suggests that the United States stands out most for its lack of downward mobility from the top.”
  • Pioneering work (again by Raj Chetty and his colleagues) shows that some cities have much higher rates of upward mobility than others. From a mobility perspective, it is better to grow up in San Francisco, Seattle or Boston than in Atlanta, Baltimore or Detroit. Families that move to these high-mobility communities when their children are still relatively young enhance the chances that the children will have more education and higher incomes in early adulthood. Greater mobility can be found in places with better schools, fewer single parents, greater social capital, lower income inequality and less residential segregation.”
  • The Social Genome Project “tracks children’s progress through multiple life stages with a corresponding set of success measures at the end of each…Three findings from the model stand out. First, it’s clear that success is a cumulative process. According to our measures, a child who is ready for school at age 5 is almost twice as likely to be successful at the end of elementary school as one who is not…Children who get off track at an early age frequently get back on track at a later age; it’s just that their chances are not nearly as good. So this is a powerful argument for intervening early in life. But it is not an argument for giving up on older youth.”
  • “Second, the chances of clearing our last hurdle – being middle class by middle age (specifically, having an income of around $68,000 for a family of four by age 40) – vary quite significantly. A little over half of all children born in the 1980s and 1990s achieved this goal. But those who are black or born into low-income families were very much less likely than others to achieve this benchmark.”
  • “Third, the effect of a child’s circumstances at birth is strong. We use a multidimensional measure here, including not just the family’s income but also the mother’s education, the marital status of the parents and the birth weight of the child. Together, these factors have substantial effects on a child’s subsequent success. Maternal education seems especially important.”

Check out the full article.

Does the Work Test Work?

In the United States, “to be eligible for UI benefits, a claimant initially needs an adequate work history and must have lost her job through lack of work and no fault of her own. In addition, to remain eligible, the worker must be “able, available, and searching” for work—that is, must satisfy the work test.” A 2016 study[ref]An earlier, ungated version can be found here.[/ref] “examine[s] effects on earnings, hours worked, employment, and job match quality in the nine years following the experiment. Among UI recipients as a whole, the effects of the work test were negligible, counter to the hypothesis that the work test may harm long-term earnings. But for permanent job losers, the work test reduced time to reemployment by 1–2 quarters, and increased job tenure with the first post-claim employer by about 2 quarters. Also, we find that the work test selected lower-wage workers into reemployment. Accordingly, the work test may be an important policy for improving the reemployment prospects of lower-wage, permanent job losers.”

Capture d’écran 2016-08-12 à 09.04.53

Infrastructure, Knowledge, and Technological Progress

Alice Austen-Vintage Photos-NYC-Mailman

“In a recent working paper,” economist Daron Acemoglu and colleagues “empirically tests the hypothesis that the US government’s infrastructural capacity helped drive innovation during the 19th century (Acemoglu et al. 2016). Our results suggest that, notwithstanding the view that the American state was weak in the 19th century, a major part of the explanation for US technological progress and prominence is the way in which the US developed an effective state.” Using the U.S. Post Office as a proxy and relying on “historical records compiled by the US Postmaster General,” the researchers

determined how many post offices were in each US county for several years between 1804 and 1899. As a measure of county-level innovative activity, [they] use the number of patents granted to inventors living in the county (these data are presented in Akcgit et al. 2013). There are several reasons for expecting the number of post offices to impact the number of patent grants. First, post offices facilitated the spread of ideas and knowledge. Second, more prosaically, the presence of a post office made patenting much easier, in part because patent applications could be submitted by mail free of postage (Khan 2005, p. 59). Third, the presence a post office is indicative of – and thus the proxy for – the presence and functionality of the state in the area. This expanded state capacity may have meant greater access to legal services and regulation, or greater security of other forms of property rights, all of which are essential conditions for modern innovative activity.

The results?

We find a significant correlation between a history of state presence – using the number of post offices as a proxy – and patenting in US counties. We show that the correlation holds either using a sample of the 935 US counties that had been established by 1830, or using a sample to which counties are added as they were established between 1830 and 1890, ultimately reaching 2,644 in total. This relationship is not only statistically significant, but also economically meaningful. Our results suggest that the opening of a post office in a county that did not previously have a post office or patents on average increased the number of patents by 0.18 in the long run.  

…One concern with this initial set of results might be that they are confounded by the possibility that post offices were built in counties that already had more patenting activity. Though we cannot fully rule out such reverse causality concerns, we find no statistically or economically significant correlation between patenting and the number of post offices in a county in future years. This suggests that post offices led to patenting and not the other way around. Historical evidence also suggests that post offices were established for a range of idiosyncratic reasons during the 19th century, making it unlikely that reverse causality is driving the association.

…Taken together – while we do not establish unambiguously that the post office and greater state capacity caused an increase in patenting – our results highlight an intriguing correlation and suggest that the infrastructural capacity of the US state played an important role in sustaining 19th century innovation and technological change. In the current economic climate in which pessimism about US economic growth prospects is common, we present a more optimistic historical narrative in which government policy and institutional design have the power to support technological progress.

While I don’t dispute the importance of infrastructure and the role of the state in developing it, I’m curious if “state capacity” is the real takeaway from this study. To restate a section from above, “post offices facilitated the spread of ideas and knowledge” (italics mine). I’ve highlighted studies before that show how important social networks, communication capacity, and information flows are for decreasing poverty. These aspects are deemed more important than institutions. This seems to be the case with technological innovation as well. While the state can certainly help increase the spread of ideas, I wonder if post offices should be viewed less as “state capacity” and more as proxy for information flows.

Check out the study and determine for yourself.