Stuff I Say at School – Part VI: Economic Freedom & Corruption

This is part of the Stuff I Say at School series.

The Assignment

Response to a group’s summary of Jakob Svensson’s “Eight Questions About Corruption.”

The Stuff I Said

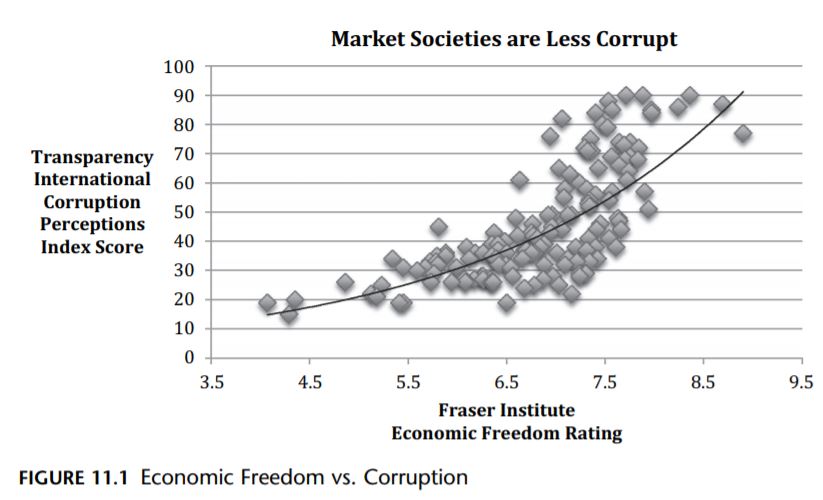
The Fraser Institute’s Economic Freedom of the World (EFW) Index, published in its annual Economic Freedom of the World reports, defines economic freedom based on five major areas: (1) size of the central government, (2) legal system and the security of property rights, (3) stability of the currency, (4) freedom to trade internationally, and (5) regulation of labour, credit, and business. According to its 2018 report (which looks at data from 2016), countries with more economic freedom have substantially higher per-capita incomes, greater economic growth, and lower rates of poverty. Drawing on the EFW Index, Georgetown political philosophers Jason Brennan and Peter Jaworski point to a strong positive correlation between a country’s degree of economic freedom and its lack of public sector corruption.

Granted, a lack of corruption could very well give rise to market reforms and increased economic freedom instead of the other way around. However, recent research on China’s anti-corruption reforms suggests that markets may actually pave the way for anti-corruption reforms. Summarizing the implications of this research, Lin et al. explain,

Reducing corruption creates more value where market reforms are already more fully implemented. If officials, rather than markets, allocate resources, bribes can be essential to grease bureaucratic gears to get anything done. Thus, non-[state owned enterprises’] stocks actually decline in China’s least liberalised provinces – e.g. Tibet and Tsinghai – on news of reduced expected corruption. These very real costs of reducing corruption can stymie reforms, and may explain why anticorruption reforms often have little traction in low-income countries where markets also work poorly. China has shown the world something interesting: prior market reforms clear away the defensible part of opposition to anticorruption reforms.Once market forces are functioning, bribe-soliciting officials become a nuisance rather than tools for getting things done. Eliminating pests is more popular than taking tools away … A virtuous cycle ensues – persistent anticorruption efforts encourage market-oriented behaviour, which makes anticorruption reforms more effective, which further encourages market oriented behaviour.

Interesting enough, there is some evidence that suggests that more government hands in the pies increases corruption. For example, a 2017 study found that larger municipality councils in Sweden result in more corruption problems. A 2009 study found that more government tiers and more public employees lead to more bribery. Finally, a 2015 study showed that high levels of regulation are associated with higher levels of corruption (likely because of regulatory capture).

The Economic Consequences of Tariffs

From a recent IMF working paper:

We use impulse response functions from local projections on a panel of annual data spanning 151 countries over 1963-2014. The main analysis on aggregate data is complemented with industry-level data.

Our results suggest that tariff increases have an adverse impact on output and productivity; these effects are economically and statistically significant. They are magnified when tariffs are used during expansions, for advanced economies, and when tariffs go up. We also find that tariff increases lead to more unemployment and higher inequality, further adding to the deadweight losses of tariffs. Tariffs have only small effects on the trade balance though, in part because they induce offsetting exchange rate appreciations. Finally, protectionism also leads to a decline in consumption; this, together with our findings, suggests that tariffs are bad for welfare.

All this seems eminently sensible and bolsters the arguments that mainstream economists make against tariffs; our results can be regarded as strong empirical evidence for the benefits of liberal trade. And given the current global context, we take special note of the negative consequences when advanced economies increase tariffs during cyclical upturns (pg. 25-26).

Does Populism Reduce Economic Inequality?

The above comes from a recent study of The New Populism project. This reduction in economic inequality may lead some populist supporters to feel vindicated. However, the study continues by pointing out that “the fiscal policies of populists are less progressive than non-populists. This is what we might have expected; they are not reducing inequality as a result of government taxation or welfare structures.” The mechanism remains unknown, “maybe minimum wage policies, maybe moves towards formalization of the labour force, or limits on income generation of the very wealthy (or even possibly in the case of Venezuela, the very wealthy leaving, thereby reducing overall levels of market inequality). But they do reduce overall levels of market inequality” (pg. 5).

However, this isn’t the only effect of populists:

  • Populist leaders increase indirect (regressive) taxation.
  • Populism has no real impact on corruption, despite corruption often bringing populists to power.
  • “[P]opulist chief executives are more likely to infringe on the freedom and fairness of the electoral process than their non-populist counterparts” (pg. 14).
  • “[B]oth right and left populist chief executives seem more likely to embark on a mission to cut back on civil liberties” (pg. 15).
  • “We confirm a strong, negative effect of populism on press freedom. Not every decline can be attributed to populists, but almost every strong or moderate populist registers some decline” (pg. 17).
  • “Finally, populism in government is often associated with the centralization of power under the chief executive” and the erosion of executive constraints (pg. 18-19).


So giving power over to populist authoritarians who undermine democratic institutions and civil liberties is one successful avenue to economic equality. The others, according to historian Walter Scheidel, are “mass-mobilization warfare, violent and transformative revolutions, state collapse, and catastrophic epidemics. Hundreds of millions perished in their wake, and by the time these crises had passed, the gap between rich and poor had shrunk.”

What Was the Cost of Trump’s Trade War in 2018?

A new working paper confirms what economists have been saying about tariffs all along:

Economists have long argued that there are real income losses from import protection. Using the evidence to date from the 2018 trade war, we find empirical support for these arguments. We estimate the cumulative deadweight welfare cost (reduction in real income) from the U.S. tariffs to be around $6.9 billion during the first 11 months of 2018, with an additional cost of $12.3 billion to domestic consumers and importers in the form of tariff revenue transferred to the government. The deadweight welfare costs alone reached $1.4 billion per month by November of 2018. The trade war also caused dramatic adjustments in international supply chains, as approximately $165 billion dollars of trade ($136 billion of imports and $29 billion of exports) is lost or redirected in order to avoid the tariffs. We find that the U.S. tariffs were almost completely passed through into U.S. domestic prices, so that the entire incidence of the tariffs fell on domestic consumers and importers up to now, with no impact so far on the prices received by foreign exporters. We also find that U.S. producers responded to reduced import competition by raising their prices.

Our estimates, while concerning, omit other potentially large costs such as policy uncertainty as emphasized by Handley and Limão (2017) and Pierce and Schott (2016). While these effects of greater trade policy uncertainty are beyond the scope of this study, they are likely to be considerable, and may be reflected in the substantial falls in U.S. and Chinese equity markets around the time of some of the most important trade policy announcements (pg. 22-23).

What Drives Racial and Ethnic Inequality Today?

A brand new study offers some interesting insights into the question. Kay Hymowitz summarizes,

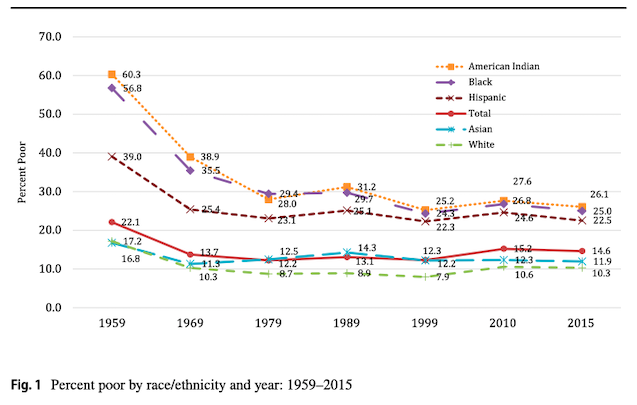
Using Census and ACS data, [John Iceland] shows that whites were the least likely of all groups to be poor throughout the decades studied (though, notably, their poverty rates inched up after 1980.) Although blacks and American Indians have become markedly less poor since 1959, they remain the groups with the highest— and fairly similar—odds of living in poverty. Hispanics never had poverty rates as high as those for American Indians and Blacks in the years studied, but their rates today, at 22.5%, are only marginally lower than those poorer groups (26.1 and 25%, respectively).

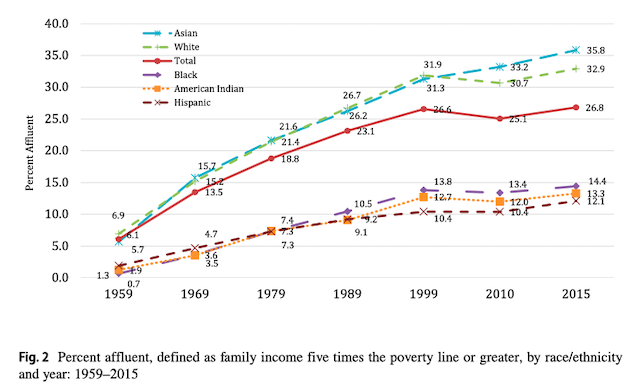
Iceland’s calculations also confirm that we are a much richer nation than we were in 1959. Affluence, defined as family income-to-poverty ratios five times the poverty threshold (or $120,180 as of 2015), has grown for all demographic categories, though at a faster pace for whites and Asians than others. (This “affluence” may strike New Yorkers and renters in other expensive cities as dubious, though the author checked his findings against alternative measures of poverty and affluence; they all showed the same basic trends.) 


Despite the massive declines in poverty, what are the main factors behind continuing inequality?

Taking the groups as a whole, he finds immigrant status to be the characteristic that best correlates with poverty, and education the trait most associated with affluence. However, the features most closely related to poverty and affluence differ among groups in fascinating ways. At a time of renewed concerns about racial inequality, the most striking story is for blacks. African Americans are more than three times as likely to be poor than whites without controls. With controls, the gap declines considerably—to 1.71.  Iceland estimates that female-headed households can now explain about one-third of the black-white poverty difference, age comes in second at 16%, and education at 15%; all-in-all, the three characteristics can explain two-thirds of the poverty gap between blacks and whites. 

Iceland’s findings on trends in minority poverty and affluence are consistent with a narrative of progress in racial relations. In 1959, family structure, education, and age explained less than half of the poverty and affluence gap between blacks and whites, for example; most of the divide was due to “unobservables” like discrimination, neighborhood, and social networks. Iceland confirms earlier research showing black and American Indian poverty plummeting in the 1960s; 57% of African-Americans and 60.3% of Indians started that decade poor. By the 1970s the number was 35.5% and 35.5%. Because the strong economy of the 1960’s lifted all ethnic and racial boats during the 1960s, black, Hispanic, Asian, American Indian, and white, however, the decade ended with inequality between the various groups more or less unchanged. In sum, between civil rights laws and economic growth, minority groups were able to make substantial economic progress in the 1960s, though not enough to catch up with whites.

But as discriminatory barriers fell, individual and family characteristics became more crucial for economic mobility. The author shows that “observables,” including family structure, age, and education, have considerably more explanatory power for poverty and affluence gaps today than they did in 1959, while unobservable factors, like discrimination, though still significant for blacks and American Indians, have nevertheless become less so.

What about other groups?

Education differences have the largest effect on the Hispanic and white poverty gap and that effect has grown over time; age and immigrant status play strong supporting roles. Education has been the prime mover for affluent Hispanics and American Indians; intact families, fewer children, and relocation to metropolitan areas also helped the latter group improve their outcomes.

Asians are the most educated of any group as well as the most stably married. These traits help explain the 35.8% of Asians who are affluent (vs. 32.9% of second-place whites) as well as why, though they have higher poverty rates than whites mostly due to immigration, they are still somewhat “protected” against poverty.

Some limitations and cautions:

It could be that family structure itself is partly a proxy for discrimination. If black men have trouble finding jobs because of prejudice, they are inevitably less “marriageable.” He notes as well that the data available has serious limitations. “Asian” was not a Census category until 1980; before that, people checked the Chinese, Japanese, Filipino, or Hawaiian box. It’s worth noting that Asian remains an awkward grouping, encompassing people of very different histories and cultures; in measuring affluence, Iceland shows, the Vietnamese don’t look at all like other Asians. “Hispanic” is similarly problematic. With controls, Cubans are as likely as whites to be affluent; that’s far from the case with other Hispanic subgroups.

Google, the Gender Pay Gap, and Markets

So you’ve probably seen this article making the rounds: Google Finds It’s Underpaying Many Men as It Addresses Wage Equity. It’s not hard to see why. The idea that a socially-aware megacorp tried to equalize women’s pay and ended up handing out raises is not only intrinsically funny, but offers a dose of schadenfreude for all the folks who still think James Damore was fundamentally right about the tech giants ideological echo chamber. Fair enough. But I want to talk about something different, and the real reason I’m deeply skeptical of the whole idea of a gender pay gap.

The first thing to realize is that the entire concept of a pay gap is actually philosophically tricky to define. From the NYT article:

When Google conducted a study recently to determine whether the company was underpaying women and members of minority groups, it found, to the surprise of just about everyone, that men were paid less money than women for doing similar work.

OK, but how does Google define “similar work”? Probably–I’m guessing, but a guess is good enough in this case–by looking at stuff like job title. Do you think everyone who works at your company with the same job title as you is working as hard / getting as much done as you do? No? Then this isn’t a very good basis for assessing “similar work” is it?

In fact, the problem is really bad because–even if a company paid men and women equally given that they had the same job title (in this case Google appears to have paid women more) they could still discriminate at an earlier stage in the process. Thus (another quote from the NYT article):

Critics said the results of the pay study could give a false impression. Company officials acknowledged that it did not address whether women were hired at a lower pay grade than men with similar qualifications.

In other words, maybe Google pays senior developers the same (or even pays female senior developers more), but at the same time it also stacks the deck against new hires so that female applicants are more likely to get hired as regular developers and then men are more likely to get hired as senior developers. In that case, it could be true that Google is biased towards paying women more within one job title, but also that it’s biased towards paying women less overall.

Not so simple, eh?

Now, I don’t actually know if Google used job title to define “similar work” and I made the bold claim that I didn’t really care if they did or not. The reason for that is that there is no good way to measure how much work a person does. If they used job title, then that’s a bad proxy. But if they used something else, then I am confident that they used another bad proxy. Because there’s absolutely no practical way that Google could have spent the time and resources required to actually assess all of their workers. There’s a name for this in economics, for the ides that it’s basically impossible to measure how much work an employee is doing. It’s called the principle-agent problem. And, believe it or not, that’s actually the easy part. Even if you could accurately, easily, and cheaply quantify how much work your employees do (you can’t), there’s still no accepted methodology for assessing how much value that work contributed to the company. If you’re the sales guy who closes a deal that earns your company $1,000,000 in revenue you might think the answer is simple: your effort just got the company a cool million. But you didn’t do that alone. You were selling a product that you didn’t make, for one thing. So the designers, the marketing guys, and the folks on the assembly line building the widgets all need a cut. How do you attribute the value you made–$1,000,000–among all the complex, networked, interconnected contributors? Good luck with that.

So far, all I’ve really said is that trying to detect a wage gap is going to be really, really hard because assessing “similar work” is basically impossible. But there’s good news! If you understand the way markets work, you will understand that you have very, very good reason to be skeptical that men and women are really being paid different amounts for similar work.

Now, before I explain this, let me just point out that there are a lot of people who will tell you that economic models of markets are over-simplified, flawed, and misleading. They’re right, but those criticisms don’t really apply. There’s this whole controversial literature over concepts like the efficient market hypothesis that, luckily, we don’t need to get into here and now. In a nutshell, economists like to pretend (for the sake of tractable theories) that humans are perfectly rational and statistical geniuses who take all possible information into account when making purchasing decisions. If that were true, then things like market bubbles would (probably) not be possible. (It depends on the specific of your model.) So let me just say: yeah, I concede all that. Precise, mathematical models of markets are basically all wrong. We can quibble about whether they are “perpetual motion machine”-wrong or just “spherical chicken”-wrong, but whatever.

Here’s the point: in a market (even a fairly messed-up, realistic one) you’ve got a lot of companies who are all competing. Although there’s a lot going on, one vital way that one of these companies can get a leg up over its competitors is if it finds a way to offer the same good or the same service for less cost. This isn’t rocket science, this is really, really obvious. If company A and company B are both selling more or less interchangeable widgets, but company A can make them for $1.00 / each and company B can make them for $0.90 / each, then company B has a huge advantage.

So here’s the thing: if there were any real indication that you could hire a woman, pay her 70% of what you pay a man, and get “similar work”, then what you’re saying is that there’s an easy, obvious way to go out there and make your widgets for $0.70 when everyone else has to pay $1.00 to make theirs.

We don’t need to take any derivatives here. We don’t need advanced theory. We don’t need to assume that human beings are perfectly rational, hyper-calculating machines. We just have to assume that companies generally want to find ways to reduce the cost of the goods and/or services they sell. If that humble, uncontroversial assumption is true, then any perceptible evidence of a real gender pay gap would immediately be identified and exploited by the market.

If anyone could find a real gender pay gap, it would be the mother of all arbitrage opportunities. And look, folks, if there’s one thing that every red-blooded capitalist wants to find, it’s an arbitrage opportunity. This isn’t hypothetical, by the way. You look at an industry like currency trading, and companies invest huge amounts of money hiring geniuses, buying them super-computers, and paying for access to network cables that give them millisecond advantages so that they can find and identify arbitrage opportunities before the market erases them.

Because that’s what markets do. They look for chances to make free money and then they exploit them until they disappear. If you find out that you can trade your dollars for yen, your yen for rubels, your rubels for pesos, and then your pesos back to dollars and end up with more than you started with: that’s arbitrage. And you will immediately pump as much money as you can into running through that cycle. As a result, the prices will go up and the arbitrage opportunity will close. This is what markets do.

And so if there is a way out there to hire women to do men’s work for 70% (or whatever) of their pay, companies would do that instantly. And the result? Well, the first company would offer women $0.70 on the dollar, but then a competitor would offer them $0.71, and then another competitor would offer them $0.72… and pretty soon no more arbitrage.

So what’s my point?

Trying to find out if there actually is an real wage-gap is very, very hard because measuring “similar work” is difficult. But, if there is ever a whiff of a reliable, objective, solid gender pay gap it will disappear as quickly as it is spotted as the market rushes to exploit the arbitrage opportunity.

Here’s what it all comes down to: if you believe in the gender pay gap, you believe that a bunch of cold-blooded, selfish capitalists are staring at a pile of money left on the table, and not one of them is trying to get their hands on it. This isn’t a completely open-and-shut case, but it’s a very, very strongly suggestive argument that capitalism and wage inequality–of any kind: gender-based, race-based, sexual orientation-based, etc–are fundamentally incompatible in the long run. It doesn’t mean that we shouldn’t have laws against discrimination, because individual business owners might make stupid, bigoted decisions and we might decide not to wait around to let the market fix them. But it does mean that the idea of a real, persistent, ongoing gender pay-gap is like UFOs or Bigfoot or–even rarer than anything else–a free lunch.

It’s just probably not there.
Management Still Matters

I’ve said it before: management matters. I even published a paper on it. Harvard’s Raffaella Sadun lays out the case once more:

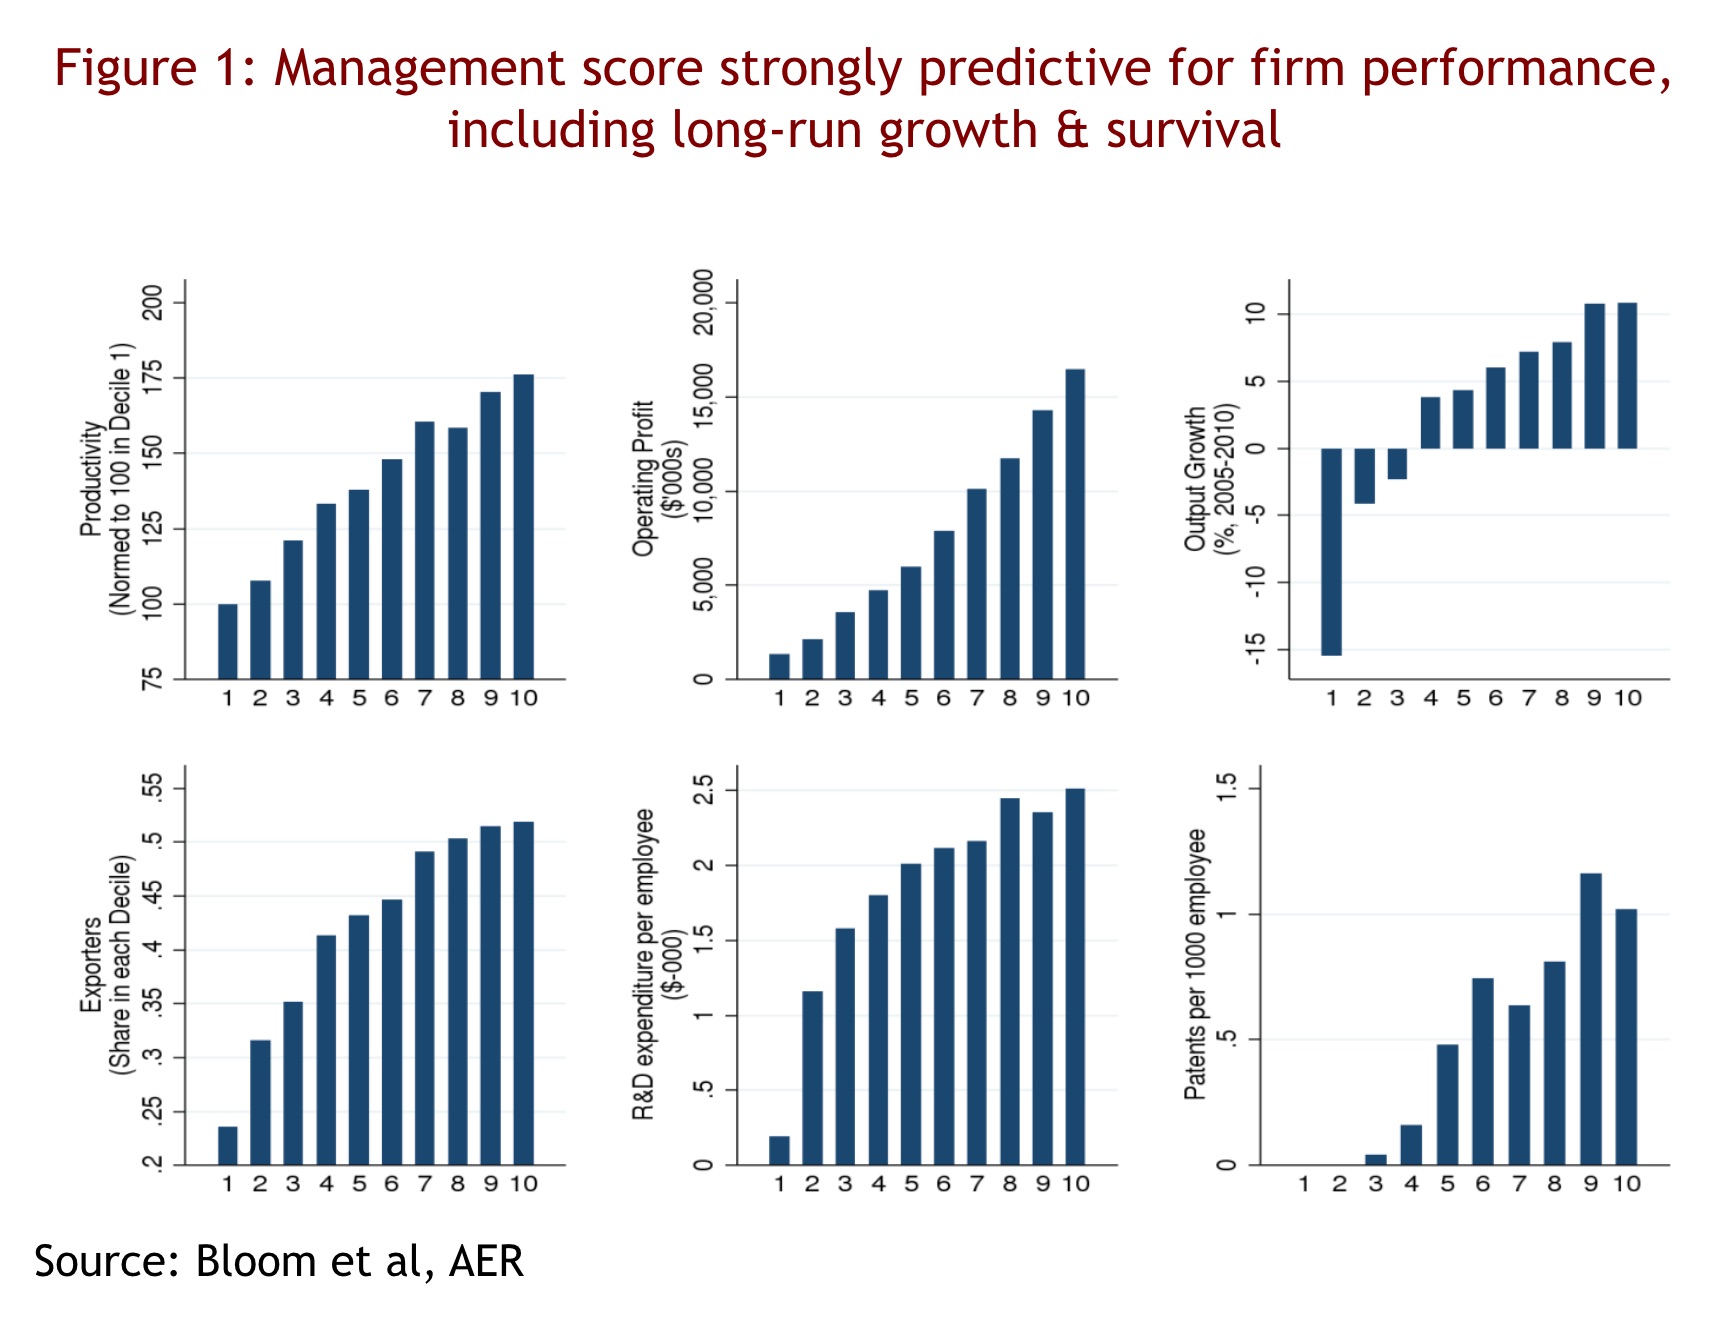
What we found was quite consistent across sectors and countries, namely a large and significant correlation between management and organizational performance. Figure 1 (Source), for example, shows the relationship between management and a variety of metrics for firm performance—including productivity, profitability, growth, and survival—among US manufacturing plants.

The correlation between management and performance appears to be similar across countries and (to our surprise) even in “public” sectors such as health care and education. For example, well-run hospitals appear to have lower mortality rates from Acute Myocardial Infarction (AMI, i.e heart attacks), and well-run schools enjoy better test scores among their pupils.

In subsequent research, my colleague Nick Bloom and colleagues set up a management “experiment,” in which a random set of Indian manufacturing firms were provided with a “dose” of management consultancy and compared to a control group. Their experiment showed that the relationship between management and firm performance appears to be causal.

Other researches have argued that the role of management may extend well beyond the performance of individual firms, and extend to whole economies. For example, Pellegrino and Zingales argue that people management gaps among Italian firms may be responsible for the weak productivity performance experience by the country since the early 90s by delaying the adoption of complementary and productivity enhancing technologies. In a recent paper, Schivardi and Schmitz extend this argument to Southern Europe more generally.

She identifies four major mechanisms for why management practices are so diverse across different countries:

1. There seem to be large informational barriers. Those prevent managers from having a clear understanding of the quality of their own practices, as well as the potential benefit that modern management practices could accrue to their organization. For example, when we asked managers to self-evaluate the quality of their own practices on a scale between 1 and 10, most managers rated themselves an 8. Their own scores were typically uncorrelated with our arguably more objective management score. 

2. Management adoption is strongly related to the education of the workforce, which, in turn, is shaped by differences in skill supply. This is not surprising, given the fact that many “best-practices” require significant numeracy and literacy skills.

3. Even when well-informed and with plenty skills available, managers may not be motivated to invest in new management practices, as the adjustment may be costly to the firm or to them personally (for example, relying on management practices may require less of their direct and personalized control, references). Research has shown the presence of a correlation between competitive pressure and management quality, which is in line with the classic idea in economics that competition reduces organizational slack.

4. Introducing new management practices in a firm requires a substantial buy-in from the employees, as its adoption rests on significant co-investments (i.e. learning new behavioral routines) that are hard to monitor and incentivize through standard contracting solutions. However, organizational frictions may prevent such co-investments from happening. For example, Susan Helper and Rebecca Henderson attribute GM’s decline and inability to fully implement productivity-enhancing managerial practices such as lean management to a fundamental lack of trust between managers and employees (employees suspected that the productivity improvements generated by lean would result in layoffs rather than generalized gains). This latter category points to the importance of softer aspects of organizations, such as corporate culture and leadership behavior, which may be able to overcome this type of resistance to change.

She concludes,

While much remains to be done, the evidence so far suggest that variations in this key factor of production may have large implications for performance, at both the firm and country level. Understanding why management quality varies across organizations will help us advance the field and develop better policies for improving management and productivity.

Economists’ Statement on How to Fight Climate Change

Related image

This is an impressive statement. It features 3333 economists, 4 former chairs of the Federal Reserve, 27 Nobel laureates, 15 former chairs of the Council of Economic Advisers, and 2 former Secretaries of the U.S. Treasury Department.

Their recommendations:

I.  A carbon tax offers the most cost-effective lever to reduce carbon emissions at the scale and speed that is necessary. By correcting a well-known market failure, a carbon tax will send a powerful price signal that harnesses the invisible hand of the marketplace to steer economic actors towards a low-carbon future.

II.  A carbon tax should increase every year until emissions reductions goals are met and be revenue neutral to avoid debates over the size of government. A consistently rising carbon price will encourage technological innovation and large-scale infrastructure development. It will also accelerate the diffusion of carbon-efficient goods and services.

III.  A sufficiently robust and gradually rising carbon tax will replace the need for various carbon regulations that are less efficient. Substituting a price signal for cumbersome regulations will promote economic growth and provide the regulatory certainty companies need for long- term investment in clean-energy alternatives.

IV.  To prevent carbon leakage and to protect U.S. competitiveness, a border carbon adjustment system should be established. This system would enhance the competitiveness of American firms that are more energy-efficient than their global competitors. It would also create an incentive for other nations to adopt similar carbon pricing.

V.   To maximize the fairness and political viability of a rising carbon tax, all the revenue should be returned directly to U.S. citizens through equal lump-sum rebates. The majority of American families, including the most vulnerable, will benefit financially by receiving more in “carbon dividends” than they pay in increased energy prices.

Stuff I Say at School Series

Image result for hermione granger gif raising hand

In January 2019, I started my MA program in Government at John Hopkins University. With homework taking up a more significant amount of my time, my blog-related research is certainly going to suffer. Instead of admitting defeat, I’ve decided to share excerpts from various assignments in this series. I was inspired by the Twitter feed “Sh*t My Dad Says.” While “Sh*t I Say at School” is a funnier title, I’ll go the less vulgar route and name it “Stuff I Say at School.” Some of this material will be familiar to DR readers, but presenting it in a new context will hopefully keep it fresh.

Below you’ll find links to all posts in the series.