Migration and Terrorism

Image result for terrorist

A new study examines the link between immigrants and terrorism:

In our recent work (Dreher et al. 2017) we provide a detailed analysis of how the number of foreigners living in a country has affected the number of terrorist attacks made by foreigners on citizens of their host countries. According to the raw data, in OECD countries between 1980 and 2010, for every million foreigners in the population, 0.8 terror attacks are committed per year, per country (there were 662 transnational attacks). While it is obvious that the number of attacks increases with the number of people living in a country (after all, with no foreigners in a country, no foreigners would commit any attacks), on average these numbers amount to about one attack by foreigners per year and host country, and 1.3 people die from these attacks in the average country and year.

Transnational terror is dwarfed in absolute numbers by the number of attacks made by the domestic population. In the 20 OECD countries that our sample covers, there were 2,740 attacks arising from the domestic population. In relative terms though, the picture is different – there were fewer than 0.18 terrorist attacks for every one million locally born citizens in a typical country and year. Overall, while the probability that foreigners are involved in an attack on the domestic population was much higher than the risk that citizens were involved in attacks on their own country, the risk associated with each additional foreigner was tiny.

In our statistical analysis, we investigate whether, and to what extent, an increase in the foreign population of the average OECD country would increase the risk of terrorist attacks from foreigners in a host country. We identify exogenous variation in the number of foreigners living in an OECD country using changes in migration resulting from natural disasters. These changes affected host countries differently, according to the specifics of each host- and origin-country pair.

Using data for 20 OECD host countries, and 187 countries of origin between 1980 and 2010, we find that the number of terror attacks increased with the number of foreigners living in a host country. This scale effect that relates larger numbers of foreigners to more attacks does not imply, however, that foreigners are more likely to become terrorists than the domestic population. When we calculate the effect of a larger local population on the frequency of terror attacks by locals, the effect is of a comparable size. We conclude that, in this period, migrants were not more likely to become terrorists than the locals of the country in which they were living.

To put these results in perspective, consider the expected effect of a decrease in the domestic population of 0.0002% (which is the average decrease in the domestic population of the 20 OECD countries we studied in 2015, according to the OECD). According to our model, this would have reduced the number of terrorist attacks by 0.00025 per country and year. The increase in the stock of foreigners living in these countries was 3.6% in the same year. According to our estimates, this would have created 0.04 additional attacks. We might argue that this hardly justifies a ban on foreigners as a group.

We find little evidence that terror had been systematically imported from countries with large Muslim populations. The exceptions were Algeria and Iran, where we found a statistically higher risk of being involved in terrorist attacks against the local population, compared to the average effect of foreigners from non-Muslim countries. In this light, the phrases ‘Muslim terror’ or ‘Islamist terror’ does not seem accurate or useful. Only 6% of the terrorist attacks in the US between 1980 and 2005 period were carried out by Muslims, and less than 2% of all attacks in Europe had a religious motivation between 2009 and 2013 (Alnatour 2017).

I’ve written before about how European labor laws may play a role in radicalization. The authors make a similar case for immigration bans:

Contrary to the expectations of many politicians and pundits, introducing strict laws that regulate the integration and rights of migrants does not seem to have been effective in preventing terror attacks from foreign-born residents. We rather find that repressing migrants already living in the country with these laws has alienated a substantial share of this population, which increases the risk of terror. Stricter laws on immigration thus have the potential to increase the risk of terror, at least immediately following the ban.

…Our results illustrate an important trade-off. While stricter immigration laws could reduce the inflow of (violent) foreigners and thus potentially the number of future terrorist attacks, the restrictions would also increase the probability that those foreigners already living in the country become more violent. Immigration bans, like those recently introduced in the US, would arguably increase the short-term risk of attacks, before potentially reducing risk when the number of foreigners in the population has decreased.
“Better never means better for everyone”

The Handmaid’s tale as a TV show is apparently a big deal. I don’t know about that. I really liked the book when I read it a few years ago, but I dreaded it being made for TV and haven’t checked the show out. Anyway, because the show is a big deal, I see lots of references to it on Facebook. Here’s one that stood out:

Better never means better for everyone. It always means worse for some.

The line is from the book, and it made it into the show, too. Of course it did.

The sentiment is very, very far from unique. In fact, it’s pretty close to universal among the left-wing of American politics. It’s actually pretty common on the right, too, since it’s more about populism than it is about left/right ideology. It crops up all the time. Just as one more example, here’s another left-leaning author in another overtly ideological (but not nearly as aesthetically accomplished) book[ref]It’s A Closed and Common Orbit by Becky Chambers. Here’s my review.[/ref]:

“Everybody’s history is one long slog of all the horrible shit we’ve done to each other.”
“It’s not all that,” Tak said. “A lot of it, yes, but there’s good things, too. There’s art, and cities, and science. All the things we’ve discovered. All the things we’ve learned and made better.”
“All the things made better for some people. Nobody has ever figured out how to make things better for everybody.
“I know,” Tak said.

So, that’s one theory of human existence: in all of our history (and for hundreds of years into our imagined future) progress for everyone is impossible.

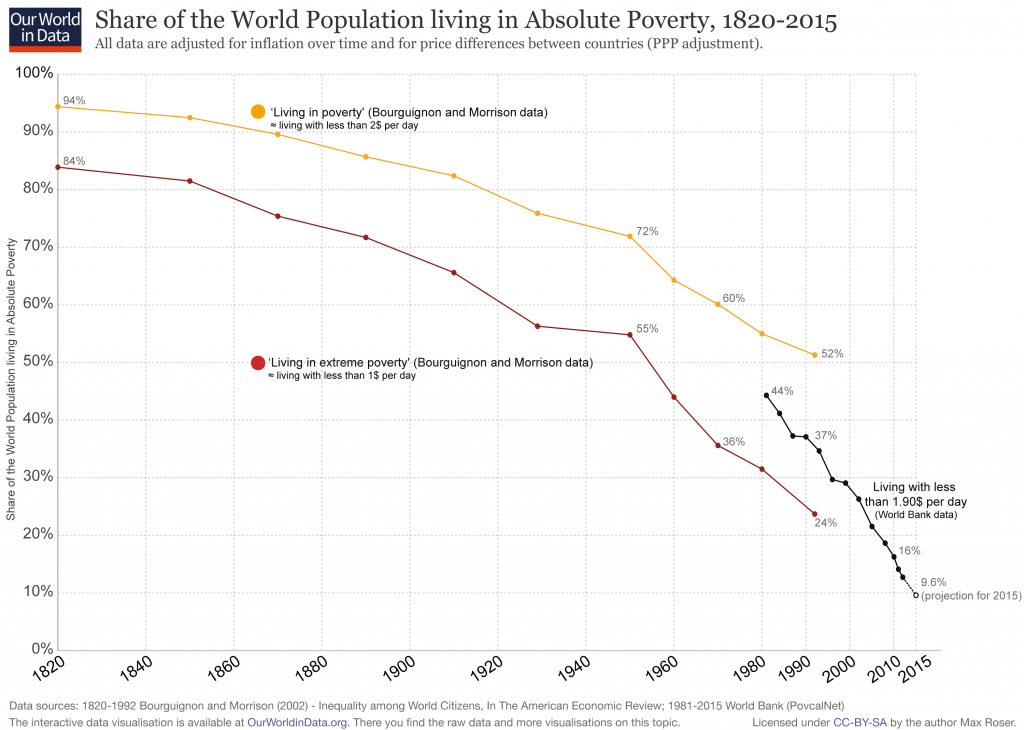
On the other hand, here’s the reality[ref]This is Walker’s favorite graph, btw.[/ref]:

The chart comes from Our World in Data’s article on extreme poverty.

I understand the idea of living in a fantasy world if the fantasy is better than reality. I can even understand extending this wishful thinking to fantasies that don’t actually seem very nice. That’s what conspiracy theories are all about, after all. Some people would rather believe in a world where things happen for a reason (and that reason is the Illuminati) rather than believe in a world where things are pretty random and chaotic because the Illuminati running everything is less scary than nobody running anything. OK. Not my cup of tea, but OK.

What I don’t understand is choosing to live in fantasy world that is so much grimmer than reality for no discernible benefit.

Which makes you wonder: what motivates this belief–contradicted by all available evidence–that universal improvement is impossible?


Politicization and the Fall of Academia

The ivory towers of King’s College London’s Maughan Library (Public Domain)

I’ve often met academics who seem mystified and horrified at the extent and depth of conservative animus towards academia. This excellent article does a great job of explaining (1) where this dislike comes from and (2) why it should concern everyone, and not just conservatives.

First:

Entire disciplines—Literature, Anthropology, Sociology, and the various interdisciplinary programs that end in the word “Studies” – have all become more strongly associated with a particular species of left-wing interpretation that now influences the broader discourse in journalism and on social media. In some departments, the social categories of analysis—race, class, and gender—have attained complete hegemony. The most recent convention of the Modern Language Association, the most prominent organization associated with the study of language and literature, hosted three times as many panels on post-colonialism as it did on Shakespeare.

Second:

Conservatives will point to statistics such as the imbalance in the ratio between registered Democrats and Republicans as evidence of a political imbalance. Students it is argued are only getting one side of the story. While this sentiment is certainly understandable, it ignores an element of the current phenomena that might be even more deleterious to student learning and thus all the more intractable. The problem isn’t simply one of political imbalance, an absence of parity between Left and Right voices, but the extent to which humanities departments have become politicized.

I’m a conservative (more or less), and so I have an interest in conservatives being able to get their message out. But–independent of that partisan concern which I cannot pretend I do not feel–I have a sincere, non-partisan interest in the quality of public discourse. The politicization of everything is corroding that discourse. When everything is evaluated first in political terms, the conversation often fails to ever get beyond those preliminaries. Battle lines are drawn over rhetoric, terminology, tone, and framing. What’s left is a zombie-discourse, the husk of a conversation serving as a thin veneer for power games.

It’s bad for everyone.

It’s especially bad for academia. If folks like those at Heterodox Academy don’t manage to hold onto a middle-ground position, I’m not sure what the future of the academy in the United States looks like, but it will likely be quite grim. Elite institutions are already much more about the perpetuation of  elitism than education. When the academic content of academia effectively disappears, there will be nothing left except the quasi-covert apparatus of aristocracy.

Corruption: Another Driver of Migration

Migrants sit in the back of a truck at a local immigration transit centre in the desert town of Agadez, Niger May 25, 2015. African migrants in overcrowded pickup trucks, encouraged by social media messages from friends who survived the perilous journey across the Mediterranean, set off from Agadez, an ancient trading town on the edge of the Sahara, to cross Niger in the uncertain journey towards Europe via Libya, where the collapse of the government has offered an open door for smugglers. Mostly young men, escaping grinding poverty in neighbouring Benin or Burkina Faso, face bandits and often have to pay bribes en route, on top of the hefty payments to people smugglers. International focus on the issue of migration into Europe has sharpened after hundreds of migrants drowned while trying to cross the sea from North Africa in overcrowded and unsafe vessels. REUTERS/Akintunde Akinleye TPX IMAGES OF THE DAY PICTURE 34 OF 36 FOR WIDER IMAGE STORY ‘SMUGGLED THROUGH NIGER’SEARCH ‘SAHARA AKINLEYE’ FOR ALL IMAGES TPX IMAGES OF THE DAY - RTX1EXBV

“One issue frequently raised by migrants whom I have met in transit (most recently in Agadez, Niger) is the absence of a level playing field in their home country,” reports Richard Danziger at the World Economic Forum. “Without knowing the right people, being from the right community or having the money to buy their way into a job, they will never get ahead. This, in turn, is part of the broader problem of poor governance, which has resulted in everything from a sharp drop in the quality of education and other services; to investment in sectors that lead to impressive GDP growth indicators, but result in little by way of job creation. While an increasing number of countries across Africa are holding free and fair elections, democratically elected governments have yet to prove themselves truly responsive to the needs of vast swathes of the population. In countries where there is already a tradition of migration, for many, voting with one’s feet can appear more effective than a trip to the ballot box.”

Danziger continues,

There has been relatively little research on the issue of poor governance as a driver of migration. A recently published study by GIZ specifically examining the link between corruption and migration and forced displacement is a rare example of research into this sensitive subject…The concept of poor governance is very broad and can cover a multitude of areas of mismanagement or criminal activity horizontally across sectors and vertically across levels of management. Indonesians for example talk of KKN: the Bahasa acronym for Corruption, Collusion and Nepotism. It might perhaps be more useful to explain what is meant by good governance and here we can refer to Sustainable Development Goal (SDG) 16: “Promote peaceful and inclusive societies for sustainable development, provide access to justice for all and build effective, accountable and inclusive institutions at all levels.” More specifically 16.5, 16.6 and 16.7; address corruption, transparency and accountability, and inclusiveness and participation.

As for the link to migration, the New York Declaration for Refugees and Migrants refers to the promotion of the rule of law and the need to address marginalization and exclusion. It also refers to the SDGs and the promotion of peaceful and inclusive societies, carefully sidestepping any mention of KKN or related abuses. Yet if we are to create a truly new and effective global migration framework there is a need for the Global Compact on Migration to include explicit reference to these issues.

I have an article currently under review at BYU Studies Quarterly on the subject of the Church and immigration. The more I read about the subject, the more I’m convinced I’m right.

What Motivates Support for Redistribution?

When it comes to the motivations behind redistribution, it turns out that fairness has little to do with it. Instead, researchers find[ref]Full access here.[/ref] that compassion, envy, and self-interest are the main drivers. From the abstract:

Why do people support economic redistribution? Hypotheses include inequity aversion, a moral sense that inequality is intrinsically unfair, and cultural explanations such as exposure to and assimilation of culturally transmitted ideologies. However, humans have been interacting with worse-off and better-off individuals over evolutionary time, and our motivational systems may have been naturally selected to navigate the opportunities and challenges posed by such recurrent interactions. We hypothesize that modern redistribution is perceived as an ancestral scene involving three notional players: the needy other, the better-off other, and the actor herself. We explore how three motivational systems—compassion, self-interest, and envy—guide responses to the needy other and the better-off other, and how they pattern responses to redistribution. Data from the United States, the United Kingdom, India, and Israel support this model. Endorsement of redistribution is independently predicted by dispositional compassion, dispositional envy, and the expectation of personal gain from redistribution. By contrast, a taste for fairness, in the sense of (i) universality in the application of laws and standards, or (ii) low variance in group-level payoffs, fails to predict attitudes about redistribution.

Let’s dive into the details:

We conducted 13 studies with 6,024 participants in four countries to test the hypothesis that compassion, envy, and self-interest jointly predict support for redistribution. Participants completed instruments measuring their (i) support for redistribution; (ii) dispositional compassion; (iii) dispositional envy; (iv) expected personal gain or loss from redistribution (our measure of self-interest); (v) political party identification; (vi) aid given personally to the poor; (vii) wealthy-harming preferences; (viii) endorsement of procedural fairness; (ix) endorsement of distributional fairness; (x) age; (xi) gender; and (xii) socioeconomic status (SES) (pg. 8422).

The results?:

Image result for greed fullmetal alchemistTo test this prediction, we regressed participants’ support for redistribution simultaneously on their dispositional compassion, their dispositional envy, and their expected personal gain (or loss) from redistribution. As predicted, the three motives have positive, significant, and independent effects on support for redistribution. This is true in the four countries tested: the United States (US) (study 1a), India (IN) (study 1b), the United Kingdom (GB) (study 1c), and Israel (IL) (study 1d)—standardized regression coefficients (β values): compassion, 0.28–0.39; envy, 0.10–0.14; self-interest, 0.18–0.30. Jointly, these motives account for 13–28% of the variance in support for redistribution. Adding to the regression models age and gender, or age, gender, and S[ocio]E[conomic]S[tatus], does not appreciably alter the effect of the emotion/motivation triplet, or the total variance accounted for. We note that age did not have significant effects in any country. Gender had significant effects in the United States and the United Kingdom (females more opposed to redistribution), but not in India or Israel. SES had a significant (negative) effect in the United Kingdom, but not in the other countries (Ibid.).

Unsurprisingly, in the U.S. “self-described Democrats endorsed redistribution to a greater extent than Republicans and Libertarians did. Democrats also reported more compassion and more expected personal gain from redistribution than Republicans and Libertarians did; envy did not differ by party” (Ibid.). Interestingly enough, “dispositional compassion was the only reliable predictor of giving aid to the poor” in all four countries. However, “support for government redistribution was not a unique predictor of personally aiding the poor in the regressions…Support for government redistribution is not aiding the needy writ large—in the United States, data from the General Social Survey indicate that support for redistribution is associated with lower charitable contributions to religious and nonreligious causes” (Ibid.).

Image result for compassion fullmetal alchemist
Compassion

Now consider these absurd answers from the survey respondents:

Related imageParticipants in the United States, India, and the United Kingdom (studies 1a–c) were given two hypothetical scenarios and asked to indicate their preferred one. In one scenario, the wealthy pay an additional 10% in taxes, and the poor receive an additional sum of money. In the other scenario, the wealthy pay an additional 50% in taxes (i.e., a tax increment five times greater than in the first scenario), and the poor receive (only) one-half the additional amount that they receive in the first scenario. That is, higher taxes paid by the wealthy yielded relatively less money for the poor, and vice versa (63). To clarify the rationale for this trade-off, we told participants that the wealthy earned more when tax rates were low, thereby generating more tax revenue that could be used to help the poor. Fourteen percent to 18% of the American, Indian, and British participants indicated a preference for the scenario featuring a higher tax rate for the wealthy even though it produced less money to help the poor…We regressed this wealthy-harming preference simultaneously on support for redistribution, the emotion/motivation triplet, age, gender, and SES. Dispositional envy was the only reliable predictor (Ibid.).

In short, “Compassion and envy motivate the attainment of different ends. Compassion, but not envy, predicts personally helping the poor. Envy, but not compassion, predicts a desire to tax the wealthy even when that costs the poor” (Ibid.). The cries for fairness, though, have little to do with support for redistribution:

To sum up the set of fairness studies, in predicting support for redistribution, the effect of fairness as a group-wide concern is unreliable and of far smaller magnitude than the effect of the emotion/motivation triplet. This is true whether fairness is operationalized as uniformity in the application of laws and standards or as low (or null) variance in payoffs; whether distributional fairness is assayed between individuals (studies 2a, 2c, S1a, S2a, S2b) or between groups (“the rich,” “the poor”; studies 2b, S1b, S2c, S2d); and whether allocational decisions are hypothetical (studies 2a, 2b, S1a, S1b, S2c, S2d) or consequential (studies 2c, S2a, S2b) (pg. 8423).

So, why do people support redistribution?

  1. They care about the poor and want to help them (Compassion).
  2. They hate the rich (Envy).
  3. They expect to gain from redistribution (Greed).

Sounds about right.

The Effects of Immigrants: Miami Edition

Economist Michael Clemens has an excellent article in Vox discussing some of his most recent research on immigration and in turn responds to Harvard’s George Borjas, the most prominent anti-immigration economist around:

Do immigrants from poor countries hurt native workers? It’s a perpetual question for policymakers and politicians. That the answer is a resounding “Yes!” was a central assertion of Donald Trump’s presidential campaign. When a study by an economist at Harvard University recently found that a famous influx of Cuban immigrants into Miami dramatically reduced the wages of native workers, immigration critics argued that the debate was settled.

…But there’s a problem. The study is controversial, and its finding — that the Cuban refugees caused a large, statistically unmistakable fall in Miami wages — may be simply spurious. This matters because what happened in Miami is the one historical event that has most shaped how economists view immigration.

In his article, Borjas claimed to debunk an earlier study by another eminent economist, David Card, of UC Berkeley, analyzing the arrival of the Cubans in Miami. The episode offers a textbook case of how different economists can reach sharply conflicting conclusions from exactly the same data.

Yet this is not an “on the one hand, on the other” story: My own analysis suggests that Borjas has not proved his case. Spend a few minutes digging into the data with me, and it will become apparent that the data simply does not allow us to conclude that those Cubans caused a fall in Miami wages, even for low-skill workers.

An influential 1990 study found “no difference in wage or employment trends between Miami — which had just been flooded with new low-skill workers — and other cities” following the arrival of 125,000 Cuban immigrants.

Two new studies reexamined the 1990 study. “Borjas, instead, focuses on workers who did not finish high school — and claimed that the Boatlift caused the wages of those workers, those truly at the bottom of the ladder, to collapse. The other new study (ungated here), by economists Giovanni Peri and Vasil Yasenov, of the UC Davis and UC Berkeley, reconfirms Card’s original result: It cannot detect an effect of the boatlift on Miami wages, even among workers who did not finish high school.” Clemens suggests looking at

certain subgroups that may have competed more directly with the newly-arrived Cubans. For example, the Mariel migrants were mostly men. They were Hispanic. Many of them were prime-age workers (age 25 to 59). So we should look separately at what happened to wages for each of those groups of low-skill workers who might compete with the immigrants more directly: men only, non-Cuban Hispanics only, prime-age workers only…Here again, if anything, wages rose for each of these groups of low-skill workers after 1980, relative to their previous trend. There isn’t any dip in wages to explain. And, again, the same is true if you compare wage trends in Miami to trends in other, similar cities. Peri and Yasenov showed that there is still no dip in wages even when you divide up low-skill workers by whether or not they finished high school. About half of the Mariel migrants had finished high school, and the other half hadn’t. So you might expect negative wage effects on both groups of workers in Miami. Here is what the wage trends look like for those two groups.

The wages of Miami workers with high school degrees (and no more than that) jump up right after the Mariel boatlift, relative to prior trends. The wages of those with less than a high school education appear to dip slightly, for a couple of years, although this is barely distinguishable amid the statistical noise. And these same inflation-adjusted wages were also falling in many other cities that didn’t receive a wave of immigrants, so it’s not possible to say with statistical confidence whether that brief dip on the right is real. It might have been — but economists can’t be sure. The rise on the left, in contrast, is certainly statistically significant, even relative to corresponding wage trends in other cities.

So how did Borjas come to different conclusions? He “starts with the full sample of workers of high school or less — then removes women, and Hispanics, and workers who aren’t prime age (that is, he tosses out those who are 19 to 24, and 60 to 65). And then he removes workers who have a high school degree. In all, that means throwing out the data for 91 percent of low-skill workers in Miami in the years where Borjas finds the largest wage effect. It leaves a tiny sample, just 17 workers per year.” Borjas’ conclusions involve a lot of statistical noise and, as Clemens notes, “if we’re willing to take low-skill workers in Miami and hand-pick small subsets of them, we can always find small groups of workers whose wages rose during a particular period, and other groups whose wages fell. But at some point we’re learning more about statistical artifacts than about real-world events.”

But there is another factor at work:

it turns out that the CPS sample includes vastly more black workers in the data used for the Borjas study after the boatlift than before it.

Because black men earned less than others, this change would necessarily have the effect of exaggerating the wage decline measured by Borjas. The change in the black fraction of the sample is too big and long-lasting to be explained by random error. (This is my own contribution to the debate. I explore this problem in a new research paper that I co-authored with Jennifer Hunt, a professor of economics at Rutgers University.)

Around 1980, the same time as the Boatlift, two things happened that would bring a lot more low-wage black men into the survey samples. First, there was a simultaneous arrival of large numbers of very low-income immigrants from Haiti without high school degrees: that is, non-Hispanic black men who earn much less than US black workers but cannot be distinguished from US black workers in the survey data. Nearly all hadn’t finished high school.

That meant not just that Miami suddenly had far more black men with less than high school after 1980, but also that those black men had much lower earnings. Second, the Census Bureau, which ran the CPS surveys, improved its survey methods around 1980 to cover more low-skill black men due to political pressure after research revealed that many low-income black men simply weren’t being counted.

You can see what happened in the graph below, which has a point for each year’s group of non-Hispanic men with less than high school, in the data used by Borjas (ages 25 to 59). The horizontal axis is the fraction of the men in the sample who are black. The vertical axis is the average wage in the sample. Because black men in Miami at this skill level earned much less than non-blacks, it’s no surprise that the more black men are covered by each year’s sample, the lower the average wage.

But here’s the critical problem: The fraction of black workers in this sample increased dramatically between the years just before the boatlift (in red) and the years just after the boatlift (in blue). That demographic shift would make the average wage in this group appear to fall right after the boatlift, even if no one’s wages actually changed in any subpopulation. What changed was who was included in the sample.

“When the statistical results in the Borjas study are adjusted to allow for changing black composition of the sample in each city,” Clemens continues, “the result becomes fragile. In the dataset Borjas focuses on, the result suddenly depends on which set of cities one chooses to compare Miami to. And in the other, larger CPS dataset that covers the same period, there is no longer a statistically significant dip in wages at all.” And once “you’ve discarded women, and Hispanics, and workers under 25, and workers over 59, and anyone who finished high school— and blacks, you’ve thrown away 98 percent of the data on low-skill workers in Miami. There are only four people left in each year’s survey, on average, during the years that the Borjas study finds the largest effect. With samples that small, the statistical confidence interval (represented by the dotted lines) is huge, meaning we can’t infer anything general from the results. We can’t distinguish large declines in wages from large rises in wages — at least until several years after the boatlift happened, and those can’t be plausibly attributed to the boatlift.”

In conclusion, “[t]here is no clear evidence that wages fell (or that unemployment rose) among the least-skilled workers in Miami, even after a sudden refugee wave sharply raised the size of that workforce. This does not by any means imply that large waves of low-skill immigration could not displace any native workers, especially in the short term, in other times and places. But politicians’ pronouncements that immigrants necessarily do harm native workers must grapple with the evidence from real-world experiences to the contrary.”


Predatory Fines

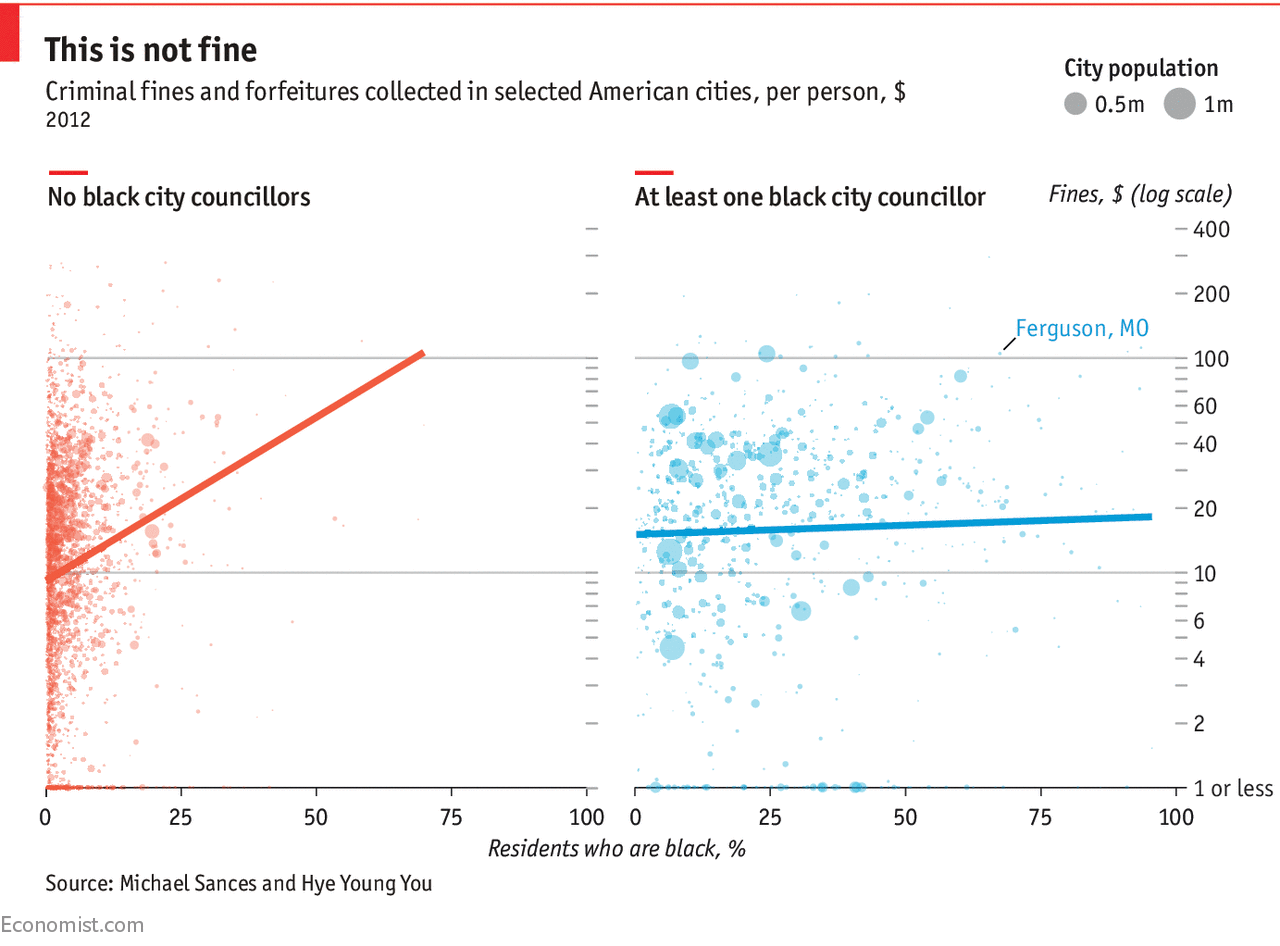
Toward the end of last year, I did a rundown of the data on racial bias and policing. A new study is worth adding to the list. According to its findings,

Ferguson was unlikely to be a unique outlier, and other cities engaging in similar practices might well have continued outside of the national spotlight. A new paper by Michael Sances of the University of Memphis and Hye Young You of Vanderbilt University published this month in the Journal of Politics found that Ferguson was indeed more of a rule than an exception. After examining data on 9,000 American cities, they found that those with more black residents consistently collected unusually high amounts of fines and fees—even after controlling for differences in income, education and crime levels. Cities with the largest shares (98%) of black residents collected an average of $12-$19 more per person than those with the smallest (0%) did.

However, there was one subgroup of cities that bucked the trend: the relationship between race and fines was only half as strong in places whose city councils included at least one black member. This may be because black politicians are likelier than white ones are to respond to complaints from black constituents. Black councillors might also intervene to stop certain policies, like increasing court fees, from going into effect to begin with.

What fines are we talking about exactly?

For example, in Peoria, Arizona, two people were jailed for not trimming weeds more than six inches tall. In Ferguson, a black man resting in his car after playing basketball in the public park was stopped by police and charged with, among other things, not wearing a seat belt in his (parked) car and making a false declaration after giving the officer a shortened name (like “Bob” instead of “Robert”). Such fines may fall disproportionately on the backs of black citizens, because they tend to be poorer and lack the resources to contest the penalties.

Despite the exhaustive controls the authors included in their study, the strong correlation they found does not demonstrate decisively that race is the ultimate cause of higher fines. However, it does put a very high burden of proof on researchers arguing that some other factor is responsible. Now that the pattern has been identified across the country, city governments that rely heavily on fines would be well-advised to consider more transparent sources of revenue, and ones that do not place an additional burden on a subset of residents who are already disadvantaged.

Check it out.

Persuasion in the Economy

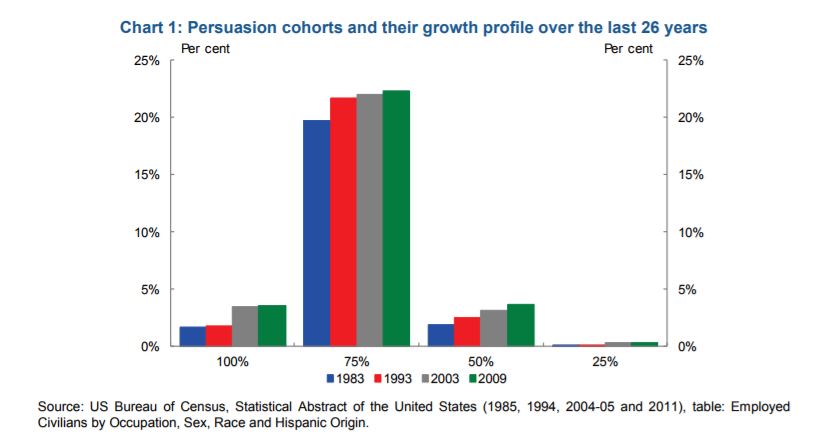
Over 20 years ago, economists Deirdre (then Donald) McCloskey and Arjo Klamer argued that a quarter of GDP is due to “persuasion”: the sweet talk that is inherent in economic activity and transactions. A 2013 report by the Australian Treasury updates their findings and concludes that 30% of U.S. GDP is persuasion:

Chart 1 displays the steady rise of persuasion content in US employment. To focus on the biggest grouping — those having a persuasion content of three-quarters — in 1983, they accounted for 19.7 per cent of total employment and grew by two percentage points to 21.8 per cent by 1993. And again, from 22.1 per cent in 2003 the proportion of these workers increased to 22.3 per cent in 2009. Overall persuasion employment appears to have settled at around the 30 per cent mark.

How much of national output is attributable to persuasion? McCloskey and Klamer derive an estimate through the production measure of GDP: the ‘more obviously “talkie” parts of production are a large part of production for final consumption, and much of it is persuasion rather than information or command’. And since these ‘talkie’ parts, such as wholesale and retail trade, finance and general government, add up to 58 per cent of US GDP in 1991, they conjecture that ‘it would not be hard to see … a figure of about a quarter (of GDP) devoted to persuasion’ (p. 193).

An alternative guess could be made from the income side of the national accounts — GDP(I). Since the persuasion content of employment is 30 per cent and the proportion of national income accruing to labour is around 60 per cent in the US (Jacobson and Occhino (2012)), that gives the labour income component of persuasion in the national accounts of around 18 per cent. If a fifth to one-quarter of capital income represents persuasive activity, that accounts for another 8-10 per cent (that is 20-25 per cent x (1-0.6)) of persuasion in GDP(I).7 The digital economy’s rapid advance has meant that brand names, commercial trademarks and other intellectual property are playing a bigger role in economic transactions and by their nature may not be well reflected in the national accounts. Therefore it is quite possible that the persuasion content of GDP may now be closer to 30 per cent.

While it is likely that persuasion GDP has risen above one quarter, it also bears entertaining the possibility that some of that effort could be dissipated by economic contests and positioning à la Skaperdas and Vaidya (2009).

The report concludes,

Since the inspired guesstimate of McCloskey and Klamer, the economics profession launched itself into modelling many aspects of persuasion. Insights are to be had for sure, particularly in how regulators might mandate minimum product or service disclosure standards or how persuasion is deployed in economic contests. There might even be lessons as to how to communicate difficult economic reform proposals and how to navigate tricky political economy landscapes.

But as McCloskey (2011) suggests, some research effort may be falling back into the trap of treating persuasion as just another factor in formal optimisation exercises. In that sense, McCloskey and Klamer’s (1995) original hope remains unrealised. They had hoped that a renewed awareness of the importance of persuasion might encourage the modern economist to augment her technical tools of trade by taking seriously the potential of language in economic discourse and by utilising the power of interpretation in distinguishing between competing ‘hard results’. In this way, McCloskey’s agenda goes beyond evidence-based policy evaluations, useful and necessary as they are in policy discourse.

On a positive note, might it be time to update the McCloskey-Klamer catch phrase to ’30 per cent of GDP is persuasion’? Such renewed speculation would of course merely inform because the persuading was eloquently done by McCloskey and Klamer.

Humane Liberalism

Related imageAs mentioned before, the newest issue of Dialogue was just released. The first article of the new issue is Robert Rees’ “Reimagining the Restoration: Why Liberalism is the Ultimate Flowering of Mormonism.” Rees attempts to redeem the word from its current negative connotations in American society, reviewing its meaning in the Middle Ages to the Enlightenment. He further connects to Joseph Smith’s statement that God “is more liberal in His views, and boundless in His mercies and blessings, than we are ready to believe or receive” (pg. 4). Rees goes on to emphasize liberal commitments to earth stewardship, gender equality, the poor, peace, education, etc.

The article reminded me of a recent essay by economic historian Deirdre McCloskey titled “Manifesto for a New American Liberalism, or How to Be a Humane Libertarian.” As McCloskey notes, “Outside the United States libertarianism is still called plain “liberalism,” as in the usage of the president of France, Emmanuel Macron, with no “neo-” about it” (pg. 1). “Liberals 1.0 don’t like violence,” she continues. “They are friends of the voluntary market order, as against the policy-heavy feudal order or bureaucratic order or military-industrial order. They are, as Hayek declared, “the party of life, the party that favors free growth and spontaneous evolution,” against the various parties of left and right which wish “to impose [by violence] upon the world a preconceived rational pattern.” In McCloskey’s view, “humane liberals are very far from being against poor people. Nor are they ungenerous, or lacking in pity. Nor are they strictly pacifist, willing to surrender in the face of an invasion. But they believe that in achieving such goods as charity and security the polity should not turn carelessly to violence, at home or abroad, whether for leftish or rightish purposes, whether to help the poor or to police the world. We should depend chiefly on voluntary agreements, such as exchange-tested betterment, or treaties, or civil conversation, or the gift of grace, or a majority voting constrained by civil rights for the minority” (pg. 2). She explains,

Such a humane liberalism has for two centuries worked on the whole astonishingly well. For one thing it produced increasingly free people, which (we moderns think) is a great good in itself. Slaves, women, colonial people, gays, handicapped, and above all the poor, from which almost all of us come, have been increasingly allowed since 1776 to pursue their own projects consistent with not using physical violence to interfere with other people’s projects. As someone put it: In the eighteenth century kings had rights and women had none. Now it’s the other way around. And—quite surprisingly—the new liberalism, by inspiriting for the first time in history a great mass of ordinary people, produced a massive explosion of betterments. 

…The Enrichment was, I say again in case you missed it, three thousand percent per person, near enough, utterly unprecedented. The goods and services available to even the poorest rose by that astounding figure, in a world in which mere doublings, increases of merely 100 percent, had been rare and temporary, as in the glory of fifth-century Greece or the vigor of the Song Dynasty. In every earlier case, the little industrial revolutions had reverted eventually to a real income per head in today’s prices of about $3 a day, which was the human condition since the caves. Consider trying to live on $3 a day, as many people worldwide still do (though during the past forty years their number has fallen like a stone). After 1800 there was no reversion. On the contrary, in every one of the forty or so recessions since 1800 the real income per head after a recession exceeded what it had been at the previous peak. Up, up, up. Even including the $3- a-day people in Chad and Zimbabwe, world real income per head has increased during the past two centuries by a factor of ten, and by a factor of thirty as I said, in the countries that were lucky, and liberally wise. Hong Kong. South Korea. Botswana. The material and cultural enrichment bids fair to spread now to the world.

And the enrichment has been equalizing. Nowadays in places like Japan and the United States the poorest make more, corrected for inflation, than did the top quarter or so two centuries ago (pgs. 4-5).

The whole thing is worth reading. Check it out.

World Bank: Immigrants & Productivity

A new World Bank policy brief reviews the effects of immigrants on productivity:

For a sense of net effects –positive or negative, we looked at 22 primary studies. Explicit analysis on skilled versus unskilled immigrants is rare. So, most of the econometric results pertain to the effects of total immigrants. They remain instructive, given the overwhelming direction of migrant flows from less educated to more educated countries.

…In our RPB, broken down to the three components of labor productivity, positive effects from total immigrants are especially apparent through TFP. There is no statistically significant impact on physical capital per worker suggesting that capital accumulation need not be adversely affected. Human capital per worker is somewhat negatively affected, indicating that immigrants’ compositional effect on skills tends to outweigh the effect on natives’ skills upgrading. In the studies that analyze labor productivity alongside all its three components, positive immigrant effects on TFP more than offset the effects on physical capital and human capital per worker.

Outcomes vary across countries. Positive productivity effects from total immigrants are obvious for the U.S. – analysis using state-level data links task specialization of less-educated natives, induced by unskilled immigrant inflows, to TFP growth. Studies suggest that the complementarity and scale channels operate in Malaysia, but also that automation is somewhat hindered. Actual empirical evidence of net productivity effects seems mixed, and not representative enough of the economy as a whole, tending to focus on the manufacturing sector. In contrast, there is also the unique example of a large influx of skilled immigrants into Israel (fleeing the collapse of the Soviet Union) not having positive effects on productivity in the manufacturing sector.

More than anything, the cross-country evidence highlights that underlying the likelihood of positive net productivity effects is how immigrants link to specific gaps in the economy – regardless of skill level. And the response of agents, markets and institutions in host countries.

In fact, the report found that “on balance, total immigrant effects on labor productivity are statistically insignificant to positive” with “statistically significant positive effects” for total factor productivity (pg. 2). In short, “The economic case for an outright ban on unskilled immigrant workers is weak.”

And now I’ll leave you with the Hamilton Mixtape.