What Kind of Inequality?

According to a new working paper, “While population-weighted income inequality increased until the third quarter of the 20th-century, inequality in social dimensions has declined since WWI. Furthermore, the contrast between inequality in terms of income and human development (Figure 4) is striking and challenges the idea that per capita income provides a good predictor of welfare trends.”

Nobel economist Angus Deaton wrote, “Inequality is often a consequence of progress” (pg. 1). And yet, income fails to capture a complete picture of absolute living standards. This should make us consider what kind of inequality we are concerned about.

Is Partisanship Driven By Misperceptions About Party Makeup?

Image result for hooligan
Hooligans = the rabid sports fans of politics

Georgetown philosopher Jason Brennan describes political “hooligans” in this way:

Hooligans are the rabid sports fan of politics. They have strong and largely fixed worldviews. They can present arguments for their beliefs, but they cannot explain alternative points of view in a way that people with other views would find satisfactory. Hooligans consume political information, although in a biased way. They tend to seek out information that confirms their preexisting political opinions, but ignore, evade, and reject out of hand evidence that contradicts or disconfirms their preexisting opinions. They may have some trust in the social sciences, but cherry-pick data and tend only to learn about research that supports their own views. They are overconfident in themselves and what they know. Their political opinions form part of their identity, and they are proud to be a member of their political team…Most regular voters, active political participants, activists, registered party members, and politicians are hooligans.[ref]Against Democracy, pg. 5.[/ref]

What’s more, voters are overwhelminglyat times astonishinglyignorant. Here’s another study demonstrating this sad state of affairs (from an earlier draft):

Across five studies, we find that people overestimate the degree to which partisans belong to party-stereotypical groups, often vastly so. Even in cases where these groups comprise just a sliver of the population, people report that these groups constitute upwards of 40% of the party they “fit.” And when people are given information about these groups’ shares in the population, the bias in their estimates doesn’t decline, suggesting that people rely on representativeness when making judgments about party composition.

Republicans, Democrats, and Independents, all overestimate the share of party-stereotypical groups in both the major parties. Partisan differences, although statistically significant, are relatively small compared to the overall magnitude of these misperceptions. Even more strikingly, those most interested in politics hold the most skewed perceptions of party composition. One plausible explanation for both of these results is that mediated, impersonal information drives these misperceptions. However, all the evidence we have presented on this point is descriptive. Additional research is needed to assess the extent to which media shape these perceptions.

These misperceptions are also consequential. Experimental evidence suggests that beliefs about out-party composition affect perceptions of where opposing-party supporters stand on the issues. These findings provide a potential explanation for why people tend to overestimate the extremity of opposing partisans. In future extensions, we plan to further investigate whether beliefs about party composition explain the striking finding that people also overestimate the extremity of co-partisans (Ahler 2014; Levendusky and Malhotra 2015). Misperceptions about out-party composition also lead partisans to feel more socially distant from the opposing party. Building on work by Hetherington and Weiler (2009) and Mason and Davis (2015), who find that partisan animus is related to party composition, we experimentally show that people’s beliefs about party composition affect their feelings towards the opposing party.

…The experimental findings support the notion that orientations toward constituent social groups affect how people feel toward the parties, among other things. However, they also show that beliefs about shares of various groups in the parties matter. Thus, while the group identity account makes a compelling case that partisanship is a relatively stable, affective attachment, work in this tradition must grapple more thoroughly with the social cognitions (and cognitive biases) that are relevant to how people reason about politics.

This is especially the case because partisans overestimate the share of party-stereotypical groups in their own party. For instance, many lower- and middle-class Republicans think that their party contains far more rich people than it actually does. This suggests that many partisans like their own parties to the extent they do—a great deal, with average ratings exceeding 80 on the thermometer scale (Iyengar, Sood and Lelkes 2012)—despite believing that the party has a greater share of groups to which they tend not to belong than it actually does. Green, Palmquist and Schickler (2002, p. 8) suggest that partisans choose parties based on “which assemblage of groups” looks like them. While this may still be true, the data suggest that people identify with parties based on which groups they like.

Finally, and most broadly, this research furthers our understanding of people’s perceptions of mass collectives and how these perceptions shape individuals’ own political attitudes. Mutz (1998) describes impersonal influence as the effect of people’s perceptions of what others are experiencing, or what others believe, on their own attitudes and behaviors. We take this one step further and assert that people’s perceptions merely of who belongs to a collective can be a source of impersonal influence—and in this case, a catalyst for partisanship in American politics (pg. 27-28).

I’ll say it again: politics makes us mean and dumb.[ref]Vox agrees.[/ref]

Does Economic Marginalization Breed Radicals?

Image result for islamic radical

A few years ago, I linked to a Wall Street Journal op-ed by economist Hernando de Soto that declared “economic hope” to be “the only way to win the battle for the constituencies on which terrorist groups feed.” A couple years later, I discussed the possibility that strict labor laws–and the unemployment it produces–was a major contributor to radicalization in Europe. In short, the lack of economic opportunity breeds extremism.

Recent evidence appears to support this hunch.

Many point to U.S. drone strikes as a causal factor in Islamic radicalization. However, a brand new study argues the contrary, concluding,

Although U.S. drone strikes in Muslim countries might play a role in the radicalization or violent extremism of co-religionists around the world, the available evidence does not support the assertion that drones are “fueling the fires of homegrown radicalization” in Western societies or that these unmanned aerial vehicles are the new Guantánamo.

…The radicalization of individuals in the Somali diaspora, especially in the state of Minnesota, illustrates the role of U.S. policies targeting Muslim communities at home; personal factors, such as conflicted identities among young Somali Americans; and their nationalist desire to evict foreign troops from Somalia, a desire that recruiters from the al-Qaida affiliate al-Shabaab have been able to exploit. My brief examination of the social science literature on the drivers of Islamist militancy among Muslims in European countries similarly points to domestic factors such as an identity crisis among some young Muslims, state policies of marginalization and discrimination, and the role of radical preachers and terrorist recruiters who leverage these vulnerabilities for recruitment (pg. 83-84; emphasis mine).

This is further confirmed by a recent World Bank paper:

Exploiting individual-level education information for these fighters, we link the size of a contingent of fighters to the economic conditions faced by workers in their countries of residence who have the same level of education, by distinguishing primary, secondary and tertiary education. Beginning non-parametrically, we document a correlation between the within-country relative unemployment rate faced by workers from a specific country and education level and the corresponding relative number of recruits. We then conduct panel regressions in which we estimate the impact of unemployment on the propensity to join the terrorist group, controlling for country and education-level fixed effects. The estimated coefficients indicate that higher unemployment rates are a push factor towards radicalization, especially for countries at a shorter distance to Syria, with an elasticity of 0.25; a one percentage point increase in the unemployment rate leads to 42 additional Daesh recruits. The elasticity steeply decreases further away from Syria and becomes both economically and statistically insignificant past the average distance of 2,500 km. The results are robust to the inclusion of education-specific wage rates, strengthening the case for a causal interpretation of these results (pg. 1-2).

I’m reminded of the famous quote by Nobel laureate Robert Lucas: “The consequences for human welfare involved in questions [of economic growth] are simply staggering: Once one starts to think about them, it is hard to think about anything else” (pg. 5).

Identity Politics and Happiness

Image result for yelling protester
I know they don’t look it, but they’re probably pretty happy people.

Now for something not the least bit surprising. From a recent working paper:

Results show that political affiliations of national politicians, especially the president, have an effect on reported happiness while there is no effect of state, gubernatorial or legislative, party control. Individuals report being happier when the president is a member of their own party, has conservative ideology, and an ideology that matches their individual tastes. Throughout all specifications, republicans and those holding conservative political values report higher happiness. Shockingly, regardless of liberal or conservative political values, those who hold extreme political values report higher levels of happiness. The large effect of partisanship and extreme views support the view that partisanship is a result of social identity and provides a psychological need for certainty and structure.

Economist Arthur Brooks, the soon-to-be-former president of the American Enterprise Institute, made this point years ago in his book Gross National Happiness:

Americans who describe themselves as holding extreme political views–somewhere between 10 and 20 percent of the population–are among the happiest people in America. All of those angry protesters who denounce Dick Cheney as a murderer; all of the professional political pundits who use the rhetoric of rage and misery to get on cable television–it turns out they’re not miserable at all. On the contrary, they’re enjoying themselves rather a lot. 

In 2004, 35 percent of people who said they were extremely liberal were very happy (versus 22 percent of people who were just liberal). At the same time, a whopping 48 percent of people who were extremely conservative gave this response (compared with 43 percent of nonextreme conservatives). Indeed, the gusto with which Bill Clinton’s attackers in 1998 went after him was really a clue that they were having a grand old time. George W. Bush’s harshest critics–those who have felt the predations of the Bush administration to the very depths of their soul–are quite likely to be a great deal happier than more moderate liberals. 

Why are ideologues so happy? The most plausible reason is religion–not real religion, but rather, a secular substitute in which they believe with perfect certainty in the correctness of their political dogmas. People want to hold the truth; questioning is uncomfortable. It is easy to live by the creed that our nation’s ills are because of George W. Bush; it is much harder to acknowledge that no administration is perfect–or perfectly awful. True political believers are martyrs after a fashion willing to shout slogans in public for causes they are sure are good, or against causes they are convinced are evil. They are happy because–unlike you, probably–they are positive they are right. No data could change their minds (pgs. 33-34).

In other words, being a political hooligan feels really good, which makes change very unlikely. Unfortunately, as Brooks points out,

the happiness of political extremists is an unhappy fact for America. They may themselves be happy, but they make others unhappy–that is, they actually lower our gross national happiness. In many cases, extremists actually intend to upset people–it is part of their strategy…Extremists are happy to stir up their own ranks, but they are even happier when they cause misery for their political opponents. For people on the far left and right, people who do not share their views are not just mistaken, but bad people, who are also stupid and selfish. They deserve to be unhappy…Extremists thrive on dehumanizing their opponents (pgs. 34-35).

Politics makes us mean and dumb.

Are Americans Becoming Less Religious?

Pew Research Center has a new study out on American’s religious beliefs. Their previous research on the rise of the “nones” (i.e., the unchurched or religiously unaffiliated) received a lot of press with many claiming that religious belief was on the decline. Sociologist Rodney Stark has been calling out the misleading nature of these numbers, pointing out that a lack of religious affiliation does not say much about the person’s beliefs. His criticisms are based on his detailed, large-scale survey of Americans’ beliefs and practices as well as his analysis of cross-country data. And now, Pew’s recent research seems to indicate that Stark had a point:

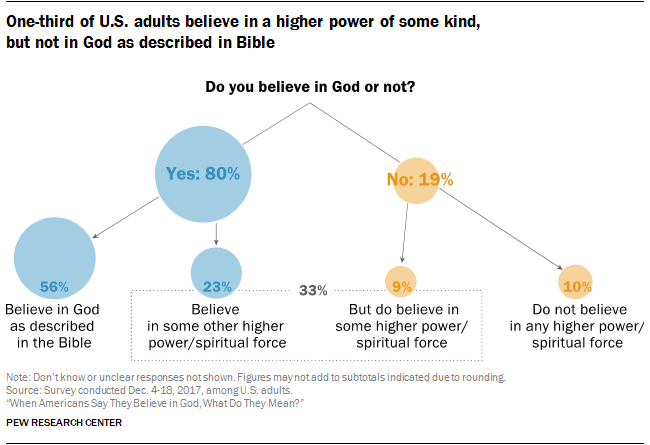
A new Pew Research Center survey of more than 4,700 U.S. adults finds that one-third of Americans say they do not believe in the God of the Bible, but that they do believe there is some other higher power or spiritual force in the universe. A slim majority of Americans (56%) say they believe in God “as described in the Bible.” And one-in-ten do not believe in any higher power or spiritual force.

…The survey questions that mention the Bible do not specify any particular verses or translations, leaving that up to each respondent’s understanding. But it is clear from questions elsewhere in the survey that Americans who say they believe in God “as described in the Bible” generally envision an all-powerful, all-knowing, loving deity who determines most or all of what happens in their lives. By contrast, people who say they believe in a “higher power or spiritual force” – but not in God as described in the Bible – are much less likely to believe in a deity who is omnipotent, omniscient, benevolent and active in human affairs.
And what of the so-called “nones”?:

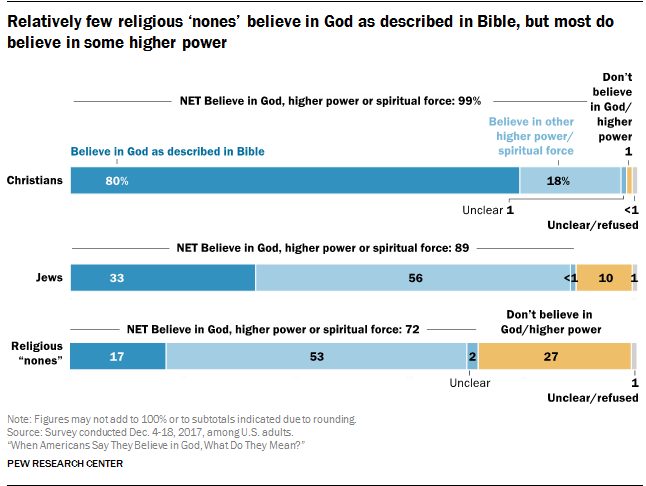
Compared with Christians, Jews and people with no religious affiliation are much more likely to say they do not believe in God or a higher power of any kind. Still, big majorities in both groups do believe in a deity (89% among Jews, 72% among religious “nones”), including 56% of Jews and 53% of the religiously unaffiliated who say they do not believe in the God of the Bible but do believe in some other higher power of spiritual force in the universe. (The survey did not include enough interviews with Muslims, Buddhists, Hindus or respondents from other minority religious groups in the United States to permit separate analysis of their beliefs.)
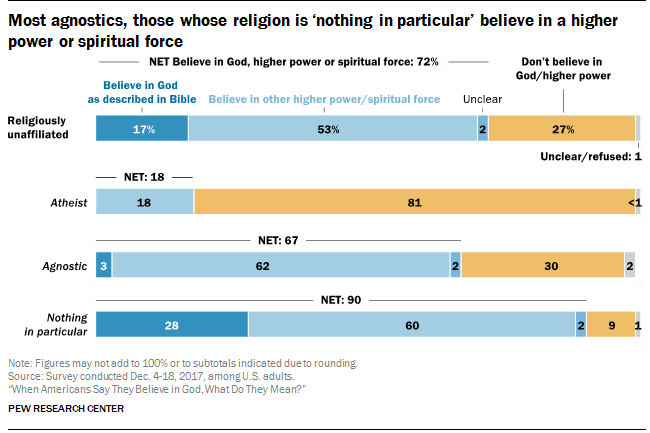
As Stark writes,

The world is more religious than it has ever been. Around the globe, four out of every five people claim to belong to an organized faith, and many of the rest say they attend worship services. In Latin American, Pentecostal Protestant churches have converted tens of millions, and Catholics are going to Mass in unprecedented numbers. There are more churchgoing Christians in Sub-Saharan African than anywhere else on earth, and China may soon become home of the most Christians. Meanwhile, although not growing as rapidly as Christianity, Islam enjoys far higher levels of member commitment than it has for many centuries, and the same is true for Hinduism. In fact, of all the great world religions, only Buddhism may not be growing…[D]espite [the] confident proclamations about the decline of religion, Pew’s findings were certainly misleading and probably wrong. Consider only one fact: the overwhelming majority of Americans who say they have no religious affiliation pray and believe in angels! How irreligious is that?[ref]The Triumph of Faith, pg. 1-2.[/ref]

Furthermore,

The [Pew] findings would seem to be clear: the number of Americans who say their religious affiliation is “none” has increased from about 8 percent in 1990 to about 22 percent in 2014. But what this means is not so obvious, for, during this same period, church attendance did not decline and the number of atheists did not increase. Indeed, the percentage of atheists in America has stayed stead at about 4 percent since a question about belief in God was first asked in 1944. In addition, except for atheists, most of the other “nones” are religious in the sense that they pray (some pray very often) and believe in angels, in heaven, and even in ghosts. Some are also rather deeply involved in “New Age” mysticisms.

So who are these “nones,” and why is their number increasing–if it is? Back in 1990 most Americans who seldom or never attended church still claimed a religious affiliation when asked to do so. Today, when asked their religious preference, instead of saying Methodist or Catholic, now a larger proportion of nonattenders say “none,” by which most seem to mean “no actual membership.” The entire change has take place within the nonattending group, and the nonattending group has not grown.

In other words, this change marks a decrease only in nominal affiliation, not an increase in irreligion. So whatever else it may reflect, the change does not support claims for increased secularization, let alone a decrease in the number of Christians. It may not even reflect an increase in those who say they are “nones.” The reason has to do with response rates and the accuracy of surveys.[ref]Ibid., 190.[/ref]

Are We Underestimating the Gains from Trade?

It sure looks that way. According to a recent study,

Related imageAssessing the size and identifying the sources of gains from trade is a long-standing challenge for economists. Theoretical and quantitative studies have mostly focused on static economies where changes in international market integration have only one-off effects on the levels of income and consumption but do not affect the long-run dynamics of these key economic variables (Costinot and Rodriguez-Clare, 2014). Since innovation and technological change are key drivers of income growth in the long-run (Aghion and Howitt, 2009, Akcigit et al. 2017), in a recent paper (Impullitti and Licandro 2018) we explore the sources and assess the size of the gains from trade in an economy where growth spurs from technological progress. 

Building a quantitative model for policy analysis requires a theory sufficiently grounded on a (large enough) set of relevant empirical facts. We focus on the following facts, each corresponding to a particular channel of gains from trade. 

  • First, there is strong evidence documenting competition effects of trade (Feenstra and Weinstein 2017). Increasing foreign competition is often found to reduce firm prices thereby shrinking their profit margins. Lower prices benefit consumer by increasing their purchasing power, this is the so-called pro-competitive effect of trade. 
  • Second, the reduction in profits forces some of the less-profitable and less-productive firms out of the market, thereby reallocating market shares toward the most productive firms (Bernard et al. 2012). This selection effect generates an additional channel of gains from trade, as more productive firms charge lower prices. 
  • Finally, foreign competitive pressure and selection, along with access to foreign markets induce firms to increase their investment in innovation to improve productivity and stay ahead of competitors (Bloom et al. 2015, Aghion et al. 2017). This innovation effect leads to dynamic gains from trade, as higher productivity growth produces not just one-off price reductions but a sequence of reductions across time, thereby increasingly benefiting present and future consumers.

We construct a model embedding all three key channels through which trade can potentially increase average income and consumption and calibrate it to replicate key aggregate and firm level trade and innovation statistics of the US economy. Frontier quantitative trade models embed only the first two channels in static economies where the effects of a policy change take place through timeless reallocations of market shares across firms and sectors but each firm’s productivity is kept constant. The selection and competition effects of trade reallocates resources toward the most productive firms, thereby increasing the average level of productivity and reducing prices. In our dynamic economy, trade-induced reallocations increase the size of the most productive firms and raise their incentives to innovate, thereby pushing up the growth rate of productivity. Hence, the model is able to separately measure the static gains form competition and selection and the dynamic gains produced by the interaction of these forces with innovation-driven productivity growth.

The authors’ findings

suggest that policy evaluation with static trade models is likely to largely underestimate the gains from globalisation. We have shown that innovation can be a key driver of dynamic gains from trade. Other recent papers have suggested that dynamic gains from trade can also come via technology diffusion (Sampson, 2016, Perla and Tonetti, 2016), and also stressed the importance of quantifying both the short and long-run effects of trade by exploring the full transitional dynamics generated by trade shocks (Akcigit, et al. 2018). This new class of macro-trade models have laid the basis for future quantitative frameworks to measure the effects of globalisation on per-capita income and consumption. 

“The Ugly Coded Critique of Chick-Fil-A’s Christianity”

Stephen Carter at Bloomberg suggests the secular Left doesn’t realize who it’s mocking. Key points:

  • Women are more likely than men to be Christian.
  • PoC are more likely than white people to be Christian, and particularly more likely to be Christian traditionalists.
  • White Christians are aging while Christians of color are youthening.
  • Among Latinos and Asians, Christians are overwhelmingly first generation immigrants.

Read the full article here.

Do Mexicans Take or Create Employment in Texas?

From Dallas Morning News:

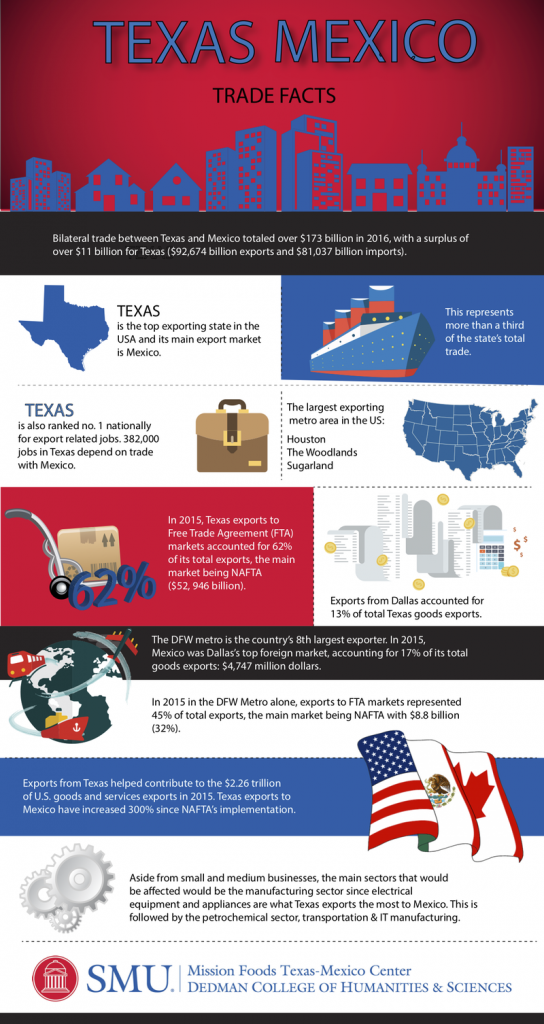
Far from taking jobs away from Texans, Mexicans are helping create additional employment opportunities, providing valuable labor for a growing economy and helping the deepening integration with Mexico, according to the Texas-Mexico Center at Southern Methodist University.

…The study  relied on data from the U.S. Census Bureau and its Mexican counterpart, known as INEGI. The study, with contributions by the Bush School of Government at Texas A&M University, the Federal Reserve Board of Dallas and Colegio de Mexico in Mexico City, stressed the importance of labor from Mexico, which is in decline in many parts of the United States.

Underscoring the trends is the 1994 North American Free Trade Agreement, or NAFTA. The trade accord led to a dramatic economic transformation that fueled a shift in goods, products and movement of people, factors that over the years have impacted cities and regions. For instance, supply chains and cultural integration deepened in cities such as Dallas as Mexico-based companies moved into North Texas along with their products — from tortillas to pasta to  Topo Chico —  and, of course, more workers.

Some of the study’s findings include:

  • Trade with Mexico does not hinder interstate trading in the U.S. States are still more likely to trade among themselves than across the border with Mexico, which shows the border trade relationship supports both national and international trade.
  • Because of the integration across value chains, there is clear evidence that Mexican and U.S. workers are complements for each other rather than substitutes.
  • Revisions of NAFTA need to maintain cross-border integration.
  • Freer migration reduced Mexico´s wage inequality.

The preliminary findings can be found here.

Total and Intangible Wealth: World Bank Report 2018

I’ve mentioned the World Bank’s measurement of intangible assets before. Its recent report–The Changing Wealth of Nations 2018: Building a Sustainable Future–updates this measurement:

Image result for human capitalTotal wealth in the new approach is calculated by summing up estimates of each component of wealth: produced capital, natural capital, human capital, and net foreign assets. This represents a significant departure from past estimates, in which total wealth was estimated by (1) assuming that consumption is the return on total wealth and then (2) calculating back to total wealth from current sustainable consumption…In previous estimates, produced capital, natural capital, and net foreign assets were calculated directly, then subtracted from total wealth to obtain a residual.

The unexplained residual, called “intangible capital,” was largely attributed to human capital…as well as to missing or mismeasured assets and possible effects of social capital. But the unexplained residual accounted for 50–85 percent of the total wealth indicator, making it a weak indicator for policy. This approach was taken because of the lack of data for directly measuring human capital. We now have a method and data for estimating human capital directly and will measure total wealth as the sum of each asset category. The advantage of the earlier approach was that the residual included human capital, unmeasured assets, and the influence of institutions and governance on wealth. The disadvantage was that the various components of the residual could not be disentangled and it was calculated assuming the same return on assets in all countries.

Human capital in the past was not measured explicitly but included as part of the “residual,” accounting for 50–85 percent of total wealth in past estimates. We apply the well-known Jorgenson Fraumeni lifetime earnings approach to measuring human capital globally. We use a unique database developed by the World Bank, the International Income Distribution Database, which contains more than
1,500 household surveys (pgs. 38-39).

This report

shows for the first time that much of intangible wealth is actually human capital, estimated as the net present value of the population’s future labor earnings. Human capital turns out to be the most important component of wealth, even though its share in total wealth decreased from 69 percent in 1995 to 64 percent in 2014 (table 2.2). After 2000, this decline in the share of human capital wealth was entirely due to upper-middle and high-income OECD countries, which together account for more than 80 percent of global wealth as well as most human capital wealth. The factors that led to this decline include the aging of the labor force (which reduces the remaining years of earnings) in many high-income OECD countries, as well as in China, which dominates the upper-middle-income country group, and declining wage shares in GDP, particularly in many high-income OECD countries (ILO 2015). By contrast, in low- and lower-middle-income countries, which account for the majority of the world’s population, the share of human capital in total wealth is rising (pgs. 46-47).

The new report calculates total wealth as follows:

Total wealth = Natural capital + Produced capital + Human capital + Net foreign assets

“This represents a significant departure from past estimates,” the report explains,

in which total wealth was estimated by assuming that consumption is the return on total wealth, and then calculating back to total wealth from current sustainable consumption (“top-down approach”). In previous estimates, produced capital, natural capital, and net foreign assets were calculated directly, then subtracted from total wealth to obtain a residual. The unexplained residual, called “intangible capital,” was largely attributed to human capital as well as to missing or mismeasured assets. Now with a direct measurement of human capital,[ref]See Ch. 6 for an explanation of the methodology for measuring human capital.[/ref] total wealth can be estimated as the sum of all categories of assets (pg. 212).

In turns out that the U.S. has $983,280 total wealth per capita with human capital making up $766,470 (see pg. 232). Other findings include:

  • The report found that global wealth grew 66 percent (from $690 trillion to $1,143 trillion in constant 2014 U.S. dollars at market prices).
  • The top 20 countries with the fastest growing wealth per capita were dominated by developing countries—including two of the biggest—China and India, which were both classified by the World Bank as low income countries in 1995 and are now ranked as middle-income.
  • Countries with large gains in per capita wealth also included smaller countries like Chile, Peru, Vietnam, as well as countries rapidly recovering from civil disturbances like Bosnia-Herzegovina, Ethiopia, Rwanda, and Sri Lanka as well as some of the resource rich countries in the former USSR, like Azerbaijan.
  • Per capita wealth declined or was stagnant in more than two dozen countries in various income brackets. These include several large low-income countries, some carbon-rich countries in the Middle East, and high-income OECD countries affected by the 2009 financial crisis. Declining per capita wealth implies that assets critical for generating future income may be depleted, and the rents generated from natural assets depletion are not invested properly, a fact often not reflected in national GDP growth figures.
  • Human capital is the largest component of global wealth, accounting for two thirds of total wealth globally. This points to the need to invest in people for wealth creation and future income generation.
  • While natural capital accounts for 9 percent of wealth globally, it makes up nearly half (47 percent) of the wealth in low income countries. More efficient, long-term management of natural resources is key to sustainable development while these countries build their infrastructure and human capital.