The Health Benefits of Nuclear Power

Image result for chernobyl diaries

Science writer Ronald Bailey has a brief write-up on some of the research regarding nuclear power and health outcomes:

A 2015 recent analysis by Israeli researcher Yehoshua Socol in the journal Dose-Reponse reconsiders the health consequences of the the Chernobyl accident. Socol argues that using even the most conservative linear no-threshold hypothesis to calculate cancer risk cannot distinguish any increase above normal background rates of cancer incidence and mortality. Assume 50,000 cancer deaths would result from Chernobyl’s radiation. Socol notes, assuming current mortality rates, that over the next 50 years some 50 million people (plus or minus 2.5 million) will die of cancer in developed countries. Given the annual uncertainty of 50,000 deaths per year, it would be impossible to detect what number, if any, of those deaths can be attributed to exposures to Chernobyl.

Socol concludes that “unlike the widespread myths and misperceptions, there is little scientific evidence for carcinogenic, mutagenic or other detrimental health effects caused by the radiation in the Chernobyl-affected area, besides the acute effects and small number of thyroid cancers. On the other hand, it should be stressed that the above-mentioned myths and misperceptions about the threat of radiation caused, by themselves, enormous human suffering.”

A fascinating December 2015 study by European researchers in the Journal of Geophysical Research-Atmospheres asked what would the health consequences to Europe if the continent had closed all of its nuclear power plants and switched to coal-fired generation between 2005 and 2009? They calculated that there would have been an increase of around 100,000 premature deaths annually owing to increased air pollution (most of them due to cardiopulmonary illnesses). If these calculations are correct, the number of deaths attributable to coal would have been three times higher than even the worst-case Chernobyl cancer scenario being pushed by activists. If the WHO’s estimates are right, coal kills at more than 1,000 times the rate of Chernobyl radiation.

Chernobyl was bad enough, but exaggerating its effects to further an unscientific campaign against nuclear power is ethically sleazy and may have the unintended consequence of killing more people than the activists claim they want to save.

There’s Hollywood, then there’s reality.
High-Skilled Immigrants and Innovation in US History

How important have high-skilled immigrants been to innovation in US history? According to a recent study,

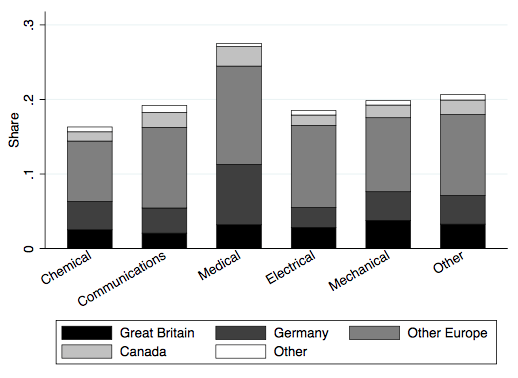
Medical inventions (e.g. surgical sutures) accounted for the largest share of immigrants, but this category produced just 1% of all US patents. However, immigrants were also active in chemicals and electricity – two sectors that had a particularly large effect on US economic growth, accounting for 13.9% and 12.6% of all US patents, respectively. Noticeably, immigrants accounted for at least 16% of patents in every area. This evidence suggests that their impact on inventive activity was widespread.   

[The graph below] also shows that the majority of immigrant inventors originated from European countries, with Germans playing a particularly prominent role. This is consistent with the findings of Moser et al. (2014) who show that German-Jewish émigrés who fled the Nazi regime boosted innovation in the US chemicals industry by around 30%. Today the closest analogue to these high-impact individuals would be inventors of Indian and Chinese ethnic origin who make substantial contributions to the development of innovation clusters in areas like Silicon Valley (Hunt and Gauthier-Loiselle 2010, Kerr and Lincoln 2010).

The researchers

constructed a measure of foreign-born expertise, which multiplies the share of each country’s patents granted in a given technology area between 1880 and 1940 (as a measure of proficiency) by the number of immigrants from that country in the 1940 Census (as a measure of how intensely that proficiency diffuses to the host country).

We find that technology areas with higher levels of foreign-born expertise experienced much faster patent growth between 1940 and 2000, in terms of both quality and quantity, than otherwise equivalent technology areas. Although we do not identify a causal relationship, our quantitative evidence can be used alongside qualitative evidence to highlight two areas where immigrant inventors may have acted as catalysts to economic growth: through their own inventive activity and through externalities affecting domestic inventors.

Immigrant inventors were responsible for some of the most fundamental technologies in the history of US innovation, which still influence our lives today. For example, Nikola Tesla, who was born in Serbia, worked in America on alternating current electrical systems; the Scotsman Alexander Graham Bell was instrumental to the development of the telephone from a workshop in Boston; Swedish inventor David Lindquist, while living in Yonkers, New York, assigned his patents relating to the electric elevator to the Otis Elevator Company located in Jersey City, New Jersey; and Herman Frasch, a German-born chemist, worked in Philadelphia and Cleveland on techniques which are analogous to modern fracking.

In short, the evidence suggests that “immigrant inventors were of central importance to American innovation during the 19th and 20th centuries. Although the migration of high-skilled inventors to the US involved some costs, immigrant inventors contributed heavily to new idea creation, through both their own work and collaboration with domestic inventors. Our evidence aligns with the view that growth in an economy is determined by its ablest innovators, regardless of national origin. The movement of high-skilled individuals across national borders therefore appears to have aided the development of the United States as an innovation hub.”

Are CON Regulations Barriers to Entry?

Image result for con regulations

A 2016 Mercatus working paper argues that “certificate-of-need (CON) laws restrict healthcare institutions from expanding, offering a new service, or purchasing certain pieces of equipment without first gaining approval from regulators.” Drawing on data from the Standard Analytic Files and the American Health Planning Association, the authors review the 21 states with CON requirements “for at least one of three regulated imaging services: MRI (magnetic resonance imaging) scanners, CT (computed tomography) scanners, and PET (positron emission tomography) scanners. Medicare claims provide an estimate of the utilization of these different services and allow their utilization and accessibility to be compared between CON and non-CON states.”

The results?:

  • CON Regulations Have a Negative Effect on Nonhospital Providers
  • The association of a CON regulation with nonhospital providers is substantial, ranging from −34 percent to −65 percent utilization for MRI, CT, and PET scans. Nonhospital providers in CON states experience significant decreases in the utilization of imaging services compared to hospital providers.
  • CON Regulations Have No Effect on Hospitals, Thus Increasing Their Market Share
  • CON regulation has no measurable effect on hospitals’ utilization of imaging services. The volume of services provided in hospitals is not affected by CON regulation. This may explain why hospital providers have a stronger market presence in CON states than in non-CON states.
  • Consumers Are Driven to Seek Imaging Services in Non-CON States

The researchers conclude,

CON laws act as barriers to entry for nonhospital providers and favor hospitals over other providers. In consequence, consumers of MRI, CT, and PET scanning services are driven to seek these services either out of state or in hospitals. More research is needed to determine whether additional costs and barriers in the healthcare industry restrict specific market providers and affect where procedures occur. 

Did the EPA Change Its Stance on Fracking?

Image result for epaAccording to The New York Times,

The Environmental Protection Agency has concluded that hydraulic fracturing, the oil and gas extraction technique also known as fracking, has contaminated drinking water in some circumstances, according to the final version of a comprehensive study first issued in 2015. The new version is far more worrying than the first, which found “no evidence that fracking systemically contaminates water” supplies. In a significant change, that conclusion was deleted from the final study.

So why the change? Is there new evidence demonstrating that fracking is in fact a danger to water sources? Not really. CBS reports,

The government report notes concerns over well leaks and waste water spilling above ground. The agency didn’t pinpoint any damage related to the fracking deep underground itself. “What we found is that although the overall incidents of impacts is low, that there are vulnerabilities,” said EPA science adviser Thomas Burke. The EPA is taking a tougher stance than ever before. Language in an earlier draft of the report downplaying fracking concerns was removed. It said: “We did not find evidence that these mechanisms have led to widespread, systemic impacts on drinking water resources.” Burke explained why they omitted the lighter language. “The gaps in information unfortunately do not allow us to say how much, what is the rate of the impact. And so that sentence was removed,” Burke said.

Elsewhere, Burke told reporters, “While the number of identified cases of drinking water contamination is small, the scientific evidence is insufficient to support estimates of the frequency of contamination…Scientists involved with finalising the assessment specifically identified this uncertainty in the report.”

The above can hardly be interpreted as a seismic, anti-fracking change. Science writer Ronald Bailey observes,

First, most of the instances and speculations cited in the EPA report are applicable to all oil and gas wells, not just to wells created by means of fracking. These include harms caused by spills, leaks due to faulty well casings, and inadequate treatment and disposal of fluids and water that flow from wells.

Focusing chiefly on the process of fracking itself—creating cracks by injecting pressurized fluids into shale rocks as a way to release trapped oil and natural gas—the EPA report looks at four pathways by which fracking specifically could contaminate drinking water supplies. Most of the agency’s findings are couched in conditional language. They include the possibility that fluids and natural gas could migrate via fracked cracks that might extend directly into drinking water aquifers; because well casings for horizontal drilling might be less able to withstand the high fracking pressures they may be more likely to leak allowing contaminants to migrate; migration might occur when a fracked well “communicates” with a nearby previously drilled well that is not able to withstand the additional pressures from newly released natural gas; and fracked cracks might intersect with natural faults allowing contaminants to migrate into drinking water supplies.

The EPA cites the results of lots of computer models that find that migration of fluids and natural gas by these four pathways is possible. However, given the fact that by some estimates as many as 35,000 fracked oil and gas wells are drilled each year in the United States, it is astonishing how few examples of actual contamination and other harms are identified in the EPA report…Given even the limited quantitative findings in the EPA’s final report, the agency should have reaffirmed its original more qualitative statement that there is little “evidence that these mechanisms have led to widespread, systemic impacts on drinking water resources.”[ref]Bailey has more to say about global environmental trends.[/ref]

Read the report for yourself: “However, significant data gaps and uncertainties in the available data prevented us from calculating or estimating the national frequency of impacts on drinking water resources from activities in the hydraulic fracturing water cycle” (pg. 2). The 2015 draft report read, “We did not find evidence that these mechanisms have led to widespread, systemic impacts on drinking water resources in the United States” (pg. 6). These two reports communicate virtually the same thing. The newest report still, to quote the draft, “did not find evidence that these mechanisms have led to widespread, systemic impact on drinking water resources in the United States.” The language is simply massaged to emphasize “data gaps and uncertainties.” Both the draft and final reports acknowledge that fracking can impact drinking water sources under certain circumstances. That’s not a revelation. What the draft highlighted was the infrequency of these incidents. What the new report highlights is a lack of good data to quantify the frequency. However, the takeaway for the scientifically minded is nearly identical: there is no evidence that fracking has “led to widespread, systemic impact on drinking water resources.” Nonetheless, better data and continual research is needed (absence of evidence is not evidence of absence and whatnot).

Future evidence may indeed condemn fracking mechanisms or at least call for better regulations. For now, that evidence is sorely lacking. Natural gas is both economically and environmentally beneficial. We need to be careful not to squash it due to faulty interpretations of government reports.

Do Social Networks Matter More Than Institutions?

Image result for world connection cell phone

I’ve posted before about McKinsey’s findings regarding digital globalization. They reported,

Data flows directly accounted for $2.2 trillion, or nearly one-third, of [globalization’s] effect [in a decade]—more than foreign direct investment. In their indirect role enabling other types of cross-border exchanges, they added $2.8 trillion to the world economy. These combined effects of data flows on GDP exceeded the impact of global trade in goods.

This in turn supported research by economist Andreas Bergh, who found that

the poverty-decreasing effect of globalization is bigger in countries where institutions are worse. The graph below shows how the marginal effect of information flows on poverty varies depending on the level of bureaucratic quality. The slope looks the same for all institutional indicators, suggesting that globalization is especially important for the poor in countries with high corruption levels and inefficient public sectors.

A new Harvard working paper supports these findings, suggesting that communication networks and social interactions are more important than institutions. The authors explain,

Telling institutional versus socio-technological interpretations apart has been challenging. This paper tests these two hypotheses by measuring convergence in income across Colombian municipalities along two distinct geospatial divisions: one institutional, one socio-technological. The institutional explanation would emphasize the role that belonging to a particular departamento, or state, has on the institutional arrangements and the provision of public goods, thus affecting the incentive structure of agents to operate with better technology.

Although Colombia is a unitary republic, not a federation, states have significant autonomy1 . Studies on Colombia, including those that take an institutional perspective such as Acemoglu et al (2015)…utilize state-level data, as do almost all studies of intra-national unconditional convergence worldwide. Under the institutional assumption, a municipality should tend to converge to the income of the state to which it belongs.

The socio-technological explanation would predict that municipal income convergence should occur within the cluster of municipalities that interact intensely with each other, whether or not they belong to the same state. This is due to the need for intensive social interactions for knowhow to diffuse. To form these socio-technological groupings, we utilize a unique dataset of cellphone calls to group municipalities so that most of the phone calls happen within rather than between these clusters. To facilitate comparison with the 32 states of the institutional state aggregation, we group municipalities into 32 communication clusters…Thus, communication clusters are groups of municipalities that are densely connected through phone calls, meaning that they are significantly more likely to call members of the cluster than they are to call other municipalities (pgs. 4-5).

The authors conclude,

To test these two interpretations in a more direct way, we use municipal level data for Colombia, which we aggregate using two different grouping criteria: the departamento or state to capture institutional variation; and the communication cluster to which a municipality belongs, to capture the intensity of social interaction. We use formal wages per capita as our measure of income per capita, as it can be measured at the municipal level. We use cellphone data to group municipalities into communication clusters of intense interaction.

In this setting, we find evidence of absolute convergence in Colombia at the municipal level. We find evidence that the process is accelerated when the municipality belongs to a richer communication cluster. However, we do not find evidence of a positive influence of belonging to a richer state. We interpret these results as evidence in favor of the idea that obstacles to technology diffusion may be related to the fact that the use of technology requires tacit knowledge which tends to move slowly between brains through a protracted process of imitation and repetition as occurs in learning by doing. Within communications clusters, there seems to be accelerated convergence. Obstacles to convergence in developing countries may be related to the paucity of social interactions between citizens of the same country

…From a policy perspective, the findings emphasize the fact that economic convergence requires intense social interaction, not just the presence of institutions of a certain quality. Regions that are formally part of the same nation-state but do not really interact with the more advanced parts of the country cannot expect to share similar development outcomes.(pg. 19).

Fascinating stuff.

2016: Best Year Ever

Image result for 2016 burning dumpster

Here’s a bit of optimism after the train wreck that was 2016:

By conventional wisdom, 2016 has been a horrible year. Only someone living in a cave could have missed the flood of disheartening headlines. However, if 2016 continues the global trends of previous years, it may turn out to have been one of the best years for humanity as a whole.

Those of us who live in the world of poverty research and rigorous measurement have watched many global indicators improve consistently for the past few decades. Between 1990 and 2013 (the last year for which there is good data), the number of people living in extreme poverty dropped by more than half, from 1.85 billion to 770 million. As the University of Oxford’s Max Roser recently put it, the top headline every day for the past two decades should have been: “Number of people in extreme poverty fell by 130,000 since yesterday.” At the same time, child mortality has dropped by nearly half, while literacy, vaccinations and the number of people living in democracy have all increased.[ref]Similar to last year.[/ref]

The authors point to four things that can make 2017 even better for the poor and destitute:

  1. “First, give the poor cash. Studies in Kenya and elsewhere show that the simplest way to help is also quite effective. We also know that if we give cash, the poor won’t smoke or drink it away. In fact, a recent look at 19 studies across three continents shows that when the poor are given money, they are less likely to spend it on “temptation goods” such as alcohol and tobacco. More and more research shows that when the poor come into a windfall, they spend it on productive things — sending their children to school, fixing the roof that’s letting in the harsh weather or investing in a business.”[ref]This is perhaps more evidence in favor of a basic income.[/ref]
  2. “Second, innovative health-care delivery can dramatically improve outcomes…The nongovernmental organizations Living Goods and BRAC Uganda have been training women in Uganda to make a living by going door-to-door selling over-the-counter medications and health products. They function as franchisees in an “Avon lady”-style business. But these small-business owners also perform basic health checks for children to look for symptoms that warrant getting the child to a clinic. One randomized evaluation released this year concluded that taking this health care to people’s homes reduced child mortality (for those younger than 5) by an astounding 27 percent and infant mortality (less than a year old) by 33 percent.”
  3. “Third, access to mobile money may lift people out of poverty in large numbers…In Kenya, the M-Pesa mobile money system, introduced in 2007, allows anybody with a mobile phone to transfer money through a text message. Research from this year shows that as M-Pesa became more available in a local area, households became less poor — particularly households run by women. The study estimates that 185,000 women changed professions from subsistence agriculture to business and retail and that 194,000 households were lifted out of extreme poverty.”
  4. “Finally, mobile phone technologies are leapfrogging the reach of traditional telecom infrastructure, and text message reminders are proving to be effective at helping people follow through on things they want to do. One study found that they helped the poor save money. Another in Ghana aimed at combating drug resistance found that such reminders helped people to finish all of their antimalarial drugs. Researchers in Ghana also found that text message quizzes improved girls’ understanding of reproductive health, resulting in fewer reported pregnancies. In Kenya, another interactive text message system offering support for teachers helped reduce student dropouts by 50 percent.”[ref]The importance of mobile phone technologies is underappreciated.[/ref]

2017 is looking up.


PolitEcho and Difficult Run: Our Echo Chambers Examined

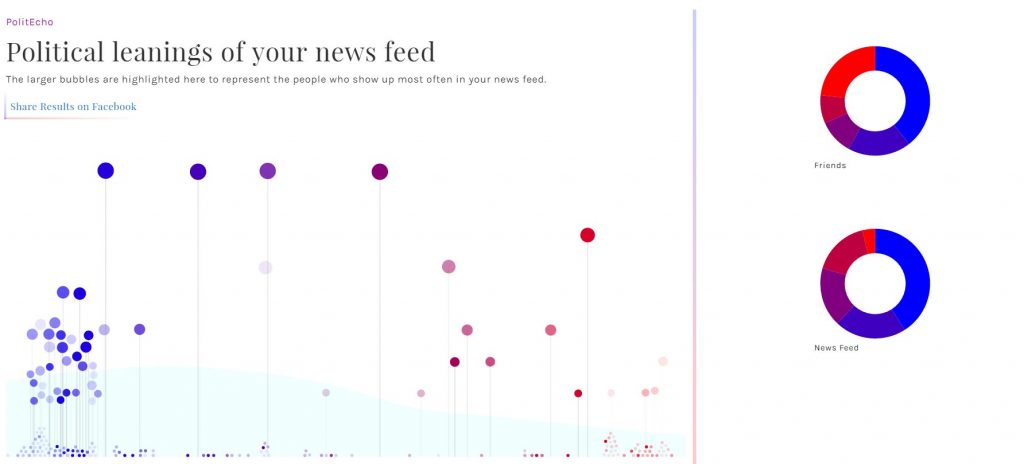
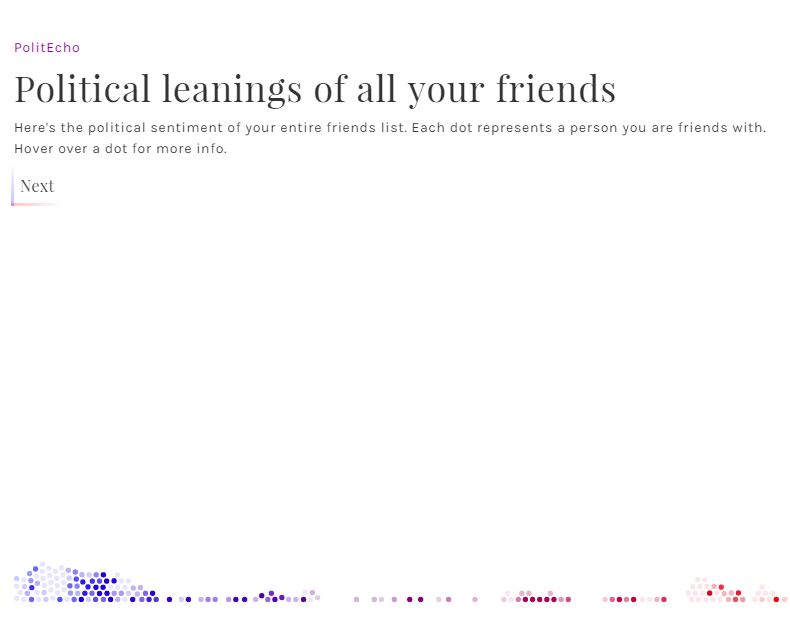
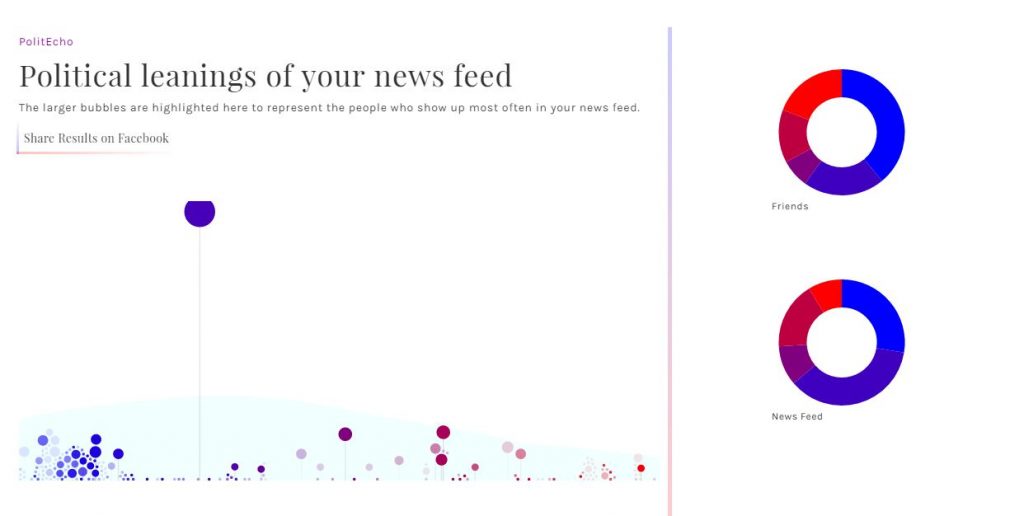
A week or two ago, I saw something interesting and new going around on Facebook: PolitEcho. It’s a cool idea. The app[ref]It’s a Google Chrome extension.[/ref] analyzes the politics of your friends on Facebook–and your feed–and then answers the question, “is your news feed a bubble?”

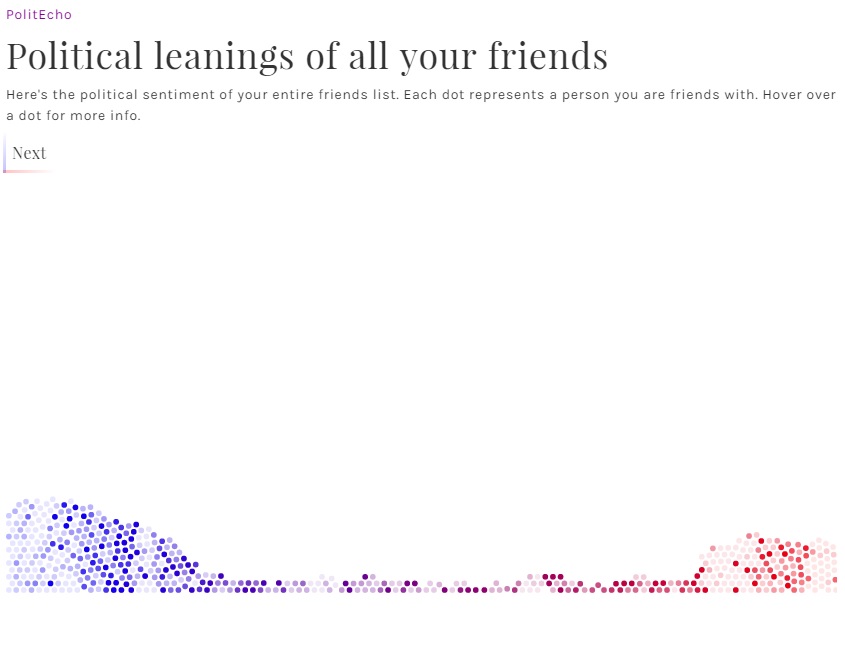
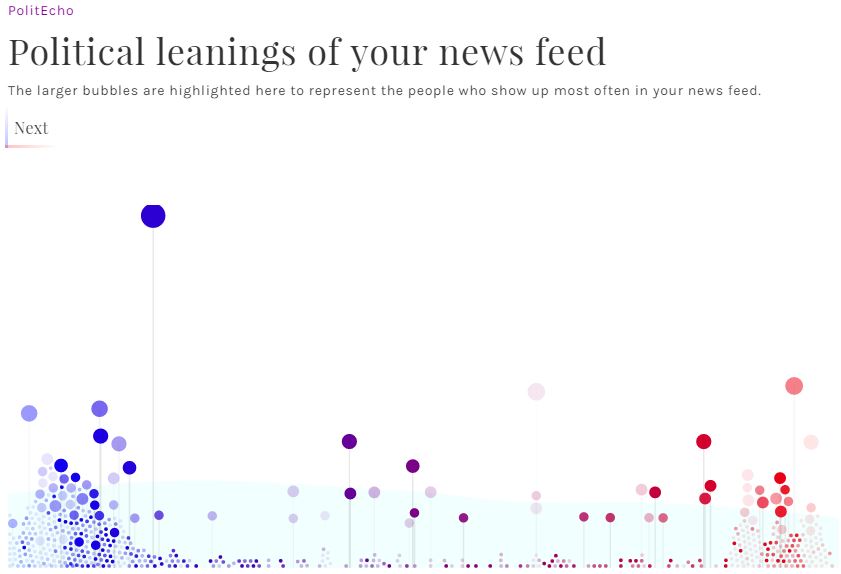
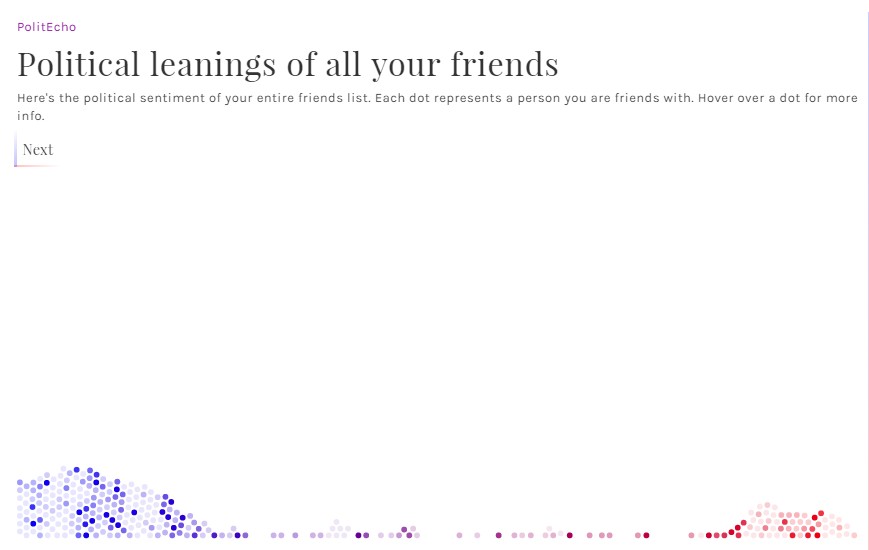
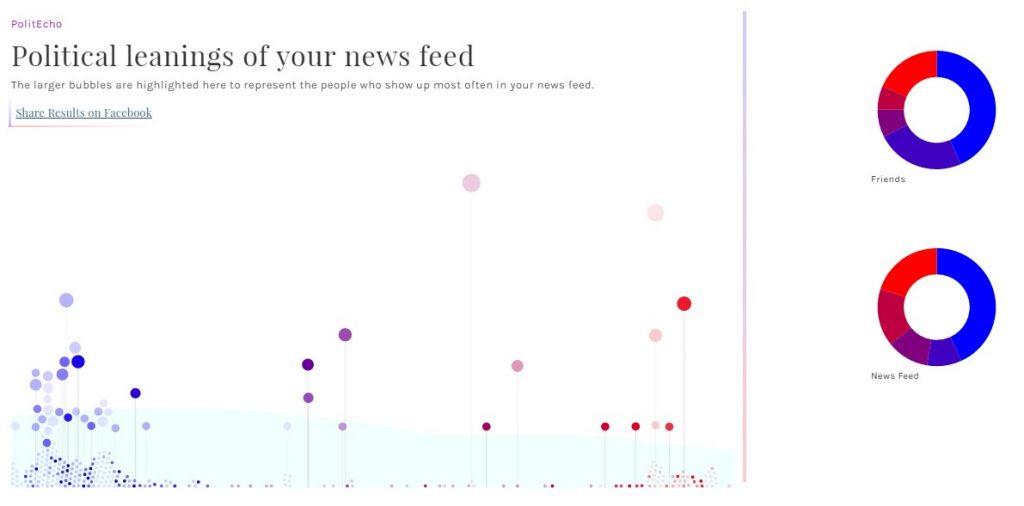
So I thought it would be fun to ask the Difficult Run editors to run the analysis on their own Facebook profiles and send me the results so that we could publish a little post that showed the respective bubbles of the folks who write for Difficult Run.

Now, before we get to the results, I have to lower expectations just a bit. Like a lot of data visualization projects, PolitEcho doesn’t really live up to its guiding concept. The way it analyzes political affiliation is very, very rudimentary. Instead of doing anything cool like using the Moral Foundations Word Count tool to conduct sentiment analysis on that things that your friends actually post[ref]This is just one example of what I’d love to do, given time and resources that I do not have.[/ref], instead PolitEcho just looks to see whether your friends have “liked” a variety of pre-screened news sources on Facebook. If they like Breitbart, for example, they’re conservative. If they like DailyKos, they’re liberal.  In other words, don’t read too much into this.

That said–and mostly for fun–here are what our political bubbles look like.

Nathaniel

Monica

Walker

Allen

So, that’s what our social networks look like, from one particularly naive political viewpoint.

How about yours?

McKinsey & Co.: Five Pillars of Growth

Image result for globalization

The McKinsey Global Institute has a new briefing paper entitled “The US Economy: An Agenda for Inclusive Growth.” The paper seeks ways to help America “regain its dynamism and restore the sense that everyone is advancing together.” The paper lists “five areas where targeted investment and policy action could create substantial economic impact.” This impact would include a rise in “GDP growth to 3 or even 3.5 percent.” These include:

  1. Digitization: “The US economy is rapidly digitizing, but its progress is highly uneven. Focusing on the gap between lagging sectors and those on the digital frontier is a key part of the productivity puzzle. Government can play a role by promoting digital investment, digitizing public services and procurement, clarifying regulatory standards to encourage digital innovation, and taking a nimble and experimental regulatory approach to keep pace with technological change.”
  2. Globalization and trade: “The current debate around trade misses the point that globalization is becoming more digital—a shift that plays to US strengths. Today, less than 1 percent of US firms sell abroad. There are ways to expand participation by helping small businesses export on global e-commerce platforms and playing a matchmaking role to connect individual cities and smaller companies with foreign investors. But it is also time to confront the needs of communities that have experienced trade shocks. The workers who are caught up in industry transitions need more than retraining; their communities need reinvestment.”
  3. America’s cities: “Eighty percent of the US population lives in cities or the surrounding metro areas. But investment in urban transport infrastructure has not kept up with their needs, creating congestion that harms both productivity and the quality of life. A shortage of affordable housing and commercial space has worsened the squeeze on households and small businesses. Addressing urban issues would improve mobility, create new investment opportunities, and benefit companies. The overall economy would stand to gain, since cities are the engines of productivity.”
  4. Skills: “The United States needs to build a more dynamic and efficient labor market. Colleges and universities have to adapt and address the growing cost burdens. Additionally, we could make occupational licenses more portable, create more short-term training and credential pathways, expand “earn while you learn” apprenticeships, and make better use of online talent platforms to improve matching and design quicker, more effective education pathways.”
  5. A resource revolution: “Competition among fuel sources and efficiency improvements are combining to produce an unheralded energy revolution. Technology innovations are driving increased efficiency both in demand and supply, and renewables are becoming more price competitive. America’s widely diversified energy portfolio has hugely benefited the economy. The most important thing the ongoing resource revolution needs is room to play out. Technology is moving quickly, and a responsive regulatory approach would speed the allocation of capital to the most promising opportunities. The primary policy agenda here involves reducing friction and market distortions.”

Definitely a list worth considering.

Mobile Phones, Broadband, and the Poor

The Telecommunication Development Sector (ITU-D) released their 2016 ICT Facts and Figures with the following chart:

image11003

Technology analyst Benedict Evans tweeted the chart with the tongue-in-cheek caption “The evils of capitalism.” He followed up with, “That 5bn people have a phone & 2.5bn already have a smartphone is a huge achievement of, mostly, free markets and permissionless innovation…It’s been clear for a decade that access to communications transforms prospects for the poorest. A phone *does* put food in your belly.”

People are sometimes skeptical of this last claim, but they shouldn’t be. For example, a 2016 World Bank report found that “[a]lmost every study, despite the methodology and whether it was cross-country or single country, found a positive economic impact from fixed broadband” (pg. 11). A 2016 report from the McKinsey Global Institute found “that widespread adoption and use of digital finance could increase the GDPs of all emerging economies by 6 percent, or a total of $3.7 trillion, by 2025. This is the equivalent of adding to the world an economy the size of Germany, or one that’s larger than all the economies of Africa. This additional GDP could create up to 95 million new jobs across all sectors of the economy.” A 2012 report prepared by Deloitte for the GSM Association found that “[o]n average, across the sample of 14 countries considered, if countries doubled their consumption of mobile data per 3G connection between 2005 and 2010, they would have experienced a growth rate of GDP 0.5 percentage points higher each year” (pg. 7). A 2014 report from the Gates Foundation notes that “mobile data has been used by researchers, mobile operators and governments to help plan emergency response after natural disasters, enhance access to financial services for the poor, track the spread of infectious disease, and understand migration patterns of vulnerable populations. Indeed the full range of ways that mobile data can be used to improve the lives of poor people is only beginning to be explored” (pg. 4). A 2015 study found “evidence that the use of mobile money increases the use of formal savings accounts and allows for more effective risk sharing. In recent research, we show another important channel through which mobile money can enhance economic development. Namely, by allowing easier access to larger amounts of trade credit, mobile money allows firms higher production, with important macroeconomic repercussions.” The situation of Kerala fisherman also demonstrates the impact of mobile phones. As The Economist reports,

Dividing the coast into three regions, [economist Robert] Jensen found that the proportion of fishermen who ventured beyond their home markets to sell their catches jumped from zero to around 35% as soon as [phone] coverage became available in each region. At that point, no fish were wasted and the variation in prices fell dramatically. By the end of the study coverage was available in all three regions. Waste had been eliminated and the “law of one price”—the idea that in an efficient market identical goods should cost the same—had come into effect, in the form of a single rate for sardines along the coast.

This more efficient market benefited everyone. Fishermen’s profits rose by 8% on average and consumer prices fell by 4% on average. Higher profits meant the phones typically paid for themselves within two months. And the benefits are enduring, rather than one-off. All of this, says Mr Jensen, shows the importance of the free flow of information to ensure that markets work efficiently. “Information makes markets work, and markets improve welfare,” he concludes.

A 2008 World Bank study found that the mobile sector and use of mobile phones (1) boost GDP, (2) create jobs, (3) increase productivity, (4) increase tax revenue, (5) enable entrepreneurship and job search, (6) reduce information asymmetries, (7) correct market inefficiencies, (8) reduce transportation costs, (9) create consumer surplus, (10) aid disaster relief, (11) disseminate educational and health information, and (12) promote social capital and social cohesion. Other sources point to access to money and banking, improved governance, and disseminated agricultural, health, and educational information.

These various studies and reports confirm what economist Andreas Bergh found about globalization: larger information flows reduce poverty. If we want to help the poor, we need to integrate them into the global economy.

Infographic: Mobile Phones Tackling Poverty

The Future of Technological Advancement

Image result for technological progress
Not the most profound example, but it works.

Many critics today believe the notion that the days of economic growth and technological innovation are behind us. Yet, Oxford’s Ian Goldin and Chris Kutarna argue that these critics are mistaken.[ref]Economic historian Joel Mokyr also thinks the critics’ arguments are overblown.[/ref] The critics, they argue, imagine “technological innovation to be like pulling balls from an urn, each ball representing a new idea. In the beginning, the urn was full and the spheres were large, but each time we’ve gone back to the urn, we’ve had to reach deeper than the last, and the spheres have dwindled into marbles.” In their view, however,

this metaphor, while intuitive and compelling, is backwards (Goldin and Kutarna 2016). Innovation is more like mixing compounds in an alchemist’s lab. Each compound is an existing idea or technology, and in the beginning we had just a few – maybe some salt, sugar, and common liquids. But then we tried mixing them together, and some of them reacted with one another to form new compounds…This metaphor is far closer to the present experience in research laboratories. Across the sciences, the pace of discovery is generally rising, not falling. For reliable evidence, consider the pharmaceuticals industry (a good litmus test because it invests more into R&D than any other industry, except aerospace). The year 2013 set a new record for total drugs launched world-wide (48) – a record that was promptly beaten in 2014 (61). With another 46 drugs launched in 2015, the last three years have been the industry’s three most productive in its history. Recent major discoveries include new weapons against heart failure, which in an aging world is now the leading cause of death; immunotherapies, which help to defeat cancers by boosting the body’s own immune response; and a viable pathway to effective Alzheimer’s medications within a decade. In part thanks to the accelerating pace of pharmaceutical achievements like these, average life expectancy across advanced economies is now rising an unprecedented four to five hours per day.

Goldin and Kutarna defend their view in a way that would make Julian Simon smile:

The broader cause for these emerging paradigm shifts is the inflation in human brainpower that has taken place over the past 25 years. Thanks to giant medical successes against childhood disease and aging over the past quarter-century, the present global cohort of adults is humanity’s largest and healthiest ever. It is also the best-educated. In just a generation, illiteracy has fallen from nearly half to just one-sixth of humanity. In 30 years, we’ve added three billion literate brains to our ranks. Meanwhile, the rapid expansion of higher learning in Asia means that the number of people alive right now with a university degree is greater than the total number of degrees awarded in history prior to 1980. Most importantly, the present generation is history’s best-connected, thanks principally to a quartet of big events – the end of the Cold War, waves of democratisation across Latin America, much of Asia and sub-Saharan Africa, China’s emergence from autarky, and the advent of digital communications.

Neither history, nor the present-day pace of scientific discovery supports the notion of diminishing returns to technological innovation. The challenge for growth economists is that analytic models are poorly suited to capture, and set society’s expectations for, these impending disruptions…Growth economics is powerful. At its best, it is an empirical science that helps determine how to lift human wellbeing – one of civilisation’s most important tasks. But it is unable to capture the dynamism of our new age of discovery for a reason. Much that matters is still beyond its sight.

We need an economy and a government that support dynamism and provide fertile ground for innovation.