DR Editor in BYU Studies Quarterly: “Ye Are No More Strangers and Foreigners”

I’m excited to announce that my article “”Ye Are No More Strangers and Foreigners”: Theological and Economic Perspectives on the LDS Church and Immigration” has been published in the latest issue of BYU Studies Quarterly. From the abstract:

Issue 57:1 CoverImmigration policy is controversial topic in 2018. In response to refugee crises and legal situations that can break up families, the LDS Church announced its “I Was a Stranger” relief effort and released a statement encouraging solutions that strengthens families, keeps them together, and extends compassion to those seeking a better life. This article seeks to shed light on a correct understanding of immigration and its effects. Walker Wright gives a brief scriptural overview of migration, explores the public’s attitudes toward immigration, and reviews the empirical economic literature, which shows that (1) fears about immigration are often overblown or fueled by misinformation and (2) liberalizing immigration restrictions would have positive economic effects.

From the editors:

Walker Wright’s article on religious and economic perspectives about immigration, strangers, and refugees is marvelously timely. He approaches the debate over immigration through a double lens: the Church’s official statements and scholarly research on the economic effects of immigration. He demonstrates that the Church’s accommodating approach is overwhelmingly supported by the research. Migration is often impelled by external pressures, but it is ultimately the voluntary response of those fleeing to improve their lives. Immigrants come unassigned, so people can reach out to them without needing to be asked (pg. 5).

The article is divided into the following sections:

  • “I Was a Stranger”
  • Migration in Scripture and Sacred History
  • Strangers, the Sin of Sodom, and Zion
  • Public Opinion on Immigration
  • The Economy as a Whole
  • Global Poverty
  • Refugees
  • Common Objections to Immigration
    • “Stealing” Jobs
    • Depressed Wages
    • Culture and Institutions
    • Fiscal Burden and Welfare Cost
    • Terrorism and Crime

Check it out. You can also access it on my Academia.edu page.


Pro-science = Pro-nuclear energy

Every time I see a meme like this…

…I can’t help but notice it’s missing a few lines. GMOs are safe. Humans begin as zygotes. And nuclear energy is efficient.

Ronald Bailey, the science correspondent for Reason, brought that last fact to my mind when he recently published the article “How We Screwed Up Nuclear Power.”

The Oyster Creek Nuclear Generating Station in New Jersey opened in 1969. It cost $594 million (in 2017 dollars) and took four years to build. America’s newest nuclear plant, at Watts Bar in Tennessee, opened in 2016. It cost $7 billion and took more than 10 years to complete.

What happened? Anti-nuclear activism and regulation.

In general, scientists are a lot less concerned about nuclear power than the general public is. According to Pew Research, 65% of AAAS members–including 75% of working engineers and 79% of working physicists Ph.D’s–favor building more nuclear power plants, compared to only 45% of the public. If we are defining “pro-science” as “recognizing and agreeing with the majority view of scientists in the field,” then being pro-science would include being pro-nuclear energy.

Total and Intangible Wealth: World Bank Report 2018

I’ve mentioned the World Bank’s measurement of intangible assets before. Its recent report–The Changing Wealth of Nations 2018: Building a Sustainable Future–updates this measurement:

Image result for human capitalTotal wealth in the new approach is calculated by summing up estimates of each component of wealth: produced capital, natural capital, human capital, and net foreign assets. This represents a significant departure from past estimates, in which total wealth was estimated by (1) assuming that consumption is the return on total wealth and then (2) calculating back to total wealth from current sustainable consumption…In previous estimates, produced capital, natural capital, and net foreign assets were calculated directly, then subtracted from total wealth to obtain a residual.

The unexplained residual, called “intangible capital,” was largely attributed to human capital…as well as to missing or mismeasured assets and possible effects of social capital. But the unexplained residual accounted for 50–85 percent of the total wealth indicator, making it a weak indicator for policy. This approach was taken because of the lack of data for directly measuring human capital. We now have a method and data for estimating human capital directly and will measure total wealth as the sum of each asset category. The advantage of the earlier approach was that the residual included human capital, unmeasured assets, and the influence of institutions and governance on wealth. The disadvantage was that the various components of the residual could not be disentangled and it was calculated assuming the same return on assets in all countries.

Human capital in the past was not measured explicitly but included as part of the “residual,” accounting for 50–85 percent of total wealth in past estimates. We apply the well-known Jorgenson Fraumeni lifetime earnings approach to measuring human capital globally. We use a unique database developed by the World Bank, the International Income Distribution Database, which contains more than
1,500 household surveys (pgs. 38-39).

This report

shows for the first time that much of intangible wealth is actually human capital, estimated as the net present value of the population’s future labor earnings. Human capital turns out to be the most important component of wealth, even though its share in total wealth decreased from 69 percent in 1995 to 64 percent in 2014 (table 2.2). After 2000, this decline in the share of human capital wealth was entirely due to upper-middle and high-income OECD countries, which together account for more than 80 percent of global wealth as well as most human capital wealth. The factors that led to this decline include the aging of the labor force (which reduces the remaining years of earnings) in many high-income OECD countries, as well as in China, which dominates the upper-middle-income country group, and declining wage shares in GDP, particularly in many high-income OECD countries (ILO 2015). By contrast, in low- and lower-middle-income countries, which account for the majority of the world’s population, the share of human capital in total wealth is rising (pgs. 46-47).

The new report calculates total wealth as follows:

Total wealth = Natural capital + Produced capital + Human capital + Net foreign assets

“This represents a significant departure from past estimates,” the report explains,

in which total wealth was estimated by assuming that consumption is the return on total wealth, and then calculating back to total wealth from current sustainable consumption (“top-down approach”). In previous estimates, produced capital, natural capital, and net foreign assets were calculated directly, then subtracted from total wealth to obtain a residual. The unexplained residual, called “intangible capital,” was largely attributed to human capital as well as to missing or mismeasured assets. Now with a direct measurement of human capital,[ref]See Ch. 6 for an explanation of the methodology for measuring human capital.[/ref] total wealth can be estimated as the sum of all categories of assets (pg. 212).

In turns out that the U.S. has $983,280 total wealth per capita with human capital making up $766,470 (see pg. 232). Other findings include:

  • The report found that global wealth grew 66 percent (from $690 trillion to $1,143 trillion in constant 2014 U.S. dollars at market prices).
  • The top 20 countries with the fastest growing wealth per capita were dominated by developing countries—including two of the biggest—China and India, which were both classified by the World Bank as low income countries in 1995 and are now ranked as middle-income.
  • Countries with large gains in per capita wealth also included smaller countries like Chile, Peru, Vietnam, as well as countries rapidly recovering from civil disturbances like Bosnia-Herzegovina, Ethiopia, Rwanda, and Sri Lanka as well as some of the resource rich countries in the former USSR, like Azerbaijan.
  • Per capita wealth declined or was stagnant in more than two dozen countries in various income brackets. These include several large low-income countries, some carbon-rich countries in the Middle East, and high-income OECD countries affected by the 2009 financial crisis. Declining per capita wealth implies that assets critical for generating future income may be depleted, and the rents generated from natural assets depletion are not invested properly, a fact often not reflected in national GDP growth figures.
  • Human capital is the largest component of global wealth, accounting for two thirds of total wealth globally. This points to the need to invest in people for wealth creation and future income generation.
  • While natural capital accounts for 9 percent of wealth globally, it makes up nearly half (47 percent) of the wealth in low income countries. More efficient, long-term management of natural resources is key to sustainable development while these countries build their infrastructure and human capital.
Breaking News: Communism Makes People Worse Off

From a recent study:

Our bivariate analyses show that the recent cultural factors examined—communist history and religion—are, taken alone, good predictors of the Human Development Index and its components (table 1). When incorporated alongside phylogeny and geography, phylogeny ceases to be a significant predictor of HDI or any of its components, meaning recent cultural factors combined with geography can account for covariation between HDI and cultural phylogeny (table 3). Communism significantly negatively predicts HDI, income and health indices, but religion ceases to be a significant predictor except for a negative correlation between Islam and education index. These results support a significant effect of communist history on the human development of countries, comparable to the effects of geography (which remains a significant predictor of HDI and income index), and more immediately important than cultural phylogeny or religion.

…Communist history shows a significant negative correlation with the national income of the countries in our dataset. Post World War II economic growth in communist countries was modest, especially during the 1970s and 1980s, relative to non-communist European countries [92], and the centrally planned economy of communist countries has long been held by economically liberal theoreticians to hamper conventional economic growth [9395]. Although the countries in the dataset had abandoned communism for most of the years in the dataset, the residual effect of communism appears to still be detectable. Institutional and cultural traits produced by communism and by dictatorship may continue to retard growth today, with corruption still regarded as higher in Eastern than Western Europe [96] and linked to lower national income [97]. It should also be noted, however, that many of the former communist countries (largely those in the former Soviet Union) also suffered major economic turmoil following the demise of their communist governments [98], and that this too may play a role in explaining the apparent effect of communism on income. Moreover, it must be noted that the communist countries in the sample are all Eastern European and Central Asian, and that these areas were less wealthy than Western Europe even prior to communism [92,99], and indeed Russia saw rapid economic growth following the advent of communism, although this lessened over time [92,100]. For all these reasons the results presented here must be treated with caution, and are primarily intended as a control in the context of examination of deep cultural effects on human development, not as a thoroughgoing analysis of the effects of communism on development.

Communism also shows a significant negative association with health index (i.e. normalized longevity), although only at p = 0.05 level. This confirms the stagnation and even decline of life expectancy in Europe under communism during the 1970s and 1980s, corresponding to years of low economic growth (see above), which has continued to set formerly communist countries back in terms of life expectancy until today [101,102]. The proximate causes for this low life expectancy are complex, but high alcohol consumption, smoking and poor workplace safety, as well as low quality diet and living conditions associated with lower income levels are implicated [101]. Most of the same caveats also apply here as to the economic effects of communism however, with lifespan decreasing rapidly in the former Soviet Union immediately following post-Soviet collapse [101], and lifespan having increased strongly in the Soviet Union prior to and immediately after World War II [103].

Longevity greatly increased during recent centuries in Europe in part due to generally rising living standards (and thereby nutrition [104]), with increasing health and longevity interacting with the economy in a positive feedback loop [105]. Communist history may thus have also influenced longevity via its effect on income, with income being a significant predictor of health index (electronic supplementary material, table S1). Consistent with this explanation, we find that communism is no longer a significant predictor of health index when controlling for income index.

Communism lowers human well-being. Who knew?[ref]There’s more to the study (such as Islam’s negative correlation with education), but this jumped out at me.[/ref]

Image result for wow black guy gif

The Peter Principle: Is There a Managerial Mismatch?

From a new NBER working paper:[ref]Here’s an earlier ungated version, which is quoted.[/ref]

Image result for peter principleBecause managers and workers apply different skills, the best workers may not be the best candidates for managers. When this is the case, do firms promote someone who excels in her current position, or someone who is likely to excel as a manager? If firms promote based on current performance, then firms may end up with worse managers. Yet if firms promote based on traits that predict managerial potential, then firms may pass over higher performing workers, weakening the power of promotions to encourage workers to perform well in their current roles. Such promotion policies could also lead to perceptions of favoritism, unfairness, or that succeeding in one’s job goes unrewarded.
Using detailed microdata on sales workers in US firms, we provide the first large scale empirical evidence suggesting that firms prioritize current performance in promotion decisions at the expense of promoting the best potential managers. Our findings are consistent with the “Peter Principle,” which, in its extreme form, states that firms promote competent workers until they become incompetent managers (Peter and Hull 1969).

…Overall, our empirical findings are consistent with the Peter Principle: firms promote based on current job performance even though pre-promotion sales negatively predicts managerial performance and other observable characteristics positively predict managerial performance. We caution that our results do not imply that firms use suboptimal promotion policies or have mistaken beliefs. Promotion policies that favor strong sales performance may provide a variety of incentive benefits that justify the costs of managerial mismatch. For example, promoting based on current job performance may help preserve tournament incentives (Lazear and Rosen 1981). Prioritizing objective performance measures in promotions may also improve incentives by avoiding favoritism (Prendergast 1998) and maintaining fairness norms. Promotion policies based on verifiable performance metrics such as sales may also discourage the manipulation of other, more fungible performance metrics such as credit sharing and collaboration experience (DeVaro and Gurtler 2015). What our results do show is that the costs of not promoting the best potential managers are high: our estimates suggest that firms are willing to forgo up to a 30% improvement in subordinate performance to achieve better incentives or to avoid costly politicking.

…This study offers the first empirical tests of the Peter Principle using data on promotions across a large number of firms. Although theoretical work and reviews have hypothesized that promotions based upon current job performance may yield managerial mismatch (Fairburn and Malcomson 2001; Waldman 2003; Lazear 2004), scant empirical research has tested the Peter Principle directly. Our work is most closely related to Grabner and Moers (2013), which shows that a bank places less weight on current job performance when a promotion would be to a job performing dissimilar tasks. However, Grabner and Moers uses data from a single firm and does not attempt to estimate the cost of the Peter Principle. Understanding the costs associated with the Peter Principle is important because it helps explain a variety of organizational practices, such as the use of parallel job ladders for individual contributors and managers, or the use of separate evaluation criteria for performance (which are often tied to bonuses) and potential (which are often tied to promotions) (pgs. 1-5).

Being a good worker does not mean one will be a good manager.

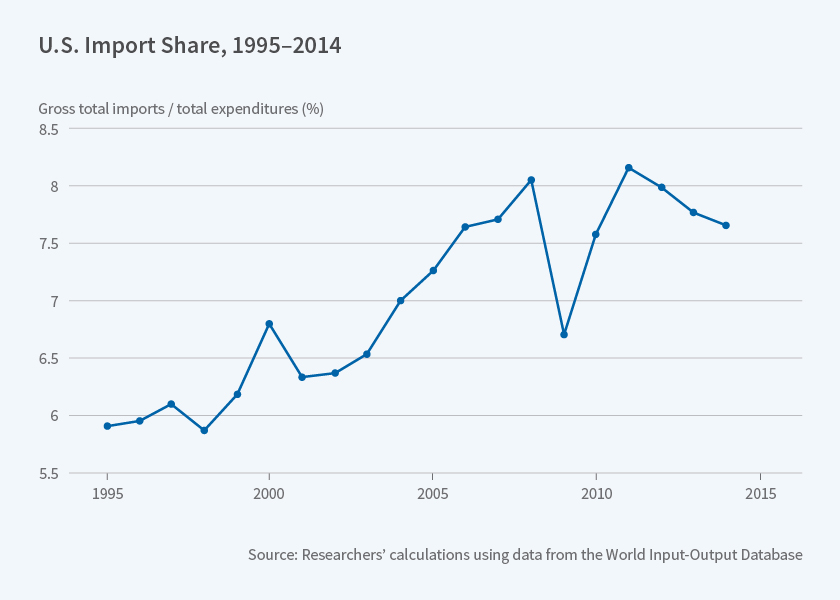
What Are the Economic Gains from International Trade?

Reporting on a recent working paper, the April 2018 NBER Digest summarizes,

 There is surprisingly little direct quantitative evidence on how the U.S. economy would react if the door were shut on trade. To find a precedent, the researchers point out that one could go back to the Embargo Act of 1807, when the United States banned trade with Great Britain and France in retaliation for their repeated violations of U.S. neutrality. GDP declined sharply, but the agrarian world during the presidency of Thomas Jefferson bears little resemblance to today’s high-tech, service-oriented economy.

…To simplify the analysis, they elect to focus on trade in factor services, namely the labor and capital embedded in goods purchased from around the world. They then estimate the gains from trade by comparing the size of a counterfactual U.S. economy that depends entirely on domestic resources with one that has access to foreign factor services through international trade.

…The researchers do not offer a single estimate of the gains to the U.S. economy from international trade, but they suggest that the reasonable range falls between 2 and 8 percent of GDP. They acknowledge that while foreign trade raises the level of economic output, not everyone is a winner. Consumers enjoy lower prices, but some workers may see that benefit offset by declining wages or layoffs.

Not too shabby.

Related image

Would You Give Up Your Right to Vote for a Pay Raise?

Image result for vote

Over a third of Americans would for an immediate 10% annual raise, according to a new survey. Here are the results in full:

    • 40.06% would give up dental care for the next five years
    • 12.2% would break up with their partner or significant other
    • 53.55% would give up all social media accounts for the next five years
    • 88.61% would give up watching Game of Thrones for life
    • 43.86% would give up exercise for the next five years
    • 34.98% would give up the right to vote in all elections for life
    • 9.13% would give up their child’s or future child’s right to vote in all elections for life
    • 73.42% would give up all alcoholic beverages for the next five years
    • 17.93% would give up Social Security benefits for the next two years
    • ​18.9% would give up access to health insurance for the next five years
    • 50.65% would give up watching movies for the next three years
    • 55.9% would work an extra 10 hours per week for life
    • 15.27% would give up all of their vacation days for the next five years
    • 47.74% would give up all caffeinated products for the next two years
    • 50.4% would work one day every weekend for the next year
  • 5.33% would eat a single tide pod

Why would people give up this right? Because they have every incentive to do so. As explained by Jason Brennan,

There is some debate among economists and political scientists over the precise way to calculate the probability that a vote will be decisive. Nevertheless, they generally agree that the probability that the modal individual voter in a typical election will break a tie is small, so small that the expected benefit (i.e., p[V(D)V(R)]p[V(D)−V(R)]) of the modal vote for a good candidate is worth far less than a millionth of a penny (G. Brennan and Lomasky 1993: 56–7, 119). The most optimistic estimate in the literature claims that in a presidential election, an American voter could have as high as a 1 in 10 million chance of breaking a tie, but only if that voter lives in one of three or four “swing states,” and only if she votes for a major-party candidate (Edlin, Gelman, and Kaplan 2007).[ref]On average, a voter has a 1-in-60 million chance of changing the outcome of a presidential election.[/ref] Thus, on both of these popular models, for most voters in most elections, voting for the purpose of trying to change the outcome is irrational. The expected costs exceed the expected benefits by many orders of magnitude.

Consider the following costs:

[S]uppose my favored candidate (who is worth $33 billion more to the common good) enjoys a slight lead in the polls. She has a very small anticipated proportional majority. The probability that any random voter will vote for her is 50.5 percent. This is an election we would describe as “too close to call.” Suppose also that the number of voters will be the same as in the 2004 U.S. presidential election: 122,293,332. I vote for my favored candidate. In this case, the expected value (for the common good) of my vote for the better candidate is $4.77 x 10^-2650 , that is, approximately zero. Even if the candidate were worth $33 billion to me personally, the expected value for me of my vote would be, again, a mere $4.77 x 10^-2650 . That is 2,648 orders of magnitude less than a penny. In comparison, the nucleus of an atom, in meters, is about 15 orders of magnitude shorter than I am. In meters, I am about 26 orders of magnitude shorter than the diameter of the visible universe. In pounds, I am about 28 orders of magnitude less heavy than the sun. Even if the value of my favored candidate to me were dramatically higher, say ten thousand million trillion dollars, the expected value of my vote in our example—for a close election—remains thousands of orders of magnitude below a penny. For an election in which the candidate has a sizable lead, the expected utility of an individual vote for a good candidate drops to almost zero.

The Beneficence Argument appeals to the public utility of individual acts of voting. However, suppose all you care about is maximizing your contribution to the common good. If so, voting would not merely fail to be worthwhile— it would be counterproductive. It turns out that the expected disutility of driving to the polling station (in terms of the harm a driver might cause to others) is higher than the expected utility of a good vote. This is not hyperbole.

Aaron Edlin and Pinar Karaca-Mandic have estimated the expected accident externalities per driver per year in the United States—that is, the amount of damage the average driver imposes on others from accidents and reckless driving. The expected accident externalities range from as little as $10 in low-traffic-density North Dakota to more than $1,725 in high-traffic-density California. Suppose a North Dakotan takes five minutes to drive to the polling station. The average expected accident externality of a five-minute drive in North Dakota is $9.5 x 10^-5 , much larger than the expected benefit of a good vote in the previous example. So the voter imposes greater expected harm on her way to the polls than she could compensate for by a good vote.[ref]Jason Brennan, The Ethics of Voting, pgs. 19-20.[/ref]

Can’t say I blame people.

The Economic Impact of Immigration: UK Edition

Image result for brexit

Economist Jonathan Portes has an excellent summary of the research on immigration’s effects in the UK:

  • Employment: “To the considerable surprise of many economists, including me, there is now a clear consensus that even in the short-term migration does not appear to have had a negative impact on the employment outcomes of UK natives. Studies have generally failed to find any significant association between migration flows and changes in employment or unemployment for natives (see, for example, BIS 2014 for a review).  Since 2014, the continued buoyant performance of the UK labour market has further reinforced this consensus. Rapid falls in unemployment, now down to just over 4%, have been combined with sustained high levels of immigration. Nor is there any evidence that immigration has impacted the employment prospects of specific groups such as the young or unskilled. Crudely, immigrants are not taking our jobs – the lump of labour fallacy, that the number of jobs or vacancies in the economy is fixed (which generally refers to the medium to long term) turns out to be a fallacy in the short term as well.”
  • Wages: “While the evidence on wage impacts is less conclusive, the emerging consensus is that recent migration has had little or no impact overall, but possibly some, small, negative impact on low-skilled workers. Dustmann et al. (2013), using UK LFS data for the period 1997-2005, find that immigration put a downward pressure on the wages at the bottom of the distribution (below the 20th percentile), while the effect on the rest of the distribution (in particular above 40th percentile) is positive. Their estimates show that a 1% increase in the foreign-born/native population ratio leads to an increase of between 0.1% and 0.3% in average wages.”
  • Productivity: “Immigrants’ skills may complement those of natives.  A number of papers support this hypothesis: for example, Barone and Moretti (2011) found that low-skilled migration increased the labour force participation of highly skilled native women; Peri and Sparber (2009) and Foged and Peri (2016) found that low-skilled migration increased the wages of native low skilled workers.  In particular, they argue that natives may have a comparative advantage in jobs with more communication-intensive tasks with respect to foreign workers, and that immigration ‘pushes’ low-skilled natives to occupations with a higher intensity of such skills, increasing the level of specialisation in the economy and hence productivity, as signalled by the corresponding increase in wages. Immigration might also influence the level of human capital in the economy, either directly if immigrants have high educational attainment (Kerr and Lincoln 2010, Hunt and Gauthier-Loiselle 2010), or indirectly by increasing the incentive on natives to acquire human capital. Some evidence (Hunt 2017, McHenry 2015) suggests that increased low-skilled immigration increase school performance and outcomes for US natives…Looking at the service sector, Ottaviano et al. (2015) show that a 1% increase in immigrants’ concentration in local labour markets is associated with a 2% to 3% rise in labour productivity, measured as gross value added per worker, mainly as a result of the cost-cutting dynamics implied by immigration-induced labour supply shocks. In addition, immigration represents a substitute for the import of intermediate inputs and is associated with an increase in exports to immigrants’ countries of origin.   Rolfe et al. (2013) found that immigrants concentration within specific industries was associated with slight increases in productivity, but the impact was small. At the aggregate level, recent literature uses cross-country evidence to estimate the impact of migration on growth and productivity in advanced economies. Boubtane et al. (2015) find that migration in general boosts productivity in advanced economies, but by varying amounts; for the UK, the estimated impact is that a 1 percentage point in the migrant share of the working age population leads to a 0.4-0.5% increase in productivity. This is higher than in most other advanced economies and reflects the relatively high skill levels of migrants to the UK. Jaumotte et al. (2016) find that a 1% increase in the migrant share of the adult population results in an increase in GDP per capita and productivity of approximately 2%. This result is consistent across a variety of empirical specifications.  Perhaps surprisingly, the estimated aggregate impacts of high and low skilled migration are not significantly different (although the distributional implications are very different). In a within-country perspective, Peri (2012), with a state-based analysis in US, finds that a 1% increase in immigration raises total factor productivity by 0.5%, mainly thanks to increased specialisation induced by immigrants’ inflows.”
  • Fiscal: “Dustmann and Frattini (2014) found that recent migrants, especially those from the EU, had a more positive fiscal impact on average than natives.  Of course, it is hardly surprising that young migrants in employment make an initial positive fiscal contribution; proper assessment of fiscal impacts requires a life-cycle perspective (Preston 2014).   In this context, there are various reasons to expect the impact to still be positive (in particular, migrants tend to arrive after they have left compulsory, publicly financed education). However, a positive net impact on public finances at the national level does not preclude a significant impact on demand (and hence cost) at the local level, particularly if funding allocations do not adjust quickly (or at all) to reflect pressures resulting from migration (George et al. 2011). A notable recent example is the shortage of primary school places in some parts of the UK (especially London); this appears to be largely the result of poor planning on the part of central government, given the rise in the number of young children resulting from recent increases in migration (from both the EU and elsewhere). But broader concerns about the potential negative impacts on public services appear to be largely unsubstantiated: higher immigration are not associated, at a local level, with longer NHS waiting times (Giuntella et al. 2015); and in schools, increased numbers of pupils with English as a second language doesn’t have any negative impact on levels of achievement for native English speaking students (Geay et al. 2013). If anything, pupils in schools with lots of non-native speakers do slightly better.”
  • Prices: “Frattini (2008) analyses the impact on tradable, non-tradable goods and services prices across UK regions over the period 1995-2006 and shows that immigration is associated with a fall in prices for non-tradeable goods and services, but a rise in the price of tradeables.  Sá (2015) focuses on the impact on housing prices in UK local authorities from 2003 to 2010 and shows that immigration actually reduces house prices at a local level, since natives leave the area in response to high immigrant inflows; although this does not imply, of course, that immigration does not overall exert upward pressure on house prices at a national level.”

So what are the likely results of Brexit? He concludes,

The conclusion is that the reductions in migration resulting from Brexit are likely to have a significant adverse impact on UK productivity and GDP per capita. The broad scenarios (not forecasts) we depict imply that the negative impacts on per capita GDP will be significant, potentially approaching those resulting from reduced trade.  By contrast, the increase in low-skilled wages resulting from reduced migration is expected to be, if at all, relatively modest.

Pew Research Center: Political Polarization from 1994-2017

According to Pew Research Center’s surveys, here is how the general public divided along partisan lines in 1994, 2004, 2014, and 2017.

The FB page Unbiased America has a post animating the changes with this summary image:

And with the following description (in part):

A common criticism from both parties has been that the other has become radicalized. Listen to just about any campaign speech and you’ll hear the time-tested demagoguery about how the opposition party is no longer moderate, but instead espouses views from the extreme. So I decided to see whether that’s actually the case.

The Pew Research Center does a poll asking Americans about their beliefs on a variety of issues. When plotted on a graph and then animated to show how ideologies have shifted over time, an eye-opening picture emerges. Since 1994, Republicans are only about 8% more conservative in their beliefs. Democrats, meanwhile, are fully 60% more liberal, with the median Democrat now closer to the far left than the center.

It wasn’t always this way. In 1994, the median Democrat was a centrist, holding views that were 50% traditionally liberal, and 50% traditionally conservative. The median Republican was only about 10% more conservative than the median Democrat.

Since that time, Republicans shifted left, and were the centrist party in 2004, before drifting back to the right. Today they are just slightly more conservative than in 1994.

Democrats, meanwhile, continue to move left, with the biggest surge coming between 2011 and 2017.

It’s interesting to see how everyone seemed to move left from 1994-2004, followed by the Democrats running in that direction and the Republicans walking it back. I wonder if the party with the President in office tends to shift less while the opposition party tends to react. It would be nice to have more timepoints to see (1996, 2000, 2008, 2012). Even if that were the case, though, it doesn’t look like the shifts cancel each other out as the Oval Office goes from one party to another; instead it looks as if the public is getting more polarized over time.

And as a quick aside, I’m not clear on why the Source info includes a survey from 2015 but the data is labeled 2014 instead.

Simonian Economics

Image result for julian simon

A few years ago, I had a post about the Simon-Ehrlich wager in which economist Julian Simon won his bet against professional fearmonger Paul Ehrlich (who still won’t shut up). The evidence continues to mount that Simon was correct. Recently GMU economist Bryan Caplan reported on his own Simonian bet with Tyler Cowen and David Balan. “In July of 2008,” he writes, “the average U.S. price of regular gasoline was $4.062.” He bet “$100, even odds, that the U.S. price of gas (including taxes) in the first week of January, 2018 will be $3.00 or less in 2008 dollars.”

A subsequent clarification specified that the bet was on the price of regular gasoline.

Today, the January CPI arrived, allowing us to finally resolve this ten-year bet.  In 2008, the US CPI stood at 215.3.  In the third quarter of 2017, it hit 244.7.  Since then, there has been further inflation of 0.3%, bringing us to 245.3, for a grand total of 13.9% inflation during this period.  For me to win, then, the average price of regular gasoline in January 2017 must be less than $3.417.

So where are we now?  In January of 2018, the average price was a mere $2.555.  I have therefore won this bet by a margin of over 25%.  (Indeed, even if we count all gasoline, the average price is only $2.671).  I would have prevailed if there’d been 0% inflation – or as much as 14% cumulative deflation.

…For as long as we’ve had data, gas prices have shown frequent spikes, followed by gradual declines back to long-run trend.  So when prices spiked to over $4.00, I expected the past to repeat itself.  And repeat itself it did.

I expect that Tyler will insist that I just got lucky.  And if I lost roughly half my bets, that would be a wise reaction.  However, this latest victory brings my betting record to 17 wins and 0 losses.  Yes, pride goeth before the fall.  There’s at least one outstanding bet that I now expect to lose.  Still, the only reasonable explanation for my 17-and-0 record is that my judgment is exceptionally good.

As always, my opponents have my respect – and deserve yours.  They stuck out their necks and made clear claims.  If every pundit would do the same, this would be a far better – and far quieter – world.