Public Ignorance on Corporate Profits

Numerous studies over the years have demonstrated how ignorant the general public is regarding political matters.[ref]See Ilya Somin, Democracy and Political Ignorance: Why Smaller Government Is Smarter, 2nd ed. (Stanford, CA: Stanford University Press, 2016); Bryan Caplan, The Myth of the Rational Voter: Why Democracies Choose Bad Policies (Princeton, NJ: Princeton University Press, 2007); Christopher H. Achen, Larry M. Bartels, Democracy for Realists: Why Elections Do Not Produce Responsive Government (Princeton, NJ: Princeton University Press, 2016); Jason Brennan, Against Democracy (Princeton, NJ: Princeton University Press, 2016), Ch. 2: “Ignorant, Irrational, Misinformed Nationalists.”[/ref] This systemic ignorance and misinformation in turn warps the public’s policy preferences. AEI’s Mark Perry points out another example of public ignorance: corporate profits. He writes,

When a random sample of American adults were asked the question “Just a rough guess, what percent profit on each dollar of sales do you think the average company makes after taxes?” for the Reason-Rupe poll in May 2013, the average response was 36%! That response was very close to historical results from the polling organization ORC International polls for a slightly different, but related question: What percent profit on each dollar of sales do you think the average manufacturer makes after taxes? Responses to that question in 9 different polls between 1971 and 1987 ranged from 28% to 37% and averaged 31.6%.

How do the public’s estimates of corporate profit margins compare to reality? Not surprisingly they are off by a huge margin. According to this NYU Stern database for more than 7,000 US companies (updated in January 2018) in many different industries, the average profit margin is 7.9% for all companies and 6.9% for more than 6,000 companies excluding financials…Interestingly, for nearly 100 industries analyzed by NYU Stern, there’s only one industry that had a profit margin as high as 36% – and that was tobacco at 43.3%. The next highest profit margin was 26.4% for financial services, but more than 72% of industry profit margins were single-digits and the median industry profit margin is 6%. 

“Big Oil” companies make a lot of profits, right? Well, that industry (Integrated Oil/Gas) had a below-average profit margin of 5.6% in the most recent period analyzed, and separately, the Production and Exploration Oil/Gas industry is losing money, reflected in a -6.6% profit margin. For the general retail sector, the average profit margin is only 2.3% and for the grocery and food retail industry, it’s even lower at only 1.6%. And evil Walmart only made a 2.1% profit margin in 2017 (first three quarters) which is less than the industry average for general retail, possibly because grocery sales now make up more than half of Walmart’s revenue and profit margins are lower on food than general retail. Interestingly, Walmart’s profit margin of 2.1% is actually less than one-third of the 6.5% the average state/local government takes of each dollar of Walmart’s retail sales for sales taxes. Think about it – for every $100 in sales for Walmart, the state/local governments get an average of $6.50 in sales taxes (and as much as $10.12 in Louisiana and $9.45 in Tennessee, see data here), while Walmart gets only $2.10 in after-tax profits!

Perry concludes, “The public’s complete overestimation of how much companies earn in profits as a share of sales explains a lot…The general public that believes in the fantasy-world of unrealistically, sky-high 36% profit margins would naturally think companies are just being greedy and stingy when they don’t pay higher “living wages” and have to be forced to do so through minimum wage legislation. If the average person could realize that a 36% profit margin isn’t even close to reality and that the typical, median firm has a profit margin of only less than 8% or almost 30 percentage points below what the public thinks is a normal profit margin, then hopefully the average person would become a little more realistic about how the business world operates. Companies aren’t being stingy when they pay competitive wages, they’re just trying to survive on what are sometimes razor-thin profit margins, in a competitive environment where there’s not a large margin of error.”[ref]Perry also has a great post and WSJ article about CEO pay.[/ref]

What Motivates Support for Redistribution?

When it comes to the motivations behind redistribution, it turns out that fairness has little to do with it. Instead, researchers find[ref]Full access here.[/ref] that compassion, envy, and self-interest are the main drivers. From the abstract:

Why do people support economic redistribution? Hypotheses include inequity aversion, a moral sense that inequality is intrinsically unfair, and cultural explanations such as exposure to and assimilation of culturally transmitted ideologies. However, humans have been interacting with worse-off and better-off individuals over evolutionary time, and our motivational systems may have been naturally selected to navigate the opportunities and challenges posed by such recurrent interactions. We hypothesize that modern redistribution is perceived as an ancestral scene involving three notional players: the needy other, the better-off other, and the actor herself. We explore how three motivational systems—compassion, self-interest, and envy—guide responses to the needy other and the better-off other, and how they pattern responses to redistribution. Data from the United States, the United Kingdom, India, and Israel support this model. Endorsement of redistribution is independently predicted by dispositional compassion, dispositional envy, and the expectation of personal gain from redistribution. By contrast, a taste for fairness, in the sense of (i) universality in the application of laws and standards, or (ii) low variance in group-level payoffs, fails to predict attitudes about redistribution.

Let’s dive into the details:

We conducted 13 studies with 6,024 participants in four countries to test the hypothesis that compassion, envy, and self-interest jointly predict support for redistribution. Participants completed instruments measuring their (i) support for redistribution; (ii) dispositional compassion; (iii) dispositional envy; (iv) expected personal gain or loss from redistribution (our measure of self-interest); (v) political party identification; (vi) aid given personally to the poor; (vii) wealthy-harming preferences; (viii) endorsement of procedural fairness; (ix) endorsement of distributional fairness; (x) age; (xi) gender; and (xii) socioeconomic status (SES) (pg. 8422).

The results?:

Image result for greed fullmetal alchemistTo test this prediction, we regressed participants’ support for redistribution simultaneously on their dispositional compassion, their dispositional envy, and their expected personal gain (or loss) from redistribution. As predicted, the three motives have positive, significant, and independent effects on support for redistribution. This is true in the four countries tested: the United States (US) (study 1a), India (IN) (study 1b), the United Kingdom (GB) (study 1c), and Israel (IL) (study 1d)—standardized regression coefficients (β values): compassion, 0.28–0.39; envy, 0.10–0.14; self-interest, 0.18–0.30. Jointly, these motives account for 13–28% of the variance in support for redistribution. Adding to the regression models age and gender, or age, gender, and S[ocio]E[conomic]S[tatus], does not appreciably alter the effect of the emotion/motivation triplet, or the total variance accounted for. We note that age did not have significant effects in any country. Gender had significant effects in the United States and the United Kingdom (females more opposed to redistribution), but not in India or Israel. SES had a significant (negative) effect in the United Kingdom, but not in the other countries (Ibid.).

Unsurprisingly, in the U.S. “self-described Democrats endorsed redistribution to a greater extent than Republicans and Libertarians did. Democrats also reported more compassion and more expected personal gain from redistribution than Republicans and Libertarians did; envy did not differ by party” (Ibid.). Interestingly enough, “dispositional compassion was the only reliable predictor of giving aid to the poor” in all four countries. However, “support for government redistribution was not a unique predictor of personally aiding the poor in the regressions…Support for government redistribution is not aiding the needy writ large—in the United States, data from the General Social Survey indicate that support for redistribution is associated with lower charitable contributions to religious and nonreligious causes” (Ibid.).

Image result for compassion fullmetal alchemist
Compassion

Now consider these absurd answers from the survey respondents:

Related imageParticipants in the United States, India, and the United Kingdom (studies 1a–c) were given two hypothetical scenarios and asked to indicate their preferred one. In one scenario, the wealthy pay an additional 10% in taxes, and the poor receive an additional sum of money. In the other scenario, the wealthy pay an additional 50% in taxes (i.e., a tax increment five times greater than in the first scenario), and the poor receive (only) one-half the additional amount that they receive in the first scenario. That is, higher taxes paid by the wealthy yielded relatively less money for the poor, and vice versa (63). To clarify the rationale for this trade-off, we told participants that the wealthy earned more when tax rates were low, thereby generating more tax revenue that could be used to help the poor. Fourteen percent to 18% of the American, Indian, and British participants indicated a preference for the scenario featuring a higher tax rate for the wealthy even though it produced less money to help the poor…We regressed this wealthy-harming preference simultaneously on support for redistribution, the emotion/motivation triplet, age, gender, and SES. Dispositional envy was the only reliable predictor (Ibid.).
In short, “Compassion and envy motivate the attainment of different ends. Compassion, but not envy, predicts personally helping the poor. Envy, but not compassion, predicts a desire to tax the wealthy even when that costs the poor” (Ibid.). The cries for fairness, though, have little to do with support for redistribution:

To sum up the set of fairness studies, in predicting support for redistribution, the effect of fairness as a group-wide concern is unreliable and of far smaller magnitude than the effect of the emotion/motivation triplet. This is true whether fairness is operationalized as uniformity in the application of laws and standards or as low (or null) variance in payoffs; whether distributional fairness is assayed between individuals (studies 2a, 2c, S1a, S2a, S2b) or between groups (“the rich,” “the poor”; studies 2b, S1b, S2c, S2d); and whether allocational decisions are hypothetical (studies 2a, 2b, S1a, S1b, S2c, S2d) or consequential (studies 2c, S2a, S2b) (pg. 8423).

So, why do people support redistribution?

  1. They care about the poor and want to help them (Compassion).
  2. They hate the rich (Envy).
  3. They expect to gain from redistribution (Greed).

Sounds about right.

Corporations, People, and Taxes

I was reviewing some old blog posts and such and came across the following. Remember this beautiful exchange?


Awww, yes. The “evil corporations” trope, i.e. the “confusion between abstract categories and flesh-and-blood human beings.”[ref]Thomas Sowell, Economic Facts and Fallacies, 2nd ed. (New York: Basic Books, 2011), 153.[/ref] Explaining the fallacious nature of this thinking, Thomas Sowell writes,

Abstract people can be aggregated into statistical categories such as households, families, and income brackets, without the slightest concern for whether those statistical categories contain similar people, or even the same number of people, or people who differ substantially in age, much less in such finer distinctions as whether or not they are working or whether they are the same people in the same categories over time. Abstract people have an immortality which flesh-and-blood people have yet to achieve.[ref]Thomas Sowell, Intellectuals and Society (New York: Basic Books, 2009), 112-113.[/ref]

What Romney’s hecklers (affiliates of Iowa Citizens for Community Improvement) and critics seem to have missed is the abstract nature of “greedy corporations.” The rhetoric invoked by these individuals often describes corporations as quasi-personal, transcendent entities that exist above and beyond flesh-and-blood people. As one writer notes, “Romney doesn’t mean that corporations are entitled to some of the legal rights of people in the Citizens United sense. He means it in the sense that the money made by corporations flows in and out of human hands—or pockets, in the language of the heckler who hoisted himself on his own metaphorical petard.” The abstractions of “corporations” and “the rich” are frequently linked, if not synonymous. Yet, empirical evidence suggests that corporate taxes negatively impact actual people. And not the rich ones you would hope for.[ref]See Matthew H. Jensen, Aparna Mathur, “Corporate Tax Burden on Labor: Theory and Evidence,” Tax Notes (June 6, 2011) for a nice rundown of the literature.[/ref]

A 2010 working paper explored international tax rates and manufacturing wages across 65 countries over 25 years. It suggests that a 1 percent increase in corporate tax rates decreases wage rates by 0.5-0.6 percent. “These results also hold for effective marginal and average tax rates” (pg. 22). A 2012 study[ref]Ungated working paper version here.[/ref] looked at over 55,000 companies in 9 European countries between 1996 and 2003. It found that every $1 increase in tax liability leads to a $0.49 decline in wages. This suggests that about 50% of the increased tax burden is passed on to the labor force over the long run. A 2007 Kansas City Fed working paper used cross-country data between 1979 and 2002 to find that a 1 percentage point increase in the average corporate tax rate led to a 0.7% decrease in annual gross wages; a decrease that was more than 4 times the amount of the corporate tax revenue collected. Furthermore, the “burden of the corporate tax on wages is shared equally across skill-level, suggesting that the corporate tax may not be as progressive as many politicians assume. Also, as the economy becomes more global, raising the corporate tax may result in lower than predicted corporate revenue increases due to the ability of firms to avoid taxes more effectively” (pg. 22). Another 2007 paper looked at a panel of U.S. multinationals across 50 countries over a 15-year period. The authors found that 45-75% of the corporate tax is shouldered by labor, with the rest falling on capital. Similarly, a 2013 study finds that a $1 increase in corporate tax liability leads to decreases in wages by about $0.60. The authors conclude,

Our findings suggest that labor shares a significant part of the burden of corporate income taxes. A direct calculation of the mean marginal effect of the corporate income tax from our estimates suggests that a 10 percent increase in the tax rate would decrease the average wage rate by 0.28–0.38 percent. Labor shares at least 42 percent of the burden of the corporate tax and possibly more. The average labor share of the corporate tax burden is around 60–80 percent (pg. 233).

A 2016 study[ref]Earlier, ungated version here.[/ref] of state corporate tax rates concluded that 25-30% fell on landowners and 30-35% fell on workers. A 2016 paper for the Federal Reserve looked at 131 tax increases and 140 tax cuts across 45 states going back to 1969. It found that “a one percentage-point increase in the top marginal corporate income tax rate reduces employment by between 0.3% and 0.5% and income by between 0.3% and 0.6%, measured relative to neighboring counties on the other side of the state border. These estimates are remarkably stable: they remain essentially unchanged regardless of local characteristics such as the flexibility of local labor markets, income levels, population density, or the prevalence of small businesses in a county. They are also stable across the business cycle and little changed when we control for localized industry-level shocks by comparing employment and income in bordering counties within the same industry” (pg. 3). A 2009 study by economist Robert Carroll found that across state lines “a one percent drop in the average tax rate leads to a 0.014 percent rise in real wages five years later.” In other words, wages rise $2.50 for every dollar reduction in the state-local corporate income taxes. The opposite also occurs: every dollar increase in tax rates leads to a $2.50 loss in wages. Drawing on recent research, Carroll suggests that “the least mobile factor of production is likely to bear the burden of a tax. In an increasingly global economy, labor is the least mobile because capital can flow freely across borders…When workers have more capital to work with, their labor productivity and wages will rise” (pg. 1). An abstraction is unable to pay its demanded “fair share” and instead places the economic burden on individuals. “After all, businesses are merely convenient ways of organizing economic activity,” writes Carroll, “so while businesses write checks to pay the corporate tax (and other taxes), the burden of those taxes falls ultimately on the individuals who depend on the corporations, in their roles as investors, workers, or consumers” (pg. 2). This is why Carroll finds numerous benefits to cutting corporate taxes, including higher long-term growth, higher wages and living standards, lowered tax burdens on low-income taxpayers and seniors, and boosted entrepreneurship, investment, and productivity.


The point of this review is to remind us that policy is complicated and often counterintuitive. We need to look at the empirical evidence. And if there isn’t much, perhaps we should wait until there is. The effects are real and they impact real people. The problem is that rarely will you achieve a utopian outcome. As I’m fond of saying, “There are no solutions; there are only trade-offs.”[ref]Sowell, The Vision of the Anointed: Self-Congratulation as a Basis for Social Policy(New York: Basic Books, 1995), 142.[/ref]

Would Raising Top Earners’ Income Tax Rates Decrease Wealth Inequality?

Probably not. Reporting on a 2016 study, RealClearScience explains,

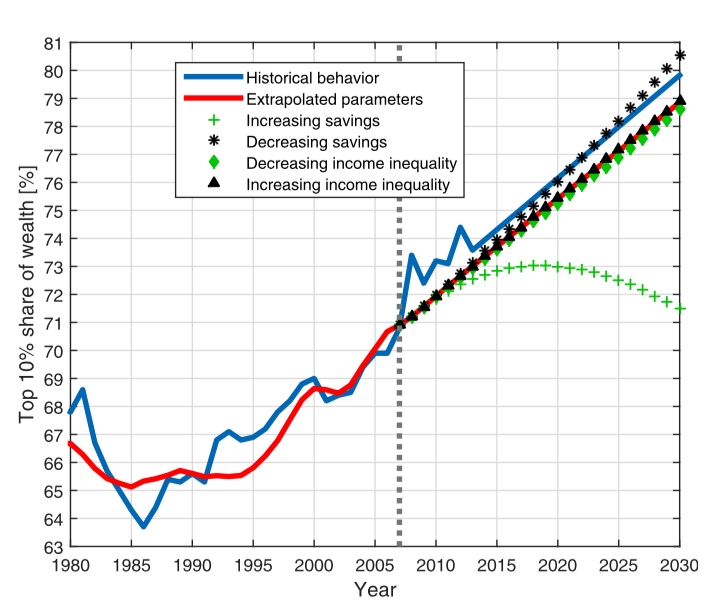
To distill the finding, a team of researchers based out of Tel-Aviv University first developed an algorithm to model wealth inequality in the United States between 1930 and 2010. Primarily based on income from wages, income from wealth (profits, rents, dividends, etc.), and changes in capital value (property, shares, etc.) the resulting model correlated closely (p=.96) with historical data on wealth inequality.

The researchers then used their model to predict the future. What would happen, they wondered, if income inequality was varied? In their model, income inequality was tied to a metric called the Gini index, a statistical measure of inequality used for decades. They found that altering income inequality to a Gini index of 0.1 (very low inequality) resulted in the top 10% controlling 78.6% of wealth in 2030, while raising income inequality to a Gini index of 0.9 (very high inequality) resulted in the top 10% controlling 79.3% of wealth in 2030, hardly a significant difference.

The article continues,

According to the researchers, the lack of effect isn’t actually surprising.

“When income tax is increased, the top earners, who are not necessarily the wealthiest individuals in the population, have a larger difficulty of accumulating wealth, with respect to the wealthiest. On the other hand, it barely affects the wealthiest individuals. Therefore, such an increase might even deepen the wealth gap.”

“Progressive taxation, which might have a significant effect on the distribution of income, will have a small effect on wealth inequality,” they add.

The team behind the current study is not the only group to return such a result. Just last year, experts at the Brookings Institute created their own model and found that increasing the top tax rate from 39.6% to 50% wouldn’t even dent income inequality, let alone wealth inequality.

Fixed-Pie Fallacies and Tax Loopholes

Closing tax “loopholes” has been a major talking point of both presidential candidates as of late. But this kind of language distorts the conversation from the get go. As columnist David Harsanyi explains,

Basically, all of life is a giant loophole until [politicians] come up with a way to regulate or tax it. In its economic usage, “loophole”—probably more of a dysphemism—creates the false impression that people are getting away with breaking the law. It’s a way to skip the entire debate portion of the conversation and get right to the accusation.

So when Hillary Clinton promises to close the loophole of corporate inversion, what she means to say is that Democrats disapprove of this completely legal thing that corporations do to shield their money from the highest corporate tax rate in the developed world. Loopholes are like giveaways, monies that D.C. has yet to double and triple tax.

…But Bernie Sanders, bless him, just skips the entire perception game and just comes out with it by tweeting: “The offshore tax haven network isn’t something that we need to reform or refine. It’s a form of legalized tax fraud that must end.”

“Legalized tax fraud” is a revealing statement about the progressive belief system. For progressives, taxation is moral. So when you fail to pay an imaginary tax that doesn’t exist but Democrats think should, you are by default engaged in fraud. The law has just to catch up with sin.

Megan McArdle has lamented the “regrettable tendency” of legislators “to view their citizens, and particularly their corporate citizens, as a species of tax cattle.” She points out that the first-time-homebuyer tax credit is morally no different than tax-exempt municipal bonds or your 401(k). She points out that if we were to, say, get rid of tax-free bonds, “[i]t would be more expensive for local governments to borrow money. Rich people are paying for that tax benefit by accepting a lower interest rate on municipal bonds than they would if they had to pay taxes on that money. The net effect is a federal subsidy for local spending. If we remove the deduction, local governments will find their budgets pinched[.]” She also points to charitable deductions and corporate tax rate shopping at the local and international level. “Unless,” she writes, “you want the kind of government enjoyed by the majority of the people of the world — and to ship most of your money to those places, while getting little in return — then stop complaining that other countries exist, and that their existence makes it hard to keep the local tax cattle properly penned in.”

When groups like Americans for Tax Fairness complain about tax “loopholes” and demand that we should “end tax breaks for corporations that ship jobs and profits offshore,” they are ignoring the points above as well as the following evidence. Harvard’s Mihir Desai has done extensive work on this subject. “When American firms grow abroad,” he writes in The Wall Street Journal,

Image result for fixed pie economicsthey also grow domestically, as demonstrated by research I conducted with C. Fritz Foley of Harvard and James R. Hines Jr. of the University of Michigan (published in the American Economic Journal: Economic Policy, 2009).

The data do not support the crude, fixed-pie intuition that firms either invest abroad or at home. Ten percent growth in American firms’ foreign investment is associated with 3% growth in their domestic investment. And when firms grow abroad, their domestic exports and R&D activities grow especially…Vilifying or penalizing American businesses for their global operations will only lead them to consider leaving the U.S.—or consider being bought by foreign companies. Such moves would hurt America by removing valuable headquarter jobs.

The fixed-pie fallacy breeds protectionism. And protectionism manifests itself in many forms.

Paying Their Fair Share

Making “the rich” pay their “fair share” has been a talking point for some time and became a bit of a slogan during the presidential race. Drawing on the Congressional Budget Office’s most recent report, the Tax Foundation posts,

One of the main takeaways from this year’s report is that the richest Americans pay a lot in taxes. In 2013, the top 1 percent of households paid an average of 34.0 percent of their income in federal taxes. To compare, the middle 20 percent of households paid only 12.8 percent of their income in taxes.

Moreover, taxes on the rich are much higher than they’ve been in recent years. Between 2008 and 2012, the top 1 percent of households paid an average tax rate of 28.8 percent. However, in 2013, this figure spiked to 34.0 percent, as a result of tax increases in the “fiscal cliff” deal and the Affordable Care Act.

We’ve known for a while that taxes rose on the rich in 2013, but the new CBO report puts in perspective exactly how high taxes on the rich are now, compared to the last three decades. For instance, in 2013, the top 1 percent of taxpayers paid a higher tax rate (34.0 percent) than in the year President Reagan took office (33.2 percent).

According to the CBO, the federal tax system is now “the most progressive it has been since at least the mid-1990s.” Writing in The Atlantic, Derek Thompson notes that “the government is doing more to fight inequality right now than any year on record.”

Economist Mark Perry provides additional insights (as he has in the past) to the CBO report. For example,

  • The bottom three income quintiles are net recipient households, meaning they receive more in transfer payments than they pay in federal taxes. The top two could be designated as net payer households. The top income quintile in particular “finance[s] almost 100% of the transfer payments to the bottom 60%, as well as almost 100% of the tax revenue collected to run the federal government.”

  • The bottom three quintiles receive “more than $1 in government transfer payments for every $1 paid in federal taxes in 2013. The fourth quintile consists of minor net payer households, receiving “slightly less than a dollar in transfer payments on average ($0.85) for every $1 paid in federal taxes. In contrast, “net payer households” in the top income quintile received only $0.17 in government transfer payments per $1 paid in federal taxes in 2013.”


  • “Adjusting for government transfers received, the light blue bars in the chart are calculated by dividing “Federal taxes paid minus government transfers received” (row 6 in the table) into Before-Tax Income (row 3), and show average federal tax rates by income quintile after government transfers. For example, the average “net recipient household” in the lowest income quintile received a “negative tax” payment of $8,800 in 2013, had an average before-tax income of $25,400, for a negative federal tax rate of 35%…This further demonstrates that after transfer payments, Americans in the bottom 60% by income are “net recipient households” with negative federal income tax rates, while only households in the top two “net payer” income quintiles had positive federal income tax rates after transfers in 2013.”

Perry concludes,

The CBO study released [in June] provides ample evidence that the richest Americans are paying their “fair share” of federal taxes. In fact, the richest 20% of Americans by income aren’t just paying a share of federal taxes that would be considered “fair” – it goes way beyond “fair” – they’re shouldering almost 100% of the entire federal tax burden of transfer payments and all other non-financed government spending.

…It’s also important to note here that the US has the most progressive federal tax system among all OECD-24 countries, see Tax Foundation president Scott Hodge’s article “No Country Leans on Upper-Income Households as Much as the US.” Specifically, the top 10% of American households pay 45.1% of all income taxes (both personal income and payroll taxes combined), which is the highest tax share for that group in any of the OECD-24 countries and far above the 31.6% average for the tax burden of the top income decile. Accounting for the income share of the top income decile, the US also has the highest ratio of the income tax share of the top 10% (45.1%) to the total income share of that group (33.5%) of 1.35 times, compared to the OECD average ratio of only 1.11.[ref]You can see more commentary on the CBO report in Scott Winship’s Forbes article.[/ref]

Other People’s Money: Millennials and Socialism

Friedman

There’s been one underlying basic fallacy in this whole set of social security and welfare measures, and that is the fallacy – this is at the bottom of it – the fallacy that it is feasible and possible to do good with other people’s money. That view has two flaws. If I want to do good with other people’s money, I first have to take it away from them. That means that the welfare state philosophy of doing good with other people’s money, at it’s very bottom, is a philosophy of violence and coercion. It’s against freedom, because I have to use force to get the money. In the second place, very few people spend other people’s money as carefully as they spend their own. – Milton Friedman


A recent article in The Washington Post looks at the love affair between Millennials, Bernie Sanders, and the polarizing term “socialism.” The Cato Institute’s Emily Ekins explains,

Millennials are the only age group in America in which a majority views socialism favorably. A national Reason-Rupe survey found that 53 percent of Americans under 30 have a favorable view of socialism compared with less than a third of those over 30. Moreover, Gallup has found that an astounding 69 percent of millennials say they’d be willing to vote for a “socialist” candidate for president — among their parents’ generation, only a third would do so. Indeed, national polls and exit polls reveal about 70 to 80 percent of young Democrats are casting their ballots for presidential candidate Bernie Sanders, who calls himself a “democratic socialist.”

Ekins makes a couple of important observations:

  • “[M]illennials tend to reject the actual definition of socialism…”[ref]Italics mine.[/ref]
  • Countries like “Denmark aren’t socialist states (as the Danish prime minster has taken great pains to emphasize)…” In fact, Denmark “outranks the United States on a number of economic freedom measures such as less business regulation and lower corporate tax rates…”[ref]Will Wilkinson relies on the high amount of economic freedom in some of the Nordic countries to make a libertarian case for Bernie Sanders.[/ref]

But the real question is whether or not this youthful infatuation with socialistic policies will last. Ekins provides reasons to think not:

There is some evidence that this generation’s views on activist government will stick. However, there is more reason to expect that support for their Scandinavian version of socialism may wither as they age, make more money and pay more in taxes. The expanded social welfare state Sanders thinks the United States should adopt requires everyday people to pay considerably more in taxes. Yet millennials become averse to social welfare spending if they foot the bill. As they reach the threshold of earning $40,000 to $60,000 a year, the majority of millennials come to oppose income redistribution, including raising taxes to increase financial assistance to the poor. Similarly, a Reason-Rupe poll found that while millennials still on their parents’ health-insurance policies supported the idea of paying higher premiums to help cover the uninsured (57 percent), support flipped among millennials paying for their own health insurance with 59 percent opposed to higher premiums. When tax rates are not explicit, millennials say they’d prefer larger government offering more services (54 percent) to smaller government offering fewer services (43 percent). However when larger government offering more services is described as requiring high taxes, support flips and 57 percent of millennials opt for smaller government with fewer services and low taxes, while 41 percent prefer large government.

If previous generations are any indication (“both baby boomers and Gen Xers grew more skeptical of government over time”), the Millennial approval of big government may dwindle when they start having to pay for the programs they advocate. But an even greater takeaway–in connection with the notion that the world is getting better–is that “college students today are not debating whether we should adopt the Soviet or Maoist command-and-control regimes that devastated economies and killed millions. Instead, the debate today is about whether the social welfare model in Scandinavia (which is essentially a “beta-test,” because it hasn’t been around long) is sustainable and transferable.” In other words, “in the 20th-century battle between free enterprise and socialism, free enterprise already won.”

Is the US Tax System Really Progressive?

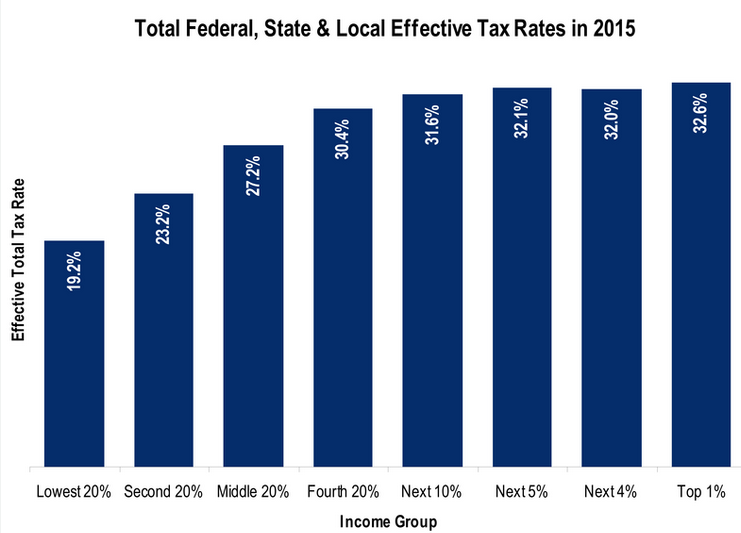
One of the things I learned in grad school is that figuring out how much people pay in taxes can be really, really complicated. The first complication is that you have to consider not just the federal taxes, but also state and local taxes. That’s actually not too bad. What gets a lot trickier, however, is if you actually try to figure out effective taxes. Sure, it’s easy to look up the tax rates by income bracket, but that doesn’t account for things like the mortgage interest deduction. So it’s kind of an open question, are the effective taxes in the US (including state and local as well as federal) progressive? Or do the benefits at the top (like mortgage interest deduction) and the penalties at the bottom (like cigarette taxes) combine to overwhelm the statutory progressivity of the tax brackets?

Dylan Matthews at Vox has the answer:

885 - Effective Tax Rates

So yeah, they’re progressive, but not as progressive as you’d expect them to be. Here’s what economist Miles Kimball had to say:

This is a very nice chart showing that taxes overall are remarkably close to proportional. One of the things that suggests to me is that a much simpler tax system that had people paying a proportional tax such as a VAT tax, coupled with a lump-sum transfer to the poor, would not be such a big change after all. We probably cause a lot of distortions by pretending to have a progressive tax system instead of admitting that we have a mostly proportional tax system and optimizing it.

Amen. There are much, much simpler (and therefore cheaper and healthier) ways to get to where we’re at.

I will add one caveat, however. When you’re figuring out how much people pay in taxes, it’s probably also worth trying to determine how much they receive in direct government benefits. If someone pays 20% of their income in taxes but then receives food stamps worth 20% of their income, isn’t their net contribution zero? From my experience, if you do this analysis then initially you get a much, much more progressive system, but you also get a much, much trickier problem. A lot of the benefits to the wealthy are harder to track than direct government expenditures. What’s the benefit, for example, of friendly zoning laws that artificially inflate land prices and thus benefit the upper class?


Taxing Inventors Out of the Country

New research reveals that high taxes may (unsurprisingly) deter inventors from remaining in a country. The authors summarize their findings:

There has is a strong and significant correlation between top tax rates and those inventors who remain in their home countries. The relation is strongest for superstar inventors…The elasticities imply that for a ten percentage point reduction of top tax rates from 50% to 40%, a country would be able to retain on average 3.3% more of its top 1% superstar inventors. This relation weakens as one moves down the quality distribution of inventors – the top 25-50% or the bottom 50% of inventors are no longer sensitive to top tax rates.

…The recent evidence suggests that labour, like capital, might be internationally mobile and respond to tax incentives. The loss of highly skilled agents such as inventors might entail significant economic costs, not just in terms of tax revenues lost but also in terms of reduced positive spillovers from inventors and, ultimately, less innovation in a country.

Food for thought.

Our Immoral and Unconstitutional Tax System

937 - Taxes

It’s no secret that our complicated, burdensome tax system is hugely wasteful. According to a 2013 study from the Mercatus Center at George Mason University:

There were 4,428 changes to the Internal Revenue Code between 2001 and 2010, including an estimated 579 changes in 2010 alone. The tax code averages more than one change per day. The resulting complexity creates hidden compliance costs between $215 billion and $987 billion annually. To put this in perspective, total revenue collected by the federal government in 2012 was $2.5 trillion.

That’s bad enough, but a new article got me thinking about this issue in a different light. In The Income Tax is Immoral and Unconstitutional – and Not (Just) for the Reason You Think, Robin Koerner points out that the $2,000 he had to shell out to his accountant in order to generate 149 pages of tax documentation for his simple, small private business[ref]Koerner has no employees and the business revenue is small enough that he qualifies for major income-based subsidies[/ref] constitute a highly regressive tax burden. That’s the immorality of the tax code. The unconstitutionality, in Koerner’s view, comes from the fact that there is no practical way that a private US citizen is capable of filling out their taxes. Thus:

Finally, and most importantly – to any Constitutional attorney: I can’t pay you (see above), but I have a tax return that will make your eyes bleed. Get me in front of a jury or, better yet, the Supreme Court, and let us ask 12 or nine reasonable people if the burden of completing this particular tax return – a requirement I must meet to retain my liberty and my property – is reasonable or not. And if just one of the jury or bench believes that a reasonably educated person could accurately complete my tax return in a reasonable period, I’ll be happily defeated – as long as he shows me how.

Koerner is right. The American system of taxation is so monumentally and colossally stupid that no person could deliberately have concocted a scheme this awful. So why does it continue? Several reasons. Inertia is a big one. The fact that any attempt to reform gets mired in partisan gridlock is another. And then there’s the fact that the most sophisticated players in the world like it this way. It gives competitive advantages to large companies who can afford the expertise to fully leverage the tax code to their advantage, and also gives politicians one of their most prized trade goods to offer to backers in return for their support.

Oh, and Koerner isn’t kidding about the complexity. Last year, three different accountants tried to do my family’s taxes. All three failed to get them done correctly. When three different professional accounting firms can’t figure out how to pay your taxes for you, then you know the system has become a joke. Too bad it’s a joke that will have the severest repercussions for those least able to afford the punchline.