Immigrant Integration: European Edition

I’ve written before about how strict labor laws in Europe may be hindering immigrant integration. While I still think these may be barriers to integration, Europe is doing better than is often reported. As Tyler Cowen explains in Bloomberg,

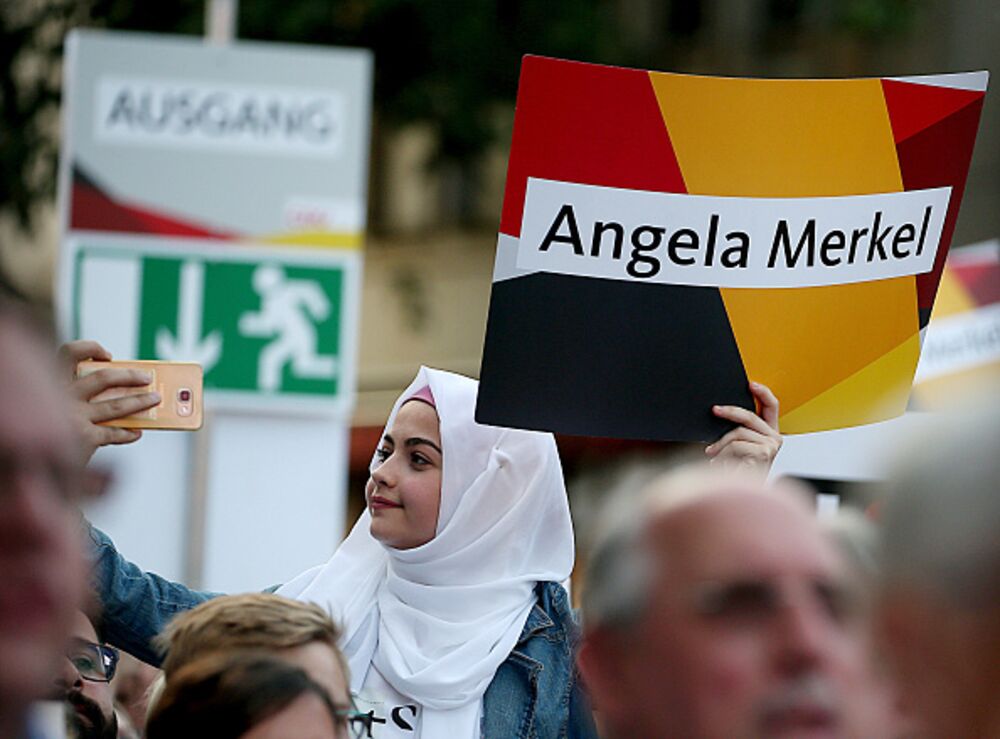
Debates over immigration are fraught with misconceptions. One of the most common is that the integration of Muslims into societies in Western Europe has gone very badly, in large part because terror attacks loom so large in the news. Those attacks are a very real problem, yet they do not reflect the typical reality. A new study from the Bertelsmann Stiftung in Germany shows that Muslim integration in Europe is in fact proceeding at a reasonable pace.

The survey included more than 1,000 Muslims in Germany and about 500 in Austria, France, Switzerland and the U.K. (both immigrants and children of immigrants were included, though not recent refugees). Although this is hardly the first study of its kind, the results offer considerable hope for societies facing integration challenges: The stereotype of an uneducated, unemployed, easily radicalized Muslim migrant does not fit the facts.

The first sign of integration is language skill. About three-quarters of the Muslims born in Germany report German as their first language; 46 percent of foreign-born Muslims do. Overall, language skills improve with each generation, and migrants seem to be resourceful in finding ways to learn an adopted country’s tongue. Muslims immigrants to France and the U.K. often arrive knowing the languages of their new countries.

Only about one in 10 French Muslims report leaving school before age 17; the American high school graduation rate for all attendees is lower, at 83 percent. In Germany, employment for Muslim immigrants is on a par with employment for non-Muslims, though Muslim wages are lower. The rate of unemployment for French Muslims is a disappointing 14 percent, but that looks less troubling when you consider that migrants are relatively young and French youth unemployment as a whole is about 25 percent. Labor market reforms and better economies can help integrate foreign migrants, and Europe is currently showing decent economic growth, again reasons for hope.

Nor do Muslims huddle in Muslim-only communities, apart from the broader population. Some 87 percent of Swiss Muslims report having frequent or very frequent social contact with non-Muslims. In both Germany and France that number is 78 percent, again a sign of assimilation. It is lower in the U.K. (68 percent) and Austria (62 percent), but even those figures show plenty of social intermingling. And migrants across countries report feeling a close connection to the countries they live in, from a high of 98 percent (Switzerland) to a low of 88 percent (Austria).  

Cowen continues,

The study also suggests that integration works better when the migrants are relatively numerous, perhaps because they can create mutual support services. But making that point is unlikely to win many European elections…The good news is that Western European integration of Muslims is further along than many people believe. The bad news is that the process of integration entails significant social change and change sometimes brings turmoil. The human race is improving at this broader challenge only slowly.

Father Loss at the Cellular Level

Image result for father sonPrinceton molecular biologist Daniel Notterman and colleagues published a new article in Pediatric titled “Father Loss and Child Telomere Length.” According to the IFS blog,

Research tells us that father loss is linked to a broad range of negative outcomes for children, including lower rates of high school and college graduation, a higher risk of delinquency, early sexual activity, teen pregnancy, and poor mental, physical, and emotional health. Yet despite the emerging science of fatherhood, in many ways, we are only beginning to understand the significance of the biological father connection to child well-being. New research indicates that the repercussions of losing a biological father—whether to death, divorce, or incarceration—go even deeper, affecting children at the cellular level.

Notterman explains these new findings in an interview with IFS:

Telomere length (TL) has been shown in many studies to be associated with chronic stress of diverse origins in both children and adults. We reasoned that separation or loss of a father would be a significantly stressful event in the life of a young child. If that were the case, we hypothesized that father loss would be associated with telomere attrition, and that turned out to be the case. We know that chronic stress is also associated with long-term adverse effects on health, including cardiovascular and behavioral health. Whether accelerated telomere attrition is just a biomarker of these subsequent health effects, or actually plays a causal role in producing these effects is not known at present, but it is the subject of intense laboratory and clinical study. In either case, by examining telomere length, we get an early window (by age 9 years in our study) into adverse health effects that may not be realized for many years.

…Father loss was conceptualized as being of one of three types: separation of the biologic father from the child’s mother, often due to the dissolution of their relationship; incarceration of the child’s father; and death of the father before the child was 9 years of age. In addition to the associations noted in the question, we also found evidence of genetic moderation. Due to the presence of specific gene variants (called, “alleles”) in a gene called “SERT,” which is known to affect how the brain processes serotonin, a key neurotransmitter, some children seem to be more sensitive to environmental stimuli such as loss of a parent. In our study, children bearing a sensitizing allele, or variant, or SERT are much more susceptible to telomere shortening. Thus, the magnitude of telomere shortening is affected not only by the loss of a father but also by the genetic endowment received from the parents.

The death of a father is “a more potent stress because it completely ends the relationship between father and child. With separation and incarceration, it is still possible for there to be contact between father and child. Fathers who are separated from the family often maintain contact with a biological child, and incarceration may be limited in time.” And while the effects of father loss were greater for boys than girls (possibly due to fahters providing “specific role-modeling to sons”), the “study was not specifically designed to answer this question.”

Income associated with the father is a major player in one form of father loss, but less in others:

We found that father loss due to the dissolution of the relationship with the child’s mother affects telomere length mainly by reducing family income. We conjecture that this is due to the stress engendered by material hardship (worsening poverty). Father loss due to incarceration or death seems to be a much more potent stress, such that the additional contribution of income loss is relatively small.

In summary,

We think that our findings reinforce the growing understanding of a father’s importance in the life of his children. We do not think that our data support a conclusion that one type of relationship between a child’s parents is more favorable than another; rather, we conclude that a central role for the father is optimal for his child’s well-being. Furthermore, we think that this knowledge should inform public policy in providing support to families and children where the father, for one reason or another, is absent from his children.


Opioid Use and the Labor Force

Image result for opioid prescription

According to a new Brookings paper by Princeton economist Alan Krueger, “The increase in opioid prescriptions from 1999 to 2015 could account for about 20 percent of the observed decline in men’s labor force participation (LFP) during that same period.” Other findings include:

  • Regional variation in opioid prescription rates across the U.S. is due in large part to differences in medical practices, rather than varying health conditions. Pain medication is more widely used in counties where health care professionals prescribe greater quantities of opioid medication, with a 10 percent increase in opioid prescriptions per capita is associated with a 2 percent increase in the share of individuals who report taking a pain medication on any given day. When accounting for individuals’ disability status, self-reported health, and demographic characteristics, the effect is cut roughly in half, but remains statistically significant.
  • Over the last 15 years, LFP fell more in counties where more opioids were prescribed. Krueger reaches this conclusion by linking 2015 county-level opioid prescription rates to individual level labor force data in 1999-2001 and 2014-16. For more on the relationship between prescription rates and labor force participation rate on the county-level, visit these maps.

Krueger also found that “nearly half of prime age men who are not in the labor force take pain medication on a daily basis, and that two-thirds of those men—or about 2 million—take prescription pain medication on a daily basis.” Furthermore, “two-thirds of men not in the labor force and taking pain medication used Medicaid, Medicare, or Veterans Affairs health insurance to purchase prescription pain medication, with the largest group relying on Medicaid.” In short, “Krueger’s analysis reinforces past research in finding that the overall decline in LFP since 2007 is primarily due to an aging population and ongoing trends that preceded the recession, for example increased school enrollment of young workers.”

Check it out.

Who Is More Socially Connected?

“Social capital,” according to the Greater Good Science Center,

refers to family and friends who support you through difficult times, as well as neighbors and coworkers who diversify your network and expose you to new ideas. While social capital originally referred to face-to-face interaction, it now also accounts for virtual interactions online such as email or on social media platforms like Facebook, Instagram, Twitter, and LinkedIn.

Social capital also includes the rewards these social connections yield, such as the feelings of bonding and belonging felt in close friendship, and the expanded worldview you might get from looser, broader connections. And these benefits trickle down to many parts of life; social capital is associated with happiness, better job prospects, cardiovascular health, and positive health-seeking behavior. Among seniors, social capital has been linked to physical mobility and tends to reduce cognitive decline.

Last year, GGSC put out a social capital quiz, asking “readers questions about how connected they feel to a larger community, whether they have someone to turn to in times of need, and how open and curious they are about new people, places, and things—both in-person and online. In reviewing the data, we calculated an overall social capital score, in-person social capital score, and online social capital score for each responder, and we looked at the trends among everyone who took the quiz.” Here’s what they found:

  • Young and old have less social capital than those in between.
  • Ethnicity did not affect social capital scores.
  • More education was linked to higher social capital.
  • People in big cities had higher social capital.
  • People on the West Coast had higher social capital.
  • Liberals might have more social capital than conservatives.

Check out the article for further details.


The Origins of Formal Segregation Laws

Image result for segregation

A new NBER paper looks at the decline in collective action promoting segregation and the rise of formal laws enforcing it. From the ungated version:

The goal of the analysis is to identify which of the two channels (i.e., increases in black housing demand and/or reductions in white vigilante activity) actually drove demand for passage of municipal segregation ordinances. Although our data and estimating strategies are limited, the patterns we observe are consistent with the predictions of the model, though the evidence for the vigilante channel is stronger than for the housing demand channel. In particular, whether we use city-level or ward-level data, we find only mixed evidence that demand for segregation ordinances is strongest in areas with the fastest growing black populations.

By contrast, we find relatively strong and robust evidence for the second channel involving white vigilante activity. Across a variety of model specifications and different measures of white vigilante activity, it is clear that in the cities where whites were able to police color lines and punish deviations through private channels, there was relatively little demand for segregation ordinances. For example, the data show that in cities located in counties with high lynching rates (a direct indicator of the ability of whites to organize privately to punish blacks for violating established racial norms) the probability of passing a segregation ordinance is significantly lower than in places with low lynching rates. Similarly, cities that possessed a robust volunteer fire department (an alternative measure of the ability to provide public goods through private channels) are significant less likely to pass a segregation ordinance. We supplement our city-level analysis with ward level data from St. Louis. With the ward-level data from St. Louis, we can identity which wards were the strongest supporters of the city’s segregation ordinance. The patterns observed in St. Louis suggest that support for the city’s segregation ordinance was strongest in the wards where it was difficult for white communities to coordinate private vigilante activity (pg. 4-5).

The authors conclude,

The existing literature on the origins of municipal segregation ordinances argues that segregation ordinances were passed largely because of rapidly growing black populations in urban areas and variation in the intensity anti-black preferences across cities. Our results suggest the existing literature needs to be revised. While there is evidence that growing black populations might have played a role in the propagation of segregation ordinances, the results here suggest that a decline in the ability of whites to provide a local public good (i.e. segregation) through private vigilante activity was especially important. In particular, the negative coefficient on lynching and the positive coefficients on white population growth are consistent with the hypothesis that segregation ordinances were passed in those cities where it was becoming increasingly difficult for whites to organize and punish blacks for violating established color lines in residential housing markets.

More generally, the model developed and tested here has broad implications for our understanding of residential segregation the processes that give rise to it. Of particular interest is the exploration of how market processes such as tipping interact with institutional change. While prior research has tended to treat market-related processes such as tipping independently from institutions, both formal and informal, the framework here integrates them. In the process, it can help us understand political institutions and market processes work together to drive segregation and make it persistent (pg. 34-35).

Snapshots from a Priesthood Session

This post is part of the General Conference Odyssey.

From Elder Paramore’s talk, I liked this story:

I am grateful for my wife. I would like to tell you a little story. I have been to three or four thousand meetings, I guess, in the last twenty-five years; and every one of those times she has sustained me—except for one. When I was off to a Sunday School meeting one night, she asked, “Will you be home early?” I said, “Yes, I’ll be home at 10:30.” Eleven o’clock and 11:30 came, and I wasn’t home. When I finally came home, I walked up to the door to walk in as usual, and it was locked. I rang the doorbell—and no answer. So I knocked on the door, and finally she came. She said, “I’m not going to let you in.”

I said, “Oh, come on.”

And she said, “No, it’s one time too many.”

In those days we had a Nash Rambler with a front seat that made out into a bed (but it was in the middle of winter). So I took my overcoat and went out into the car and rolled back the seat, and went to bed.

After a little while I could hear the front door open, and my wife came out to the car and asked me to come in. I told her I didn’t think I would. It was so cold I finally did.

Good intentions, obedience, and righteousness are not a pass on the ordinary difficulties of relationships. Good to keep in mind. We always expect religion to make life easier. It doesn’t. It makes life better. I don’t think I’ll ever really, truly learn that distinction. I just have to keep reminding myself.

From Elder Tanner’s talk:

Some people ask the reason for an organized church. They feel they can work out their salvation alone, and that there is no need to attend church meetings or fill other requirements as long as they are honest and honorable and do good to their fellowmen. But the Lord has given us instructions that we should belong to a church; and this, his church, has the same organization that Jesus Christ himself established while he was on the earth. We have many explicit declarations from the Lord that make this clear, and also that we need to encourage and help one another.

You might have expected an explanation of why we need to have an organized church. I did. But there really isn’t one. There is just an explanation that we need to have an organized church because Jesus said so. God reveals the what more often and sooner than the why. Another good thing to keep in mind, when it comes to keeping our expectations in tune.

And finally from President Kimball’s concluding talk:

Let me mention one more thing. While we are in the mortal body we cannot “fashion kingdoms [or] organize matter, for [that is] beyond our capacity and calling, beyond this world. In the resurrection, men who have been faithful and diligent in all things in the flesh, [who] have kept their first and second estate, and [are] worthy to be crowned Gods, even the sons of God, will be ordained to organize matter. How much matter do you suppose there is between here and some of the fixed stars which we can see? Enough to frame many, very many millions of such earths as this, yet it is now so diffused, clear and pure, that we look through it and behold the stars. Yet the matter is there. Can you form any conception of this? Can you form any idea of the minuteness of matter?” (JD, 15:137).

So, was Brigham Young presciently predicting the existence of dark matter? Or is that just an attempt to retcon his words?  Hard to say, or rather: I’d better not try to say without much more context and historical awareness than I actually possess. I’ll just quote President Kimball’s next words:

Can you realize even slightly how relatively little we know?

That sentiment is almost always a wise one. And—more than a habitual regard for intellectual humility—I like the practical implications of a religion that has a lot to look forward to. Much as Mormons do believe the Church of Jesus Christ of Latter-day Saints is the “one, true church”, we also very much believe it’s a work in progress with more to come.

Check out the other posts from the General Conference Odyssey this week and join our Facebook group to follow along!

Houston, Hurricanes, and History

Economic and policy historian Phillip Magness has an enlightening post on Houston’s Harvey situation:

Older generations remember earlier storms and hurricanes that produced similar effects going back decades, although you have to return to December 6-9, 1935 to find an example that compares to Harvey’s stats.

Houston was a much smaller city in 1935, both in population and in geographical spread. But by some metrics the 1935 flood was even more severe. Buffalo Bayou – the main waterway through downtown – peaked at over 54 feet. Harvey, in all its devastation, hit “only” 40 feet by comparison. The 1935 storm dropped less rain, the maximum recorded being about 20 inches to the north of town where Houston’s main airport now sits. But it was also complicated by the problem of severe storms upstream that flowed into town and caused almost all of the other creeks and bayous that flooded last weekend to exceed their banks. Reports at the time noted that as much as 2/3rds of what was then rural and unpopulated farmland in surrounding Harris County saw flooding. Those areas are now suburbs today.

The effects of the 1935 flood on populated areas are also eerily similar to what we saw on television over the weekend. I recommend watching this film of the aftermath for comparison. All of downtown was underwater, as the film shows. People were stranded on rooftops as rivers of water emerged around them. There are even clips of rescuers navigating the streets of neighborhoods in small boats and canoes as water reached second and third stories on nearby buildings.

In the aftermath of the 1935 flood, the federal government commissioned an extensive study of Houston’s rainfall patterns. They produced 
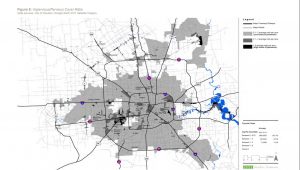
the following map of the Houston storm’s effects, showing unsettling similarities to what we just witnessed (note that this map does not include the areas to the north of town, where rainfall in 1935 was significantly higher. These are the suburbs that flooded along Cypress and Spring Creeks last weekend and the farmland that similarly flooded in 1935)

And therein lies the importance of history to understanding what we just witnessed in catastrophic form this weekend. Houston floods fairly regularly. In fact, downtown Houston has suffered a major flood on average about once a decade as far back as records extend in the 1830s.

He continues:

tropical storms and hurricanes throughout the 20th century revealed Houston’s continued vulnerability to storms.

The reasons have to do almost entirely with topography and geography. Houston sits on the gulf of Mexico in an active hurricane zone that attracts large storms. But more significantly, Houston’s topography is extraordinarily flat. The elevation drop across the entire city and region is extremely modest. Most local waterways are slow-moving creeks and bayous that wind their way through town and eventually trickle into the shallow, marshy Trinity bay. Drainage is slow on a normal day. During a deluge, these systems fill rapidly with water that effectively has nowhere to go.

We’ve seen a flurry of commentators in the past few days attributing Houston’s flooding to a litany of pet political causes. Aside from the normal carping about “climate change” (which always makes for a convenient point of blame for bad warm weather events, even as environmentalists simultaneously decry the old conservative canard about blizzards contradicting Al Gore), several pundits and journalists have opportunistically seized upon Houston’s famously lax zoning and land use regulations to blame Harvey’s destruction on “sprawl” and call for “SmartGrowth” policies that restrict and heavily regulate future construction in the city.

According to this argument, Harvey’s floods are a byproduct of unrestricted suburban development in the north and west of the city at the expense of prairies that would supposedly absorb rainwater at sufficient rates to prevent natural disasters and that supposedly served this purpose “naturally” in the past.

There are multiple problems with this line of argument that suggest it is rooted in naked political opportunism rather than actual concern for Houston’s flooding problems.

And here they are:

  1. “flooding has been a regular feature of Houston’s landscape since the beginning of recorded history in the region. And catastrophic flooding – including multiple storms in the 19th century and the well-documented flood of December 1935 – predates any of the “sprawl” that has provoked these armchair urban designers’ ire.”
  2. “the flooding we saw in Harvey is largely a result of creeks and bayous backlogging and spilling over their banks as more water rushes in from upstream. While parking lot and roadway runoff from “sprawl” certainly makes its way into these streams, it is hardly the source of the problem. The slow-moving and windy Brazos river reached record levels as a result of Harvey and spilled over its banks, despite being nowhere near the city’s “sprawl.” The mostly-rural prairie along Interstate 10 to the extreme west of the city recorded some of the worst flooding in terms of water volume due to the Brazos overflow, although fortunately property damage here will be much lower due to being rural.”
  3. “the very notion that Houston is a giant concrete-laden water retention pond is itself a pernicious myth peddled by unscrupulous urban planning activists and media outlets. In total acres, Houston has more parkland and green space than any other large city in America and ranks third overall to San Diego and Dallas in park acreage per capita.”
  4. “a 2011 study by the Houston-Galveston Area Council…actually measured the ratio of impervious-to-pervious land cover within the city limits (basically the amount of water-blocking concrete vs. water-absorbing green land). The study used an index scale to measure water-absorption land uses. A low score (defined as less than 2.0 on the scale) indicates a high presence of green relative to concrete. A high score (defined as greater than 5.0) indicates high concrete and low levels of greenery and other water-absorbing cover. The result are in the map below, showing the city limits. Gray corresponds to high levels of pervious surfaces (or greenery). Black corresponds to high impervious surface use (basically either concrete or lakes that collect runoff). As the map shows, over 90% of the land in the city limits is gray, indicating more greenery and higher water absorption. Although they did not measure unincorporated Harris County, it also tends to be substantially less dense than the city itself.”

In short,

Houston’s flood problems are a distinctive feature of its topography and geography, and they long predate any “sprawl.” While steps have been taken over the years to mitigate them and reduce the severity of flooding, a rare but catastrophic event will unavoidably overwhelm even the most sophisticated flood control systems. Harvey was one such event – certainly the highest floodwater event to hit Houston in over 80 years, and possibly the worst deluge in its recorded history. But it is entirely consistent with almost 2 centuries of recorded historical patterns. In the grander scheme of causes for Harvey’s flooding, “sprawl” does not even meaningfully register.