Stuff I Say at School – Part III: Rodrik on China and Development

This is part of the Stuff I Say at School series.

The Assignment

Group Report on Dani Rodrik’s article “What’s So Special About China’s Exports?

The Stuff I Said

I’m going to bring in some resources that push back against Rodrik. 

2008 paper finds that Rodrik’s “analysis does not adequately address a significant factor that is important in accounting for China’s superior export performance. This factor is the regional trade and production integration mediated by foreign direct investment (FDI) in East and Southeast Asian economies. A close look at the role of FDI in connecting China with other Asian countries to form a regional trading network would improve the understanding of the characteristics of China’s trade structure and the challenges China faces in international trade” (pg. 100). In my view, Liang’s paper actually highlights the importance of trade and integration contra Rodrik’s somewhat dismissive attitude toward it. Yet, this may still be overestimating the “specialness” of China’s exports. A 2010 paper also points out that Rodrik relies on China’s average per capita GDP (PCGDP) to determine the “specialness” of its exports, yet “China’s coastal provinces, which account for over 90% of China’s exports, have an average PCGDP level 1.5 to 2 times that of China’s overall PCGDP. Without taking this into account, one would underestimate the export capability against which the relative export sophistication is evaluated.” What’s more, “although many of China’s exported goods belong to sophisticated categories, they may well be the low-quality varieties” (pg. 483). When these factors are controlled for, the “specialness” of China’s exports declines.

Rodrik is right to point out that China’s growth has largely been under what many call “state capitalism.” Yuen Yuen Ang’s work has traced the co-evolutionary development between markets and institutions within China. But as one of her book’s reviewers notes, the bureaucratic corruption that played a role in spurring market-oriented growth may end up holding it back. (The good thing is that recent evidence suggests that market reforms and anti-corruption reforms create a virtuous cycle.) However, what I find so odd about Dani Rodrik’s somewhat heterodox position on globalization is that he seems to think that because China has experience incredible growth in the midst of its government’s heavy-handedness, the answer for development is state intervention. He basically watches communist China grow once it begins to liberalize its markets and his response is, “Developing countries need more state intervention.”

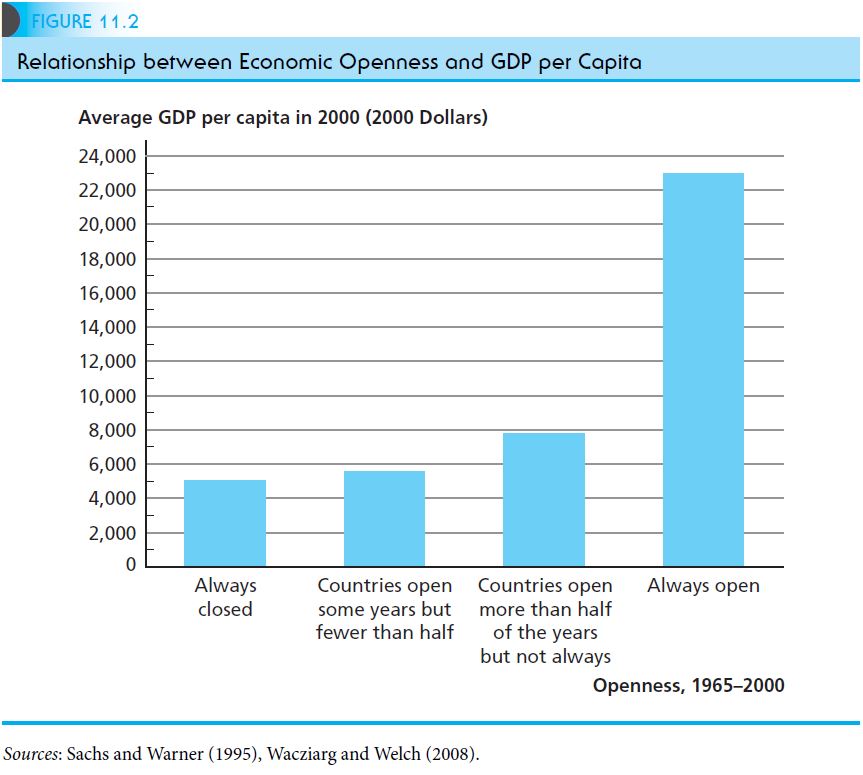
Economists like Acemoglu and Robinson don’t deny that economic growth can occur under extractive institutions. It’s just that it can’t last in the long run. This is why openness is so important. As David Weil demonstrates,

Our first approach is to see how growth rates compare in open and closed countries…First, the average growth rate of income in the closed group, 1.5% per year, was significantly lower than in the open group, 3.1% per year. Second, among the economies that were closed some or all of the time, there is no observable relationship between the initial level of a country’s GDP and its subsequent rate of growth. Among the countries open to trade, by contrast, we find strong evidence of convergence:Poorer countries that are open tend to grow faster than richer countries. Putting the results in the two figures together, we can see that poor countries that are open to trade grow faster than rich countries, and poor countries that are closed to trade grow more slowly than rich countries. Our second approach to exploring the effect of openness on growth is to consider how changes in a country’s degree of openness affect growth rates. If within a particular country, a change in trade policy (a trade liberalization or the imposition of new trade restrictions) is followed by a change in the growth rate of output, this pattern can supply us with evidence about the way trade affects income.One of the most sweeping examples of trade liberalization comes from 19th-century Japan. In the 12 years after Japan ended its self-imposed economic isolation in 1858, the value of Japanese trade with the rest of the world rose by a factor of 70. The opening to trade is estimated to have raised Japanese real income by 65% over two decades, and put the country on a path of growth that would eventually cause it to catch up to European levels of income…This same effect of trade liberalization has occurred in the 20th century as well. In South Korea, following a sweeping liberalization of trade in 1964–1965, income grew rapidly, doubling in the next 11 years. Similarly, Uganda and Vietnam experienced rapid growth in the 1990s, following their integration into the world economy.In all these examples, increased openness led to higher growth. Conversely,when we look at cases in which openness decreased, we see evidence that lower growth followed. For example, the trade embargo instituted by President Thomas Jefferson in 1807–1809 spawned widespread unemployment and bankruptcy in the United States. Similarly, the wave of tariff increases throughout the world in 1930, including the U.S. Smoot-Hawley tariff, contributed to the severity of the Great Depression of the 1930s (pg. 327-329).
Weil, 2013, pg. 307.

Given the evidence above, I think China and other developing countries would do well to open their economies more.
Does Employment Protection Actually Lead to Fewer Jobs?

Image result for low wages jobs

Based on a new analysis of a 2001 Swedish reform, it appears so:

The effect of employment protection legislation (EPL) on employment is theoretically ambiguous. Increased firing costs make employers both less prone to dismiss workers and less inclined to hire them, as employers anticipate these potential costs already in their hiring decisions (Bertola, 1999). In accordance with the theoretical prediction, empirical evidence on the overall employment effect is mixed (see, e.g., OECD, 2013, and Skedinger, 2010, for surveys).

…There is ample evidence, based on various types of data and identification strategies, suggesting that stricter EPL indeed hurts the employment prospects of vulnerable groups, like women, youth, immigrants, the low-skilled, and the disabled…Unlike previous work in this field, we focus on the employment prospects of the unemployed and participants in active labor market programs (ALMPs). We examine a reform of seniority rules in Sweden in 2001 that affected small firms only. Seniority rules – or last-in first-out – imply that dismissals should occur in reverse order of seniority…We investigate whether the liberalization of EPL made employers in small firms more willing to hire “wild cards”, with little previous experience. Seniority rules are also likely to increase the average productivity of dismissed workers, thus making unemployment less of a stigma and increasing the hiring rate of unemployed workers, as argued by, e.g., Baumann (2010) and Kugler and Saint-Paul (2004). 

…Our results indicate that the reform increased the share of workers hired from unemployment by 5-10 percent, depending on specification. We obtain mixed results concerning transitions from ALMPs to employment following the reform. The findings suggest an increase in transitions for programs focusing on preparatory training by 5-11 percent. The reform appears to have decreased the share of workers hired from subsidized employment, albeit only for certain firm size categories. No effect is found on transitions from longer unemployment spells to employment. Finally, we note that the increase in the share of workers hired from unemployment and ALMPs seems to be driven primarily by those with some college education (pg. 1-3).

In short, “a less stringent EPL made it easier for employers to allow for more uncertainty regarding the productivity of workers in their hiring decisions” (pg. 14). They note that “the [Swedish] reform may not have been far-reaching enough to have any favorable effect on the employment of the long-term unemployed and those in subsidized jobs, for whom the stigma is arguably more severe. The increase in workers hired from short-term unemployment and preparatory labor market programs may have adversely affected the remainder of the labor market, crowding out the employment of some of the most marginal groups” (pg. 15).

You find similar results with minimum wage hikes. You can protect the (slightly) higher-paying jobs of the already employed at the expense of the lower-skilled, lower-educated unemployed or you can make lower-paying jobs more accessible to the most vulnerable. 

Are the Rich Getting Richer and the Poor Getting Poorer?

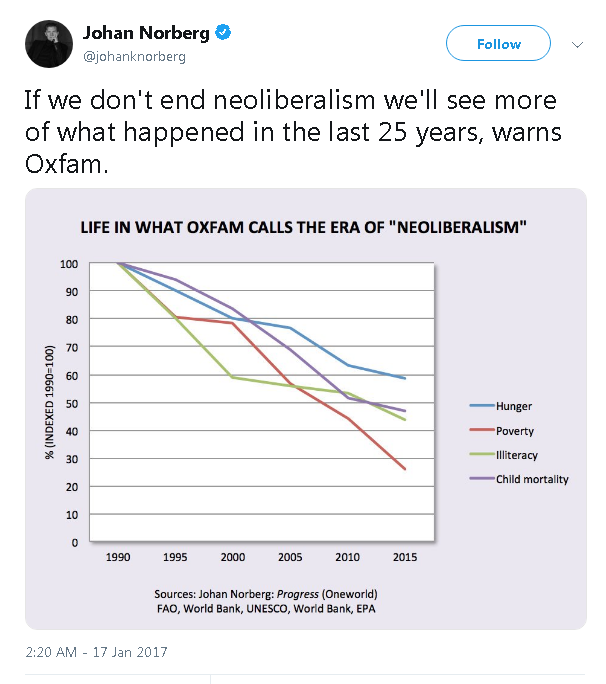
With yet another Oxfam report out, Swedish author Johan Norberg felt the obligation to point out its deficiencies:[ref]The following is based on a Bing translation.[/ref]

There are two rules to stick to when someone reports that the rich are getting richer and the poor poorer. The first is to check the source. The second is that if the track shows that the information comes from OXFAM, you can throw it in the trash. Few organizations have such a consistent habit of misleading about the world’s prosperity.

The fact is that poverty is decreasing dramatically regardless of the degree of poverty that is used. According to the UN and World Bank’s measures of extreme poverty, it has fallen from 18.1 to 8.6% between 2008 and 2018. It is the biggest economic lift in history.

So how can Oxfam get it to the poor become poorer? Firstly, they ignore the income and consumption, and count only financial assets, which the poor rarely have – often they do not even have a bank account. And although some have it, there will not be much left in total when you deduct all the debts they have from this amount.

It enables OXFAM every year to shock journalists by saying that a single billionaire owns more than two billion people together. The problem with the reasoning is just that my daughter – who owns about 500 kronor – owns more than two billion people together, because these two billions do not have any net financial assets at all.[ref]Others have had similar criticisms over the years.[/ref]

Or, as he said on Twitter a couple years ago:

Norberg then cites some recent research on global earnings inequality. The researchers explain,

We focus exclusively on labour earnings, which is the main income source for the vast majority of the world’s population (Hammar and Waldenström 2017). We create the first estimates of global earnings inequality, its trend between 1970 and 2015, and some evidence on its main drivers.

The estimation of the global earnings inequality rests on a unique earnings survey database run by UBS, a Swiss bank. It contains data on earnings, taxes, working hours, and local prices for workers in 15 representative occupations. The data have been collected in the same way every third year since 1970, in up to 85 cities in 66 countries, in all the world’s continents. We match it with occupational and country population data from the ILO and the World Bank. Our balanced sample covers more than 80% of the global population, and correlates well with statistics from other sources. It should be noted that the tails of the distribution are not well covered in our data, but imputations from other sources (top incomes from the World Wealth and Income Database, for example) suggest only a modest impact on the global earnings inequality trend.

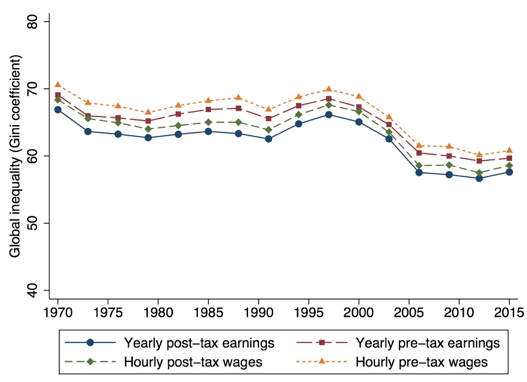
Figure 1 [below] shows the main result – that global earnings inequality was very high in 1970 (with a Gini coefficient of around 70), but has fallen to a lower level today (around 60). The main equalisation occurred in the late 1990s and 2000s. Global pre-tax inequality is higher than global post-tax inequality (approximately 3 Gini points), and inequality is higher for hourly wages than for yearly earnings (approximately 1 percentage point). The latter suggests a negative relationship between earnings and hours worked at the global level. Compared with earlier studies on global inequality in income or consumption, we find that inequality in earnings and wages is slightly lower, but follows a similar trend.

Figure 1

They continue,

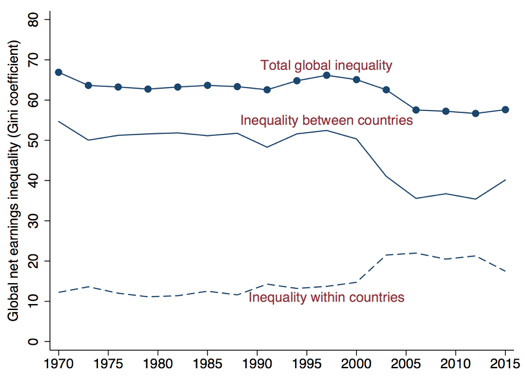
Decomposing the global earnings inequality trend within and between countries, we find that within-country inequality rose over this period (by 5 Gini points), while between-country inequality fell (by 15 points), leading to the combined effect of a 10-point fall in total earnings inequality. In Figure 3, we can also see that the main shift in both of these trends took place at almost the same time, during the early years of the 21st century. We also find that inequality within occupations has fallen, especially within the traded, industrial sector. This suggests that globalisation could be a potential driver of this earnings convergence trend.

They conclude,

Our new evidence on global earnings and wage inequality shows a falling trend over the past half-century. Similar to previous findings for global household income inequality, the main equalisation period was the late 1990s and 2000s. At this time several large, developing economies experienced high growth rates. Higher earnings in the agricultural sector, but also some low-skill urban professions, contributed specifically to this trend.

Once again, things are getting better.

Do Immigrants Decrease Economic Freedom?

Image result for immigrants mexican

In my BYU Studies Quarterly article last year, I wrote,

Another objection [to increased immigration] is what is known as the “epidemiological case,” which argues that immigrants may bring with them foreign values that undermine the culture and institutions of the host country. In essence, immigrants transmit to rich countries those elements that make their source countries poor. What makes this rather prejudiced argument all the more jarring is the fact that it has virtually no supporting evidence. Unfortunately, very little empirical research has been conducted exploring the impact of immigrants on cultural, political, and economic institutions at all. However, the research that is available should calm fears and actually provide reasons for optimism. For example, there is no association between growth of total-factor productivity (TFP) in rich countries and the ratio of migrants from low-income countries, indicating that migrants do not “contaminate” their new homes with the low productivity of their source countries.

The Canada-based Fraser Institute publishes its oft-cited Economic Freedom of the World report annually. Its indicator—known as the Economic Freedom of the World (EFW) Index—defines economic freedom based on five major areas: (1) size of the government, (2) legal system and the security of property rights, (3) stability of the currency, (4) freedom to trade internationally, and (5) regulation of labor, credit, and business. According to the institute’s most recent report (which looks at data from 2015), countries with more economic freedom had considerably higher per-capita incomes and economic growth. Relying on this index, a 2015 study found that a larger immigration population marginally increases the economic freedom of the host country’s institutions. No negative impacts on economic freedom were found. Several authors from this study looked at Israel during the 1990s as a natural experiment in mass migration. During the 1990s, Israel’s population grew by 20 percent due to immigrants from the former Soviet Union. Yet, instead of experiencing decline, Israel shot up “from 15% below the global average [in economic freedom] to 12% above it and improv[ed] its ranking among countries by 47 places.” Similarly, a 2017 study found that higher diversity—measured by levels of ethnolinguistic and cultural fractionalization—predicts higher levels of economic freedom. While this particular study mainly discusses development economics, the correlation between high diversity and high economic freedom is an important aspect of the immigration debate. Barring members of different ethnolinguistic groups from entering the country may actually be holding back economic development (pg. 95-97).

Research on Jordan provides further evidence for the position above. Another 2018 study piles on. Overall, the authors’ 

results don’t show any strong relationship between increases in immigration and less economic freedom, nor do they show any strong relationship between an increase in the share of naturalized US citizens and less economic freedom. Therefore, our results indicate that, so far, Borjas’s concerns about a deterioration in the quality of institutions following an increase in immigration are not supported by the empirical results as they apply to the US states (pg. 394).

There were mixed results when it came to minimum wage legislation and union density. In the cases where the effects are slightly negative, the authors explain,

In states with larger immigrant population shares, are the increases in minimum wages and union densities the result of immigrants pushing for higher minimum wages and joining unions at higher rates than native-born individuals (because immigrants’ wages tend to be lower than natives’ wages)? Or are they the result of native-born individuals unionizing and pushing for higher minimum wages as a way of pricing out and restricting immigrant labor market supply?[ref]There’s certainly evidence that this occurs.[/ref] It could be explained either way and both explanations probably operate. However, our results don’t necessarily indicate whether the negative impact on labor market freedom is coming more from immigrants or more from native-born citizens. Therefore, when we study the relationship between immigration and economic freedom, the results don’t tell us much about the direct impact immigrants may have (pg. 376).

If you think the only way to “Make America Great Again” is by keeping out foreigners in the name of protecting our institutions, you need to chillax. 

The Big Push Falls Short

I just started my first semester at John Hopkins this week and one of my classes is “Economic Growth: The Politics of Development in Asia, Africa and Beyond.” I was happy to see that I owned a few of the books on the “Recommended Reading” list and that virtually all of the authors I had read quite a bit from. As I reviewed the list of authors and resource, I was reminded of this blog post by economist Alex Tabbarok on Jeff Sachs’ plans for African development. Sachs believed that Africa needed a “big push” in public investment to escape the “poverty trap” and spur growth. This led to the Millennium Village Project in 2005. Tabarrok explains,

The initial MVP evaluation claimed great success but simply compared some development indicators before and after in the treated villages without comparing to trends elsewhere. In 2010 such a study was completely out of step with contemporary practices in impact evaluation. Red flag! Clemens and Demombynes showed that comparing to trends elsewhere significantly moderated the impact. A second MVP paper was published in the Lancet but then was quickly retracted when Bump, Clemens, Demombynes and Haddaddemonstrated that it had  significant errors. Clemens and Demombynes wrote a summary piece on the controversy then in an astounding and under-reported scandal the MVP tried to stifle Clemens and Demombynes. The MVP, with Jeff Sachs at the head, also sicced their lawyers on Nina Munk and her book, The Idealist: Jeffrey Sachs and the Quest to End Poverty. More red flags.

Yet, despite all of this controversy and bad behavior, the MVP project continued to move ahead and in 2012, the UK Department for International Development (DFID) funded US $11 million into an MVP in Northern Ghana that ran until December 2016. Under the auspices of the DFID, we now finally have the first in-depth, independent evaluation of one MVP project and it doesn’t look great.

While Sachs and crew saw the outcome in a rosier light, the DFID’s evaluation put it bluntly:

Overall, the MVP in northern Ghana did not achieve the overall MDG target to reduce extreme poverty and hunger at the local level. Where there are attributable changes to the MDG targets, these tended to be the more limited changes than those that will fundamentally improve people’s health, educational and other outcomes. For instance, the project did increase attendance at primary school (Goal 2) but did not go beyond this MDG and improve the learning outcomes of children; the project did increase the proportion of births attended by professionals and women said to be using contraceptive methods (MDG indicators), but it is not possible to assess the effect on maternal health (Goal 5); and the project did increase the number of toilets (a target under Goal 7), but not beyond this MDG in terms of hygiene and sanitation practices. There are, however, exceptions. The project
had a remarkable impact on stunting, which is a long-term health indicator and a predictor of socioeconomic outcomes in adulthood (pg. 162).

Projects like these may have some positive results, but they ultimately look like more Western hubris

Doing Business 2019

The World Bank’s latest Doing Business report is out (check out the last couple years). The report “measures regulations affecting 11 areas of the life of a business. Ten of these areas are included in this year’s ranking on the ease of doing business: starting a business, dealing with construction permits, getting electricity, registering property, getting credit, protecting minority investors, paying taxes, trading across borders, enforcing contracts and resolving insolvency. Doing Business also measures labor market regulation, which is not included in this year’s ranking.” 

It’s key findings are as follows:

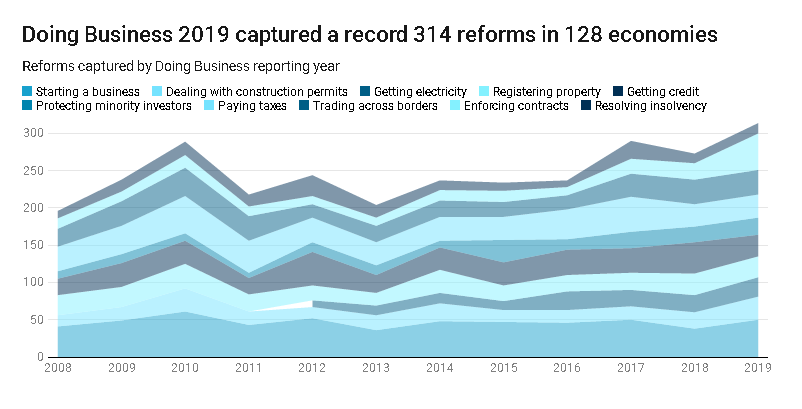
  • Doing Business captured a record 314 regulatory reforms between June 2, 2017, and May 1, 2018. Worldwide, 128 economies introduced substantial regulatory improvements making it easier to do business in all areas measured by Doing Business.
  • The economies with the most notable improvement in Doing Business 2019 are Afghanistan, Djibouti, China, Azerbaijan, India, Togo, Kenya, Côte d’Ivoire, Turkey and Rwanda.
  • One-third of all business regulatory reforms recorded by Doing Business 2019 were in the economies of Sub-Saharan Africa. With a total of 107 reforms,  Sub-Saharan Africa once again has a record number this year.
  • The BRIC economies—Brazil, the Russian Federation, India and China—introduced a total of 21 reforms, with getting electricity and trading across borders the most common areas of improvement.
  • The 10 top economies in the ease of doing business ranking share common features of regulatory efficiency and quality, including mandatory inspections during construction, automated tools used by distribution utilities to restore service during power outages, strong safeguards available to creditors in insolvency proceedings and automated specialized commercial courts.
  • Training opportunities for service providers and users are positively associated with the ease of doing business score. Similarly, increased public-private communication on legislative changes and processes affecting SMEs are associated with more reforms and better performance on the Doing Business indicators.


The World Bank notes, “The most popular reform is making it easier to start a business. More than a quarter of economies did just that in 2017/18. It now takes an average of 20 days and costs 23% of income per capita to start a business, compared to 47 days and 76% of income per capita in 2006. Thirteen of the top 20 economies have at least one procedure that can be completed online in half a day.”

Check it out.

Have the Minimum Wage Hikes in South Korea Helped the Economy?

From The New York Times:

Under President Moon Jae-in, South Korea has raised taxes and the minimum wage in the name of economic growth. So far, it hasn’t worked out as planned.

Growth has slowed, unemployment has risen and small-business owners like Moon Seung are complaining. Mr. Moon, founder of an auto parts maker called Dasung in Incheon, an industrial town near Seoul, says his labor costs were up an extra 3 percent last year after the minimum wage rose to 7,530 Korean won, or about $6.70, an hour. That may not sound like much, but it ate into his razor-thin profit margin and prompted him to stop hiring.

“We can’t take it,” Mr. Moon said. “This is a problem not just for the employers, but for the employees.”

The NYT is quick to recover:

The discouraging early results don’t mean that Mr. Moon is wrong and Mr. Trump is right. Wage growth in the United States, though stronger in recent months, has generally remained stubbornly low despite the tightest labor market in a generation, and the American economy is widely expected to slow in 2019 as the economic sugar rush of Mr. Trump’s tax cuts wears off. Pro-business policies in Europe, where labor laws are being loosened, have been met with large-scale protests.

That’s true, but large-scale protests don’t mean that strict labor laws are right either. The article continues:

Mr. Moon aims to improve the incomes of average Korean families so they will consume more, thus reducing the economy’s reliance on exports and, with them, the ups and downs of the global economy. (Exports accounted for 43 percent of South Korea’s gross domestic product in 2017, compared with 20 percent for China.)

But joblessness hit an eight-year high in August of 4.2 percent after the new minimum wage took effect, though it has since improved. Growth was at 2 percent in the third quarter compared with the same period a year earlier, down from 2.8 percent in the second quarter.

The biggest problem is the strain on small businesses, which are often unable to pass on higher costs to their customers. In a 2017 survey of its members by a small-business organization known as Kbiz, 42 percent said they would be forced to shed employees because of the minimum wage increase.

Unsurprisingly, “Some union leaders argue that the minimum wage is not rising quickly enough, and they objected to a proposal that would give businesses more flexibility in meeting limits on working hours. On Nov. 21, an estimated 160,000 workers went on a general strike.” Some experts remain optimistic:

“It is difficult to catch two birds — economic growth and even distribution — with one stone,” said Jung Yoo-shin, dean of the Graduate School of Management of Technology at Sogang University in Seoul. “He needs more time.”

Frederic Neumann, co-head of Asian economics research at HSBC in Hong Kong, said South Korea’s export-led economy had been hurt more by the slowdown in global growth than the higher minimum wage. Though he is forecasting lower growth for South Korea in 2019, Mr. Neumann said lifting wages among lower-income people was good for the economy.

Maybe. Or maybe we should look at the economic evidence for minimum wage hikes.

Image result for i'm shocked gif

Does Globalization Increase Economic Mobility?

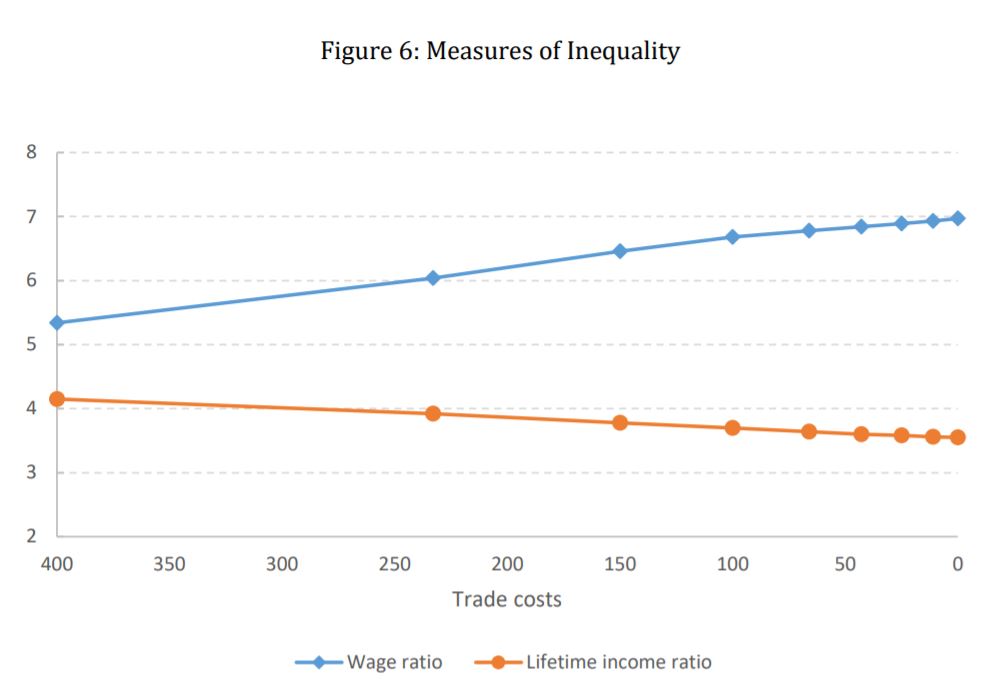
A new working paper draws on Swedish manufacturing data between 1997 and 2013 to determine the effects of globalization on economic mobility. Defining globalization as “a reduction in trade costs” (pg. 22), the authors note,

Most workers land their first full-time job in their 20s and then spend 40 to 50 years in the labor market trying to earn a living. Over their careers, workers acquire new skills, which enables them to change jobs and (sometimes) occupations in order to increase job satisfaction and career earnings. It follows that a complete picture of the impact of globalization on a typical worker should take into account its impact on skill acquisition and the rate at which workers are able to secure better jobs (that is, economic mobility) (pg. 38).

The authors develop “a model of a jobs ladder in which workers gain skills on the job that qualify them for higher-paying jobs at more productive firms” (pg. 38). They explain,

Our main finding is that when trade costs are initially high, globalization increases economic mobility through two channels. First, the reduction in trade costs leads to more international engagement by firms. As the number of exporting firms grows, the ability of workers to gain skills that reduce trade costs is enhanced. This makes it easier for workers to qualify for jobs at the top of the jobs ladder. Second, since high-productivity firms gain disproportionally from falling trade costs, globalization increases wage inequality. And, as the gaps between the wages paid by different groups of firms increase, workers become more willing to (a) incur the moving costs associated with changing jobs and (b) expend effort to keep their skills from deteriorating. As a result, upward economic mobility rises and downward economic mobility (due to demotions or terminations) falls. These changes in economic mobility reduce the differences in expected lifetime incomes forecast by workers in high-wage and low-wage jobs, resulting in the possibility that inequality in lifetime incomes might fall with globalization (even though wage inequality is rising). Even the case in which globalization increases inequality in terms of lifetime incomes, the impact is smaller than its impact on wage inequality (pg. 39).

What’s more,

Employment is reallocated from firms that pay medium wage towards the extremes, with high-wage and low-wage employment both increasing. While it is tempting to interpret this reallocation of employment as an explanation of “job polarization” as described in recent empirical work (see Goos and Manning 2007; Goos, Manning, and Salomons 2009; Autor, Katz and Kearney 2006, 2008 and Autor and Dorn 2013), we believe that would be a mistake…Our results indicate that globalization can result in a shrinking middle-class within a given occupation, with increased export opportunities resulting in more firms willing to recruit the most experienced workers by paying the highest wage; while others react to increased competition from imports by re-orienting their hiring toward inexperienced low-wage workers. These results are not driven by outsourcing. Instead, they are completely driven by the manner in which globalization alters the networks that firms use to fill their vacancies (pg. 39-40).

This image has an empty alt attribute; its file name is employment-shares.jpg

When trade costs are high, “globalization allows [low-wage workers] to move up the jobs ladder more quickly and, as they reach higher and higher rungs, they enjoy the enhanced benefits of the higher real wages generated by freer trade. In this case, a focus on wage inequality can be misleading in that low-wage workers do not lose as much relative to others in the labor market as would be indicated by standard analysis” (pg. 28-29). However, when trade costs are already low, “[w]age inequality rises and the rate at which workers move
out of their entry level jobs slows.” However,

the proper way to measure the effect of globalization on a worker is to examine its impact on that worker’s expected lifetime real income. That measure considers both the change in real wages and the degree of economic mobility faced by that worker. Thus, we can get a better view of how globalization affects inequality by examining the changes in expected lifetime real incomes for workers in different labor market states…Inexperienced workers only hold low-wage jobs for a portion of their lifetime, moving on to much better jobs as they gain skills. As they mature, they benefit from the higher real wages paid to medium-wage and high-wage production workers if they can gain the proper skills and land better jobs. The fact that using current wages as a proxy for lifetime earnings can lead to misleading conclusions is not a new insight. This issue is well understood and heavily researched in many sub-fields of economics; but, as far as we know, it has not received much attention from those investigating the link between globalization and inequality (pg. 29-30).

This image has an empty alt attribute; its file name is inequality.jpg

The devil is in the details.

The Effects of Legalizing Immigrants

Image result for spain immigration

Over at SMU’s Texas-Mexico Center blog, I wrote,

Despite the recent political rhetoric and anti-immigrant sentiments, the economic benefits of immigration are well-established in the empirical literature. A 2011 meta-analysis by economist Michael Clemens found that dropping all current immigration restrictions would result in a doubling of world GDP.

A more recent analysis corroborated these findings, concluding that lifting all migration restrictions would increase world output by 126%. In 2015, migrants made up 3.4% of the world population yet contributed about $6.7 trillion to global output—9.4% of world GDP. The McKinsey Global Institute estimates that this is $3 trillion more than these migrants would have produced had they stayed in their origin countries. Even undocumented workers in the United States contribute about 3.6% of private-sector GDP annually—around $6 trillion dollars over a 10-year period. Granting these migrants legal status would increase their contribution to 4.8%. 

On this last point, a recent study explores the effects of immigrant legalization in Spain. The authors explain the background for the natural experiment:

In the early 2000s, Spain experienced an incredible boom in immigration. The share of immigrants in the working-age population increased from less than 2% in 1995 to around 10% in 2004. Many of these newly arrived immigrants lacked work permits. By 2004, there were close to 1 million undocumented immigrants in a country of around 43 million inhabitants.

Despite this large number of undocumented immigrants, the government at the time, led by Jose Maria Aznar (Popular Party) and with Mariano Rajoy in its cabinet, was unlikely to legalise the work status of immigrants. Traditionally, the Popular Party had been proposing tougher policies against immigration. Its main stance was to avoid implementing policies that could attract new waves of immigrants. In this context, in the early 2000s, immigrants were granted work permits mostly on the basis of family reunification.

On 14 March 2004, voters in the Spanish general election had to determine whether the Popular Party would continue in power or be replaced by the Socialist Party. In the week before the election, the outcome seemed clear: the polls were forecasting that Zapatero of the Socialist Party was trailing Rajoy by seven percentage points. 

Yet, something completely unexpected happened just three days before the election which, as shown by Garcia-Montalvo (2011), changed the final outcome: Madrid suffered the largest terrorist attack in Spanish history, a tragedy that was poorly managed by the Popular Party. As a result, the Socialist Party came to power, and one of the first policies it implemented was the legalisation of nearly 600,000 immigrants already living (and working illegally) in Spain.

Using administrative payroll tax revenues, the authors find

that the legalisation of immigrants’ work status increased revenues locally — i.e. at the province level — by around €4,189 per newly legalised immigrant. This amount is only 55% of what we would have expected if newly legalised immigrants had shared the same characteristics as previous contributors to the social security system and had enjoyed similar labour market experiences. Two factors may explain this. First, newly legalised immigrants were perhaps disproportionately low-skilled and had worse labour market experiences than natives. Second, the legalisation may also have affected previous workers.

…Using very detailed administrative and survey data on wages and employment, we show that the policy change disproportionately affected the labour market outcomes of workers in high-immigrant locations relative to low-immigrant locations. In particular, it worsened employment opportunities for both low-skilled natives and immigrants, while it improved them for high-skilled workers. Among low-skilled natives, those who lost their jobs were negatively selected — the policy change negatively affected employment prospects of native low-skilled workers at the bottom of the wage distribution. Putting together all the labour market changes and comparing them to payroll tax revenue changes, we show that this negative selection is crucial to fully understand the effects of the reform.

We also show that, following the reform, many immigrants moved from high- to low-immigrant locations. This is important since these immigrants also contributed to payroll tax revenues, but in traditionally low-immigrant locations. This, in turn, means that comparing local payroll tax revenues in high- relative to low-immigrant locations to evaluate the effect of the policy may underestimate the true impact of immigrant legalisation on payroll tax revenues. Once we take into account internal migration and selection, we argue that the true contribution was almost €5,000 per newly legalised immigrant, i.e. substantially higher than what we would have been able to estimate on the basis of local tax revenue data alone.

Incoherent Know-Nothings

Cards Against Humanity’s Pulse of the Nation poll from 2017 to 2018 has some pretty interesting, disturbing, and rather unsurprising findings about the American public:

Conflicting Views

39.1% of Democrats think that it’s wrong to negatively stereotype people based on their place of birth, but also think Southerners are more racist.

65.2% of Republicans think that people are too easily offended, yet find Black Lives Matter offensive.

64.6% of Democrats think that a woman has the right to do what she wants with her body, except when it comes to selling her kidney. Nearly half also believe a woman has the right to do whatever she wants with her body, except sell it for sex.

57.9% of Republicans think that people should be free to express their political opinions in the workplace, but athletes shouldn’t be allowed to make political protests at games.

Over half of Democrats think that men and women “are equal in their talents and abilities,” except when it comes to multitasking and empathy.

About 1/3 of Republicans think we should be more suspicious of foreigners, yet believe Putin when he says he didn’t interfere in the 2016 election. (You’re twice as likely to do this if you support Trump.)

Over half of Republicans believe nobody deserves a handout and that the government should do more to help small, working-class towns in America’s heartland.

About 1/3 of Democrats say that they trust the scientific consensus, just not when it comes to GMOs.

Political Ignorance

39% of Americans either think low GDP is better than high GDP or have no clue altogether.

The majority of Americans can’t name the three branches of government.

Only 12.7% of Americans can name a living, breathing economist. 55.9% can’t name a living economist, but think their opinions about economic policy are well-informed.

The richest 1% of Americans own 39% of the country’s wealth. Everyone overestimates the amount. If you’re a Democrat, you think it is 75 percent. If you’re a Republican, you think it’s 50 percent. Perhaps surprisingly, the more educated you are, the more likely you are to overestimate the amount.

Nearly half of Americans do not believe the U.S. has interfered with foreign democratic elections. You’re less likely to believe it if you’re Republican.

Other Stuff

Those who think “sex without love” is okay are far more likely to be pro-choice.

If you rely on “common sense” instead of empirical evidence, you’re likely older, less educated, and lack a Twitter account. You also are more likely support military action against Russia for their 2016 election interference. 

29% of Trump supporters would still stick with him in 2020 even if he murdered journalist for spreading lies.