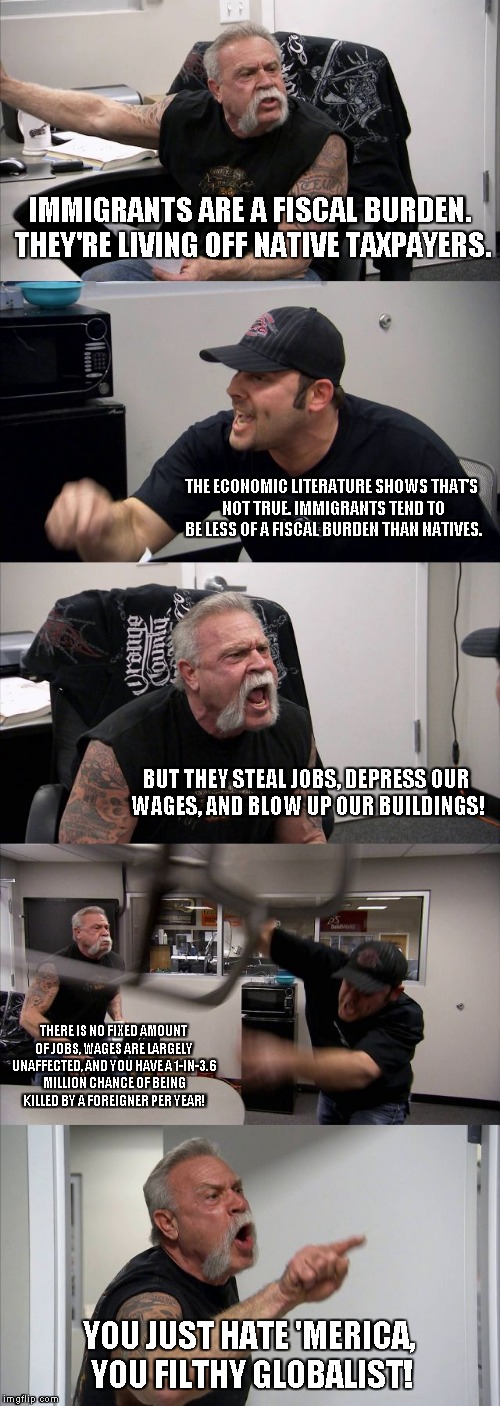
The Potential Costs of Climate Change

I’ve written about the economic cost of climate change before. Economist Tyler Cowen recently made a similar observation:

I am struck by the costs of climate change suggested in the UN’s Intergovernmental Panel on Climate Change report, hardly a source of denialism. Its cost estimate — “1 to 5% of GDP for 4°C of warming” — is relatively reassuring. After all, global GDP is right now growing at more than 4 percent a year. If climate change cost “only” 4 percent of GDP on a one-time basis, then the world economy could make up those costs with less than a year’s worth of economic growth. In essence, the world economy would arrive at a given level of wealth about a year later than otherwise would have been the case. That sounds expensive but not tragic.

And yet, Cowen recognizes that this may “not [be] the right way to conceptualize the problem.” Having opened his piece with recent examples of irrational responses to legitimate, if relatively minor, problems–Brexit in response to EU bureaucracy, Trump’s election in response to immigration and trade issues–Cowen explains, 

Think of the 4 percent hit to GDP, if indeed that is the right number, as a highly unevenly distributed opening shot. That’s round one, and from that point on we are going to react with our human foibles and emotions, and with our highly imperfect and sometimes corrupt political institutions. (Libertarians, who are typically most skeptical of political solutions, should be the most worried.)

Considering how the Syrian crisis has fragmented the EU as well as internal German politics, is it so crazy to think that climate change might erode international cooperation all the more? The true potential costs of climate change are just beginning to come into view.

I’d say that we just need to educate people more, but given (1) the amount of political ignorance despite rising levels of education and (2) the general ineffectiveness of our education systems in this regard, I don’t think that will help much. 

Image result for well that's depressing gif

Economic Freedom of the World Report: 2018

The Fraser Institute just published its Economic Freedom of the World 2018 Annual Report, which looks at data from 2016. The degree of economic freedom is measured using 5 broad areas:

  1. size of government (expenditures, taxes, enterprises)
  2. legal structure and property rights (which now includes the Gender Disparity Index)
  3. access to sound money
  4. freedom to trade internationally
  5. regulation of credit, business, and labor

The ten most economically free countries are:

And what are the benefits of economic freedom? 

But I’m sure we’ll continue to hear about how we need to roll back our economic freedom because reasons. 

Does Economics Explain the Rise of the Swedish Radical Right?

As of late, I’ve been writing about populism and its causes. Economic reasons have been largely dismissed in various mainstream outlets and they have plenty of studies supporting the claim. However, it is very difficult to separate economic change from cultural change. What’s more, economic shifts provide the overall context for other anxieties to emerge. Too often, ignorance about the effects of these shifts drive the public to populism.

Recent evidence from the rise of the Sweden Democrats–a radical-right party–appears to support this view. The authors of a new working paper write,

We start from the timing of the Sweden-Democrat rise: growing to enter parliament between 2006 and 2010, and continuing to become Sweden’s third largest party in 2014 (with a 12.9 percent vote share). This period pre-dated the 2015 refugee crisis, but coincided with two events that worsened the relative economic lot for large segments of the population. In 2006, a Center-Right coalition of parties took power and implemented a dramatic reform agenda of tax cuts and social-insurance austerity with the purpose to “make work pay.” Over a mere six years, these reforms triggered a dramatic increase in income inequality. With earned income tax credits, incomes continued to grow among “insiders” with stable employment, while spending cuts implied a stagnation of disposable incomes for “outsiders” with unstable or no jobs. The second key event is the 2008 financial crisis. The crisis increased the job insecurity for “vulnerable insiders”, segments of the population with stable employment, but with jobs at higher risk of replacement by automation and other forms of rationalization than “secure insiders”.

To analyze the consequences of these events, we classify the population into economic winners or losers, starting out from comprehensive register data that provides a panel of yearly observations for the full adult population in 1979-2012. With this data, we can characterize the economic and social circumstances for individual politicians and for residents of each precinct or municipality…We find that the groups which faced a relative-income decline and higher job insecurity are over-represented among the politicians and voters of the radical right. Politicians from the Sweden Democrats include more outsiders and vulnerable insiders, compared to both the population and, very starkly, other political parties. Over-representation also grows across sub-groups of labor-market outsiders the more they lost (relative to insiders) from the make-work-pay reforms. For voters, we find a strong positive correlation between the Sweden Democrats’ electoral success and the impact of the economic reforms and the financial crisis (i) across municipalities and (ii) across voting districts within municipalities. Putting this correlation into a formal regression model, we can add a myriad of control variables from register data and other data sources. The strong correlation with negative economic shocks is not affected by the stocks and flows of immigrants from different regions, or by immigrants having jobs or being welfare recipients in a geographic area. They are also robust to controls for crime rates, media reporting on immigration, and local political contextual variables (pg. 1-2).

The authors suggest that “the political left offers a slate of politicians skewed away from labor-market outsiders and vulnerable insiders towards secure insiders. Adding to this evidence, we find that wherever groups of economic losers (or the losses they incur) are particularly large, the Sweden Democrats offer them more over-representation relative to other parties. Another side of our explanation is that economic shocks triggers diminished trust in government, of which the established left parties form part (following e.g., Algan et al. 2017). We find some support for this in survey data. The rise in electoral support for the Sweden Democrats temporally coincides with a clear divergence in trust in government institutions, including political parties, between labor-market outsiders and insiders. It is intuitive that candidates who themselves share the economic traits of disgruntled voters may stand a better chance to credibly bridge this trust gap” (pg. 2).

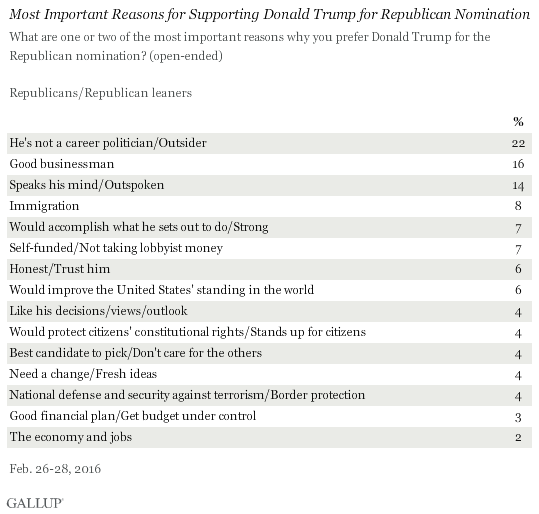
While the Swedish experience may not be the same as the American one, I think the two resemble each other far more than they differ. For example, when Gallup polled Trump supporters in early 2016, they found that Trump’s

unconventional résumé and style have helped attract their support for his candidacy, more so than his positions on issues or specific policies. In fact, other than his signature issue of immigration, mentioned by 8% of his supporters, no other issue is named by more than half that many — with between 2% and 4% mentioning his ability to deal with terrorists, his financial planning and budget expertise, and his handling of the economy and employment…[I]t is his nonpolitician background that comes to mind first, not his positions on issues, when supporters are asked to explain why they want him as their party’s nominee…Republicans who support Trump’s candidacy like him for being an anti-politician, and Trump’s willingness to say things that flout conventional norms governing political speech may only strengthen his authenticity as an outsider.

Most Important Reasons for Supporting Donald Trump for Republican Nomination, February 2016

I don’t think it’s a coincidence that the desire for a (perceived) anti-establishment, anti-elite outsider followed in the wake of the Great Recession.

Is a Pro-Capitalist Mentality on the Decline?

Looks that away according to a Spring 2018 article in The Independent Review. Economist Carlos Newland constructs a Free-Market Mentality Index (FMMI) in an attempt to quantify the change in attitudes. He writes,

What is the basis on which institutional frameworks favorable to abundance or growth are built? For Michael Porter (2000), that basis is the economic culture or mentality of the population. Porter argues that to achieve sustainable growth a society must have an archetype of productivity, including a comprehension of the factors that influence the efficiency of the economy. These factors include an appreciation of competition, openness to globalization and international trade, an understanding that free markets benefit a majority of the society, and an awareness of the pernicious effects of government favoritism. Porter argues that without this paradigm it is probable that an alternate view may take root in a society, one that is more favorable to the existence of noncompetitive rents, such as those granted by protectionist economic policies. The optimal paradigm, Porter points out, should not be confined to the upper echelons of a society but instead should permeate its entirety, including the working class. If this diffusion is absent, reforms favorable to higher productivity will probably face political opposition (pg. 571).

In order to take a mental temperature so speak, Newland uses

items included in the World Values Survey (WVS), an ongoing international poll conducted from 1981 to 2014 (when the most recent survey was published; a current one is not yet available). The WVS is a global collaborative effort aimed at learning the opinions of inhabitants of many nations of the world about a large set of topics. Via the construction of a comparative index, I used three items included in the WVS to study the presence and degree of a free-market or capitalist ideology (henceforth used as synonyms) in these nations over the course of the past two decades. I defined this mentality as one favorable to competition, to the action of private enterprise, and to the view that economic interaction generates wealth. Although the basic WVS questionnaire includes many other assertions that reflect a capitalist mindset, the fact that the answers are available for only some countries reduces the set that can be employed. Only four of the six WVS editions published up to 2014 include all three of the questions that I used to compose the FMMI: 1990, 1996, 2006, and 2012. There are twenty-seven countries in the 1990 sample, a figure that grows to fifty-eight for 2012. The indicator is fragile and based on a very limited set of variables, but I believe it reflects, perhaps roughly, the relative attitudes in different countries toward free markets and their evolution over time (pg. 572).

The results? The table below

clearly shows that a strong downward tendency in the support of capitalism occurred in the world between 1990 and 2012, with the global FMMI falling by 24 percent. This fall has been gradual and continuous and therefore cannot be attributed to the occurrence of the Great Recession of 2007–9. When data are separated by groups of nations, the negative trend is very clear in the case of formerly Communist countries, Latin America, and Africa. The result for the Sinosphere is more ambiguous and diverse: the score for Japan has grown over time, China shows some stability, and the values for South Korea have fallen. Marks for Europe have generally decayed, and the same has happened for the United States (pg. 575).

What makes this disturbing is the FMMI’s “weak, but positive correlation” with the Economic Freedom of the World Index. The comparison between the two indexes “shows that in general countries with a high pro-capitalist ideology also have freer and more competitive economies: Taiwan, the United States, New Zealand, Australia, Germany, Sweden, and Japan” (pg. 577). 

While the FMMI “is undoubtedly a rather crude measure,” it nonetheless “shows that an important global ideological shift has occurred since the late 1990s. From an initial situation of appreciation of the virtues of capitalism and competitive forces in the 1990s, much of the world has shifted to a greater faith in government intervention and regulation.” This is problematic, since the data also show that “a strong capitalist mentality coexists with (and probably generates) a favorable institutional framework, exemplified by many of the wealthiest countries in the world, such as the United States, Germany, and Japan” (pg. 579-580). Since institutions matter, this is a bit concerning. 

Demographics & Inequality: 2017 Edition

Every year, economist Mark Perry draws on Census Bureau reports to paint of picture of the demographics of inequality. Looking at 2017 data, he constructed the following table:

incomeinequality

Once again, he concludes,

Household demographics, including the average number of earners per household and the marital status, age, and education of householders are all very highly correlated with household income. Specifically, high-income households have a greater average number of income-earners than households in lower-income quintiles, and individuals in high-income households are far more likely than individuals in low-income households to be well-educated, married, working full-time, and in their prime earning years. In contrast, individuals in lower-income households are far more likely than their counterparts in higher-income households to be less-educated, working part-time, either very young (under 35 years) or very old (over 65 years), and living in single-parent or single households.

The good news is that the key demographic factors that explain differences in household income are not fixed over our lifetimes and are largely under our control (e.g., staying in school and graduating, getting and staying married, working full-time, etc.), which means that individuals and households are not destined to remain in a single income quintile forever. Fortunately, studies that track people over time indicate that individuals and households move up and down the income quintiles over their lifetimes, as the key demographic variables highlighted above change, see related CD posts herehere and here.

… It’s highly likely that most of today’s high-income, college-educated, married individuals who are now in their peak earning years were in a lower-income quintile in their prior, single, younger years before they acquired education and job experience. It’s also likely that individuals in today’s top income quintiles will move back down to a lower income quintile in the future during their retirement years, which is just part of the natural lifetime cycle of moving up and down the income quintiles for most Americans. So when we hear the media and progressives talk about an “income inequality crisis” in America, we should keep in mind that basic household demographics go a long way towards explaining the differences in household income in the United States. And because the key income-determining demographic variables are largely under our control and change dynamically over our lifetimes, income mobility and the American dream are still “alive and well” in the US.

Elsewhere, he reveals some rather good news from the same report:

These are his key takeaways:

  • The 1.8% gain in real median US household income last year brought median income to more than $61,000, the highest level ever recorded.
  • The income gain in 2017 was the fifth annual increase and the first period of five consecutive increases in median household income since the late 1990s.
  • Compared to 1975, the typical US household today has $12,464 more annual income (in 2017 dollars) or more than $1,000 more per month in real, inflation-adjusted dollars to spend on goods and services, many of which have become much more affordable today than in the 1970s (or weren’t even available then).
  • Adjusted for household size, which has been falling over time, real median household income per household member last year of $24,160 (in 2017 dollars) was the highest in history.
  • Real median income for married couples with both spouses working reached a new all-time record high last year of $111,000 and has more than doubled from $54,700 in 1963.
  • By three different measures — income shares of the top 5% and 20% and the Gini coefficient — there is no evidence of a significant rise in income inequality over the last 25 years; all three measures have been remarkably flat for more than two decades.
  • The share of US households with incomes of $100,000 or more (in 2017 dollars) reached a new record high of 29.2% last year, which is more than triple the share of households in 1967 with that level of income. At the same time, the share of US low-income households (real incomes of $35,000 or below) fell to a near-record low of 29.5%.
  • America’s middle-class is disappearing but into higher, not lower, income categories over time.

Diversity Is A Strength

Earlier this year, I highlighted some research on diversity and its relation to the immigration question. The Washington Post had a recent piece on Fox News anchor Tucker Carlson’s less-than-subtle anti-diversity views. Within the article, the author highlighted several studies on how diversity contributes to organizational well-being. I thought I’d dive into these studies for your reading pleasure.

One study from Cloverpop, as reported in Forbes

analyzed approximately 600 business decisions made by 200 different business teams in a wide variety of companies over two years, using the Cloverpop decision-making database. The full research results on inclusive decision making are available for download if you’d like to dive in. To topline it, our research shows a direct link between inclusive decision making and better business performance:

• Inclusive teams make better business decisions up to 87% of the time.

• Teams that follow an inclusive process make decisions 2X faster with 1/2 the meetings.

• Decisions made and executed by diverse teams delivered 60% better results.

… According to the research, teams outperform individual decision makers 66% of the time, and decision making improves as team diversity increases. Compared to individual decision makers, all-male teams make better business decisions 58% of the time, while gender diverse teams do so 73% of the time. Teams that also include a wide range of ages and different geographic locations make better business decisions 87% of the time.

… We also found that diverse groups are more likely to encounter operational friction when executing business decisions. In short, less diverse teams make worse decisions, and then diverse teams struggle to put their decisions into action. The worst situation is to have an all-male team make a decision that is executed by a gender-diverse group. This worst-of-both-worlds combination underperformed by 15%. In contrast, our analysis found that the most inclusive decision-making and execution teams performed 60% better than average.

A 2014 study reviewed the relevant literature and found the following benefits of diversity (while admitting that managing diversity is difficult, but doable):

Diversity stimulates innovation and productivity and creates a world class culture that can outperform the competition.

A multicultural organization is better suited to serve a diverse external clientele in a more increasingly global market. Such organizations have a better understanding of the requirements of the legal, political, social, economic and cultural environments of foreign nations (Adler, 1991).

In research-oriented and hi-tech industries, the broad base of talents generated by a gender-and ethnicdiverse organization becomes a priceless advantage. “Creativity thrives on diversity” (Morgan, 1989).

Multicultural organizations are found to be better at problem solving, possess better ability to extract expanded meanings, and are more likely to display multiple perspectives and interpretations in dealing with complex issues.

Organizations employing a diverse workforce can supply a greater variety of solutions to problems in service, sourcing, and allocation of resources.

Employees from diverse backgrounds bring individual talents and experiences in suggesting ideas that are flexible in adapting to fluctuating markets and customer demands.

A diverse collection of skills and experiences (e.g. languages, cultural understanding) allows a company to provide service to customers on a global basis.

A diverse workforce that feels comfortable communicating varying poitns of view provides a larger pool of ideas and experiences (pg. 83).

Finally, a 2016 Harvard Business Review article provides a nice rundown of several important studies on diversity:

A 2015 McKinsey report on 366 public companies found that those in the top quartile for ethnic and racial diversity in management were 35% more likely to have financial returns above their industry mean, and those in the top quartile for gender diversity were 15% more likely to have returns above the industry mean.

In a global analysis of 2,400 companies conducted by Credit Suisse, organizations with at least one female board member yielded higher return on equity and higher net income growth than those that did not have any women on the board.

… People from diverse backgrounds might actually alter the behavior of a group’s social majority in ways that lead to improved and more accurate group thinking. In a study published in the Journal of Personality and Social Psychology, scientists assigned 200 people to six-person mock jury panels whose members were either all white or included four white and two black participants. The people were shown a video of a trial of a black defendant and white victims. They then had to decide whether the defendant was guilty. 

It turned out that the diverse panels raised more facts related to the case than homogenous panels and made fewer factual errors while discussing available evidence. If errors did occur, they were more likely to be corrected during deliberation. One possible reason for this difference was that white jurors on diverse panels recalled evidence more accurately.

Other studies have yielded similar results. In a series of experiments conducted in Texas and Singapore, scientists put financially literate people in simulated markets and asked them to price stocks. The participants were placed in either ethnically diverse or homogenous teams. The researchers found that individuals who were part of the diverse teams were 58% more likely to price stocks correctly, whereas those in homogenous groups were more prone to pricing errors, according to the study, published in the journal PNAS. Diverse teams are more likely to constantly reexamine facts and remain objective. They may also encourage greater scrutiny of each member’s actions, keeping their joint cognitive resources sharp and vigilant.

… Greater diversity may also change the way that entire teams digest information needed to make the best decisions. In a study published in the Personality and Social Psychology Bulletin, Katherine Phillips of Northwestern University and her team divided sorority or fraternity members into four-member groups, each of which had to read interviews conducted by a detective investigating a murder. Three people in every group, referred to as “oldtimers” in the study, came from the same sorority or fraternity, whereas the fourth, the so-called “newcomer,” was either a member of the same sorority or fraternity or a different one. The three oldtimers in each group gathered to decide who was the most likely murder suspect. Five minutes into their discussion, the newcomer joined the deliberation and expressed their opinion as to who the suspect was. It turned out that although groups with out-group newcomers felt less confident about the accuracy of their joint decisions, they were more likely to guess who the correct suspect was than those with newcomers who belonged to the same group.

…In a study published in Innovation: Management, Policy & Practice, the authors analyzed levels of gender diversity in research and development teams from 4,277 companies in Spain. Using statistical models, they found that companies with more women were more likely to introduce radical new innovations into the market over a two-year period.

In another study, published in Economic Geography, the authors concluded that increased cultural diversity is a boon to innovativeness. They pooled data on 7,615 firms that participated in the London Annual Business Survey, a questionnaire conducted with the UK capital’s executives that asks a number of questions about their companies’ performance. The results revealed that businesses run by culturally diverse leadership teams were more likely to develop new products than those with homogenous leadership.

Though you may feel more at ease working with people who share your background, don’t be fooled by your comfort. Hiring individuals who do not look, talk, or think like you can allow you to dodge the costly pitfalls of conformity, which discourages innovative thinking.

“How, precisely, is diversity our strength,” you ask, Tucker? See above. And see here, here, and here.

Institutions Matter

From a recent St. Louis Fed study

Using cross-country analysis, we find that a key factor for fast-growing countries to grow faster than the United States and for trapped economies to grow slower than the United States is the relative TFP, which may be technology driven and not related to institutional barriers.  Yet more-severe institutional barriers in the lag-behind countries actually hinder the process of structural transformation and economic development, causing these countries to fall behind the fast-growing economies despite having similar or even better initial states five decades ago. Overall, we find that institutional barriers have played the most important role, accounting for more than half the economic growth in fast-growing and trapped economies and for more than 100 percent of the economic growth in the lag-behind countries. By conducting country studies, we identify that unnecessary protectionism, government misallocation, corruption, and financial instability have been key institutional barriers causing countries to either fall into the poverty trap or lag behind without a sustainable growth engine. Such barriers have created frictions or distortions to capital markets, trade, and industrialization, subsequently preventing these countries from advancing (pg. 260-261).

Economist Linda Yueh explains why institutions are important for economic growth:

Research by the OECD estimates that by 2030, for the first time in history, more than half of the world’s population will be middle class (OECD 2012). That’s 4.9 billion out of an estimated 8.6 billion people. In 2009 1.8 billion (out of around 7 billion) people earned between $10 and $100 per day, a measure of the income that defines the new global middle class. That’s enough to buy a refrigerator, adjusted for what a dollar buys in their countries.

Based on current trends, in 2030 around two-thirds of the middle classes worldwide – nearly 3 billion people – will be in Asia. The UN describes it as a historic shift not seen for 150 years (Yueh 2018). The European and North American middle classes will fall from more than half of that class’s world total to one-third.

How has this been achieved? Possessing good institutions is what economists have come to focus on and the spread of such institutions seems to have been key, as the father of New Institutional Economics predicted. The seminal work in this area was by Douglass North who was frustrated by neoclassical economic models that focused on measurable factors like workers and investment, with attempts to measuring technological progress, even though they could not fully explain why some economies grow well and others do not.

So, North took economics out of its comfort zone, which consisted of examining more easily measured inputs like labour and capital, and instead brought in politics, psychology, and strategy, as well as history, in order to understand why some countries succeed and others fail. He stressed that there was no reason why countries could not learn from more successful economies to better their own institutions. That finally happened in the 1990s.

In the early 1990s, China, India, and Eastern Europe changed course. China and India re-oriented their economies outward to integrate with the world economy, while Eastern Europe shed the old communist institutions and adopted market economies. In other words, having tried central planning (in China and the former Soviet Union) and import substitution industrialisation (in India), these economies abandoned their old approaches and adopted as well as adapted the economic policies of more successful economies. For instance, China, which has accounted for the bulk of poverty reduction since 1990, undertook an ‘open door’ policy that sought to integrate into global production chains which increased competition into its economy that had been dominated by state-owned enterprises. India likewise abandoned its previous protectionist policies and embraced exports to a greater extent. The wholesale transformation of the economic system was of course in Central and Eastern Europe. Communism gave way to capitalism, with these nations adopting entirely new institutions that re-geared their economies toward the market and many joining the EU.

Thus, the 1990s witnessed the rapid growth of emerging economies whose growth via industrialisation eventually led to an extraordinary commodity super-cycle due to their voracious demand for raw materials to fuel their development. As many of these economies, especially China, have become middle-income countries, their economic growth is slowing down. And they may slow down so far that they never become rich. But, their collective growth has lifted a billion people of out of extreme poverty, and the UN hopes that their continued growth will lead to the end of abject poverty in the next decade or so, which would be a historic achievement. That would realise the first of the Sustainable Development Goals adopted by every nation around the world to end extreme poverty – i.e. those earning less than $1.90 per day adjusted for what a dollar buys in their country – by 2030.

Institutions matter.

Does the U.S. Subsidize Global Health Care?

From a USC study earlier this year:

What we pay for medicines today affects the number and kinds of drugs discovered tomorrow. Empirical research has established that drug development activity is sensitive to expected future revenues in the market for those drugs. The most recent evidence suggests that it takes $2.5 billion in additional drug revenue to spur one new drug approval, based on data from 1997 to 2007.

Another study assesses the Orphan Drug Act, passed in 1982 to stimulate development of treatments for rare diseases. Its key feature was the granting of market exclusivity that would restrict entry by competitors— in other words, allow for higher prices. The result was a dramatic increase in the number of compounds brought into development to treat rare diseases (figure 3). This linkage may not help patients with tuberculosis today in Nigeria and Indonesia — two poor countries hardest hit by tuberculosis—but it is currently benefiting patients in the same countries who have HIV. Decades ago, demand for HIV treatment in wealthy countries spurred medical breakthroughs that have since found their way — albeit more slowly than we would like — into the poorest corners of the globe. As of July 2017, 20.9 million people living with HIV were accessing antiretroviral therapy globally; 60 percent of them live in eastern and southern Africa.

American consumers may feel some philanthropic pride about the benefits they have spurred for the world’s poorest HIV patients. But similar benefits are also enjoyed by German, British, and French HIV patients, and were financed by the same revenues generated, in large part, by high American drug prices. Whether one sees this as philanthropy on the part of American drug buyers, or free-riding on the part of other wealthy countries who pay much less for the same drugs, America clearly contributes more to pharmaceutical revenue, and hence incentives for new drug development, than its income and population size would suggest (pg. 2).

The study goes on to point out that Americans pay 3 times as much on drugs as Europeans and 90% more as a share of income. American consumers “account for about 64 to 78 percent of total pharmaceutical profits, despite accounting for only 27 percent of global income…American patients use newer drugs and face higher prices than patients in other countries” (pg. 2-3). Most policy discussions focus on lowering American prices. But what if we instead raised European prices? The researchers write,

Increasing European prices by 20 percent — just part of the total gap — would result in substantially more drug discovery worldwide, assuming that the marginal impact of additional investments is constant. These new drugs lead to higher-quality and longer lives that benefit everyone. After accounting for the value of these health gains — and netting out the extra spending — such a European price increase would lead to $10 trillion in welfare gains for Americans over the next 50 years. But Europeans would also be better off in the long run, by $7.5 trillion, weighted towards future generations. This is because European populations are rapidly aging, and they need new drugs too…At the end of the day…evidence conclusively demonstrates that higher expected revenues leads to more drug discovery, with the most recent numbers suggesting that on average every $2.5 billion of additional revenue leads to a new drug approval (pg. 4).

In short, “if other wealthy countries shouldered more of the burden for medical innovation, both American and European patients would benefit” (pg. 5). Recent research confirms that the difference between U.S. and European healthcare is driven mainly by prices. The authors suggest that more can be done through trade, international harmonization of regulatory standards, and further research on the costs of free-riding. “As incomes in less-developed countries rise,” they conclude, “they will face the challenges of fighting conditions like diabetes, heart disease, and even dementia. Spending a bit more now to ensure their populations have access to effective treatment is in everyone’s interest (pg. 5).

Medical innovations are vital to increased well-being and the U.S. dominates in this arena.

Drug Discovery, 1996-2017
Medical Laboratory Technology, 1996-2017
Medicine, 1996-2017

Even when compared to the European Union as a whole, the United States still comes out on top.

As the authors of the two graphs above explain,

Although many factors are surely relevant, one likely contributor is differences in monetary compensation. Other things being equal, individuals and firms will tend to invest more in medical innovation when (a) they expect a larger return; (b) the returns will last for a longer period of time; and (c) the returns arrive sooner rather than later…Americans pay more for pharmaceuticals because of the nature of our health care system. Single-payer and other centrally organized health care systems, like those in much of Europe, are characterized by a great deal of monopsony (buyer) power that pushes down compensation…In addition to pushing down prices, centrally organized health care systems also limit the use of new drugs, technologies, and procedures. Those systems “control costs by upstream limits on physician supply and specialization, technology diffusion, capital expenditures, hospital budgets, and professional fees.” The result is that those countries use new innovations less extensively than the United States (pg. 8).

They conclude (and I agree), “The healthcare debate should address more than just covering the uninsured and controlling costs. It should also consider whether proposed policies will promote or hinder the ability of creative individuals to innovate” (pg. 11).

Does Immigration Increase Income Inequality?

Image result for immigrants

According to Harvard economist Edward Glaeser,

Cities aren’t full of poor people because cities make people poor, but because cities attract poor people with the prospect of improving their lot in life. The poverty rate among recent arrivals to big cities is higher than the poverty rate of long-term residents, which suggests that, over time, city dwellers’ fortunes can improve considerably. The poorer people who come to cities from other places aren’t mad or mistaken. They flock to urban areas because cities offer advantages they couldn’t find in their previous homes…The absence of poor people in an area is a signal that it lacks something important, like affordable housing or public transportation or jobs for the least skilled. The great urban poverty paradox is that if a city improves life for poor people currently living there by improving public schools or mass transit, that city will attract more poor people.[ref]The Triumph of the City, pg. 70-71.[/ref]

In short, “The flow of less advantaged people into cities from Rio to Rotterdam demonstrates urban strength, not weakness…Urban poverty should be judged not relative to urban wealth but relative to rural poverty.”[ref]Ibid., pg. 9-10.[/ref] In my view, Glaeser’s insight is incredibly important. Not only does it stress the need for proper comparisons, but also highlights the difference between absolute mobility and relative inequality. This indicates that if city officials were to focus solely on the poverty rate or level of inequality within their cities without tracking mobility and length of residency, they could very well be misdiagnosing the situation.[ref]Andreas Bergh and Therese Nilsson have made similar observations about inequality and poverty.[/ref]

I think a similar approach can be taken concerning poverty and inequality within the United States. What if inequality in the United States isn’t necessarily because of some abstraction like “the rich,”[ref]Not to make light of powerful groups who do capture segments of the economy.[/ref] but is due to the amount of low-income immigrants we’ve taken in over the last several decades? Yes, within-country inequality has grown, but is it in part due to low-skill, low-education workers escaping the poverty of their origin countries and becoming better off by coming here (therefore, lowering between-country inequality)?

A new paper from Mission Foods Texas-Mexico Center at SMU explores the effects of immigration on inequality. After reviewing the economic literature, the authors conclude

that low-skilled immigration to the U.S., much of it from Mexico, has only played a minor role in rising income and wage inequality. To the extent that there is an effect, it has come through the presence of immigrants, and less as a result of immigration’s effect on natives’ wages. Immigrants’ bimodal skill distribution, with clustering at the top and bottom of the U.S. skill distribution, has widened the overall income distribution slightly. At the same time, low-skilled immigration to the U.S., and migrants’ remittances, have played a large role in lowering global inequality by moving millions of low-income Mexican families further away from poverty and closer to the global middle class.

Migration from poor to rich countries represents a reallocation of labor that increases the wage of the migrant while also raising wages in the sending country. It moves labor to capital-rich countries where businesses readily employ it. Productivity and output rise. As long as business investment responds to the worker influx, wage effects on native workers will be limited. Migration is the last frontier of globalization. Removing barriers to international mobility would result in large economic gains that far outweigh any costs (pg. 11-12).[ref]You can find a brief overview of the paper here.[/ref]

Though it only plays a small role, immigration has increased inequality within the U.S. because poor non-citizens became less poor. Elsewhere, Pia Orrenius–vice president and senior economist at the Federal Reserve Bank of Dallas and one of the authors of the paper above–explains further:

We surveyed the literature that’s out there and we found two high quality studies that showed that all this out migration from Mexico has actually increased wages in Mexico. That is consistent with economic theory. If there’s fewer workers they should command a higher return…You might think that if migration raises wages in Mexico, it should lower them in the U.S. But what the surveys of literature say is that there’s actually only a very small impact on the wages of native workers in terms of the competition with immigrants, and there’s many reasons for that. The main reason is that there really aren’t a lot of low-skilled workers in the U.S. who compete with immigrants. You’re looking at a small and shrinking group of workers and so there’s not a lot of effect there.

Where we did see an impact is on the income distribution. When Mexican immigrants come in, for example, they have very low levels of education and so they come into the U.S. and they initially earn very low wages. So just by virtue of them coming into the country they’re actually broadening the income distribution by coming into the low end. So just mechanically there’s more income inequality because they’re coming in at very low wage jobs that generally Americans are not filling.

So there’s a mechanical reasoning for the increase in income inequality that’s partly related to migration, but generally we found in looking at the literature the bigger reasons are what’s called routine bias technological change and the hollowing out of the middle of the income distribution. And that’s due to technological change and the replacement of workers and routine-based occupations. We call that labor market polarization.

Labor market polarization or the hollowing out of the middle class is not consistent with migration from Mexico because again immigration from Mexico is coming in at the very low end of the distribution. So that’s how we concluded that there’s a lot going on here, but generally the main driver for income inequality in the U.S. and other countries is not low-skilled immigration.

…The other thing that we noted, and this is actually really important, is that if we’re looking at income inequality in the United States or in western Europe, yes you do see increasing income inequality. We’re unhappy with that—obviously that isn’t something that people want to see. But what we urge people to do in the paper is to look at the global income inequality. Thanks to globalization, we’ve actually seen falling income inequality in the world. So the world as a whole is better and better and better off. We’re richer as a world; we’re less unequal as a world, thanks to all of these trends that are going on. So what’s going on in the world globally is not the same as what’s going on in these individual countries.

It’s very important to remember that some of these trends that we see as negative in the U.S. are actually positive globally because they’ve allowed the poorest people in the world, like the people in India, the people in China to come out of abject poverty and actually join at least the lower middle class or the middle class.

The globalization of capital and labor may contribute to inequality within rich countries, but it’s making the world as a whole a more equal place.

Immigration, Ignorance, and Redistribution

The link between political ignorance, immigration policy preferences, and support for redistribution are well-established. I’ve shared this portion from my BYU Studies Quarterly article before, but it’s worth repeating:

A particularly interesting aspect of public attitudes toward immigration is that of political ignoranceMultiple studies have shown that political ignorance is rampant among average voters, and this holds true when it comes to immigration policy. As legal scholar Ilya Somin explains, “Immigration restriction . . . is one that has long-standing associations with political ignorance. In both the United States and Europe,survey data suggest that it is strongly correlated with overestimation of the proportion of immigrants in the population, lack of sophistication in making judgments about the economic costs and benefits of immigration, and general xenophobic attitudes toward foreigners. By contrast, studies show that there is little correlation between opposition to immigration and exposure to labor market competition from recent immigrants.” One pair of economists found that those voting to leave the European Union in the Brexit referendum, who were motivated largely by a desire to restrict immigration, “were overwhelmingly more likely to live in areas with very low levels of migration.” Similarlyvoters who supported Donald Trump during the US election were more likely to oppose liberalizing immigration laws (even compared to other Republicans), but least likely to live in racially diverse neighborhoods. In short, both political ignorance and lack of interaction with foreigners tend to inflame anti-immigration sentiments. These sentiments are what George Mason University economist Bryan Caplan refers to as antiforeign bias: “a tendency to underestimate the economic benefits of interaction with foreigners.” In fact, economists take nearly the opposite view from the general public on immigration (pgs. 80-82).

In regards to immigrants’ impact on welfare and the fiscal budget, I wrote,

A 2017 literature review by the National Academy of Sciences finds that the “fiscal impacts of immigrants are generally positive at the federal level and negative at the state and local levels” because state and local governments are the main providers of education benefits. Thee authors of the review are also quick to point out,“the net fiscal impact for any U.S. resident, immigrant or native-born,  is negative. When fiscal sustainability is assumed to result in future spending cuts and tax increases, immigrants are more valuable than native-born Americans (that is, their net fiscal impact is greater in a positive direction).” These findings echo those of [Alex] Nowrasteh’s review of the literature. According to Nowrasteh, between 1950 and 2000, “immigration grew the US economy and produced more net tax revenue. . . . The low-skilled first generation consumed more welfare than they paid in taxes,but their descendants more than compensated for that initial deficit by producing a more positive dependency ratio for entitlement pro-grams, leading to a slightly positive contribution to the federal budget in the long run.” While many economic models “find that immigrants slightly diminish net tax revenue for state and local governments,” they increase the federal net tax revenue by more than the state and local decrease. Furthermore, “there is little evidence that migrants choose their state destination based on the generosity of the welfare system. . . .New immigrants are mainly choosing to reside in states with low levels of social welfare spending and growing economies and are moving away from states with high levels of social welfare spending and low economic growth.” Nonetheless, even if welfare spending did increase due to immigration (evidence suggests quite the opposite), this would be an argument for increasing restrictions on welfare, not immigrationOverall, as Nowrasteh concludes, “The economic benefits of immigration are unambiguous and large, but the fiscal effects are dependent upon the specifics of government policy over a long time period, which means that the net fiscal impact of immigration could be negative while the economic benefit is simultaneously positive. Looking at the results of all of these studies, the fiscal impacts of immigration are mostly positive, but they are all relatively small” (pgs. 99-100).

A recent study provides further support for these findings:

In a recent study (Alesina et al. 2018) we used commercial market research companies to run a large-scale survey and experiment on a representative sample of more than 22,000 natives in six countries: France, Germany, Italy, Sweden, the UK, and the US, mostly between January and March 2018. The sample countries were chosen because they have different economic and social systems, but all have recently faced policy challenges around immigration…In five of the six countries, the average native believed that there are between two and three times as many immigrants as there are in reality. For instance, in the US legal immigrants are about 10% of the population, but US respondents thought the figure was 30%. Similar gaps existed in Germany, France, Italy, and the UK. In Sweden, the country with the highest proportion of immigrants, the public perception of 27% was closest to the true share (18%).

Natives also got the origins of immigrants wrong. They particularly overestimated the shares of immigrants coming from regions that have recently been described as ‘problematic’ in the media, and the share of non-Christian immigrants – Christianity being the mainstream religion in their country. In all countries except France, respondents overestimated the share of Muslim immigrants. The US and Sweden had the biggest misperception. In the US, respondents thought the share of Muslim immigrants was 23% when in reality it is 10%, and in Sweden they believed the share was 45%, when it is 27%. In the UK, Italy, and Germany, this overestimation ranged from 10 to 14 percentage points. In all countries, including France, respondents underestimated the share of Christian immigrants by at least 20 percentage points. For instance, US respondents thought that 40% of immigrants were Christian, when 61% are. UK respondents believed 30% of immigrants were Christian, when the true figure is 58%. 

In all countries, immigrants were viewed as poorer, less educated, and more likely to be unemployed than is the case. For instance, US natives believed that 35% of immigrants lived below the poverty line, while the real number is less than 14%. Natives also believed that immigrants relied heavily on the welfare state, with roughly one-third of all US, Italian, and French respondents, and one-fifth of all UK and German respondents, believing that an immigrant would receive more benefits than a native, even if both had exactly same income, family structure, age, and occupation. A large share of respondents also thought that immigrants were poor mainly because of lack of effort, rather than adverse circumstances.

These misperceptions were widely spread across all countries and groups of respondents. They were larger for respondents who are not college educated, who said they supported right-wing parties, or who worked in low-skilled occupations in immigration-intensive sectors. Respondents who personally knew an immigrant had less biased perceptions. Respondents in all countries also greatly exaggerated the share of immigrants among the poor or the low-educated. For example, US respondents thought that 37% of the poor were immigrants; the true number is 12%. 

These skewed perceptions may lead natives to conclude that immigrants are a burden on the public finances of their country, and that they disproportionately benefit from redistribution. In fact, there is a strong negative correlation between the perceived share of poor who are immigrants and support for redistribution. This was captured by a redistribution support index that summarised the answers to all redistribution-related questions. Respondents who perceived that a larger share of the poor were immigrants supported less redistribution, even controlling for a detailed set of personal characteristics. Similarly, respondents who supported more immigration overall, as captured by an immigration support index that aggregated the answers to all questions related to attitudes towards immigration, also supported more redistribution.

The authors also found that “simply making respondents think about immigrants and their characteristics made respondents much more averse to redistribution. These respondents also decreased their actual out-of-pocket donations to charities that support low-income groups but do not target immigrants.” The good news is that accurate information regarding “the true characteristics of immigrants – their share, their origins, and their work ethic…significantly increased support for immigration policies.” For example, “Showing the respondents a day in the life of a hard-working immigrant fostered support for redistribution – confirming the importance of views about effort and ‘deservingness’ of the poor, as highlighted in the case of poor natives in Alesina and Glaeser (2004) and Alesina et al. (2018). But the experiments that showed respondents the true share and origins of immigrants did not generate significantly more support for redistribution.” Unfortunately, “negative priors dominated in subsequent answers to redistribution questions, even when they also received favourable information about immigrants.”

It’s an uphill battle.