Link collection: America’s Gun Debate

In the last week or two I’ve read (or at least skimmed) a lot of interesting pieces on guns, gun crime, gun control, etc. Below are most of the links, listed in order of their publication date. I don’t necessarily agree with or endorse everything in each link (obviously, since some of them are directly contradicting each other), but they gave me a lot to think about, so I’m including them here if anyone else wants to read more.

2013:
Analysis of Recent Mass Shootings – National Criminal Justice Reference Service, 2013; Study found that up to 77% of mass shootings did not involve an assault weapon or even a high capacity weapon.
Reducing Gun Violence in America – Center for Gun Policy and Research, 2013; This link is to an entire book. I read the forward, in which the authors make the following suggestions:

  1. Require background checks for all gun sales, including private sales at gun shows and online,
  2. Make gun trafficking a federal crime,
  3. Limit the availability of military-style weapons and of high-capacity magazines with more than 10 rounds,
  4. Have all federal agencies to submit their relevant data to the national gun background check database,
  5. Have the Justice Department to make a priority of prosecuting convicted criminals who provide false personal information during gun purchase background checks,
  6. Make a recess appointment to get someone to head the Federal Bureau of Alcohol, Tobacco, Firearms and Explosives, and
  7. Stop supporting the Tiahrt order, which keeps the public in the dark about who gun traffickers are and how they operate.

Guns and School Safety Survey Results – School Improvement Network, January 23, 2013; a little over 1 in 8 educators (13.5%) both own a firearm and would bring it to school if they were allowed to.
Guns In Schools: Firearms Already Allowed In 18 States With Few Restrictions – Huffington Post, March 17, 2013
Police Gun Control Survey: Are legally-armed citizens the best solution to gun violence? – PoliceOne.com, April 8, 2013;

  • 91% of LEOs didn’t believe an assault weapons ban would help,
  • 91% supported conceal and carry permits for civilians,
  • 86% believed casualties would be reduced at recent mass shootings if armed civilians had been present, and
  • 81% were in favor of arming teachers and school administrators who had been properly trained.

Colorado’s school shooting — over in 80 seconds – CNN, December 15, 2013; An armed Student Resources Officer responded immediately to a school shooter.

2015:
Comparing Death Rates from Mass Public Shootings and Mass Public Violence in the US and Europe – Crime Prevention Research Center, June 23, 2015
Here’s where you’re most likely to own a gun – Business Insider, July 3, 2015; Alaska has the highest percentage of gun ownership; Delaware has the lowest.

2016:
13 Charts Put America’s Gun Violence in Perspective – Independent Journal Review, January 8, 2016
Across the country, school districts are quietly arming teachers for the next shooting – The Washington Post, April 14, 2016
The Media Keeps Misfiring When It Writes About Guns – Slate, June 26, 2016
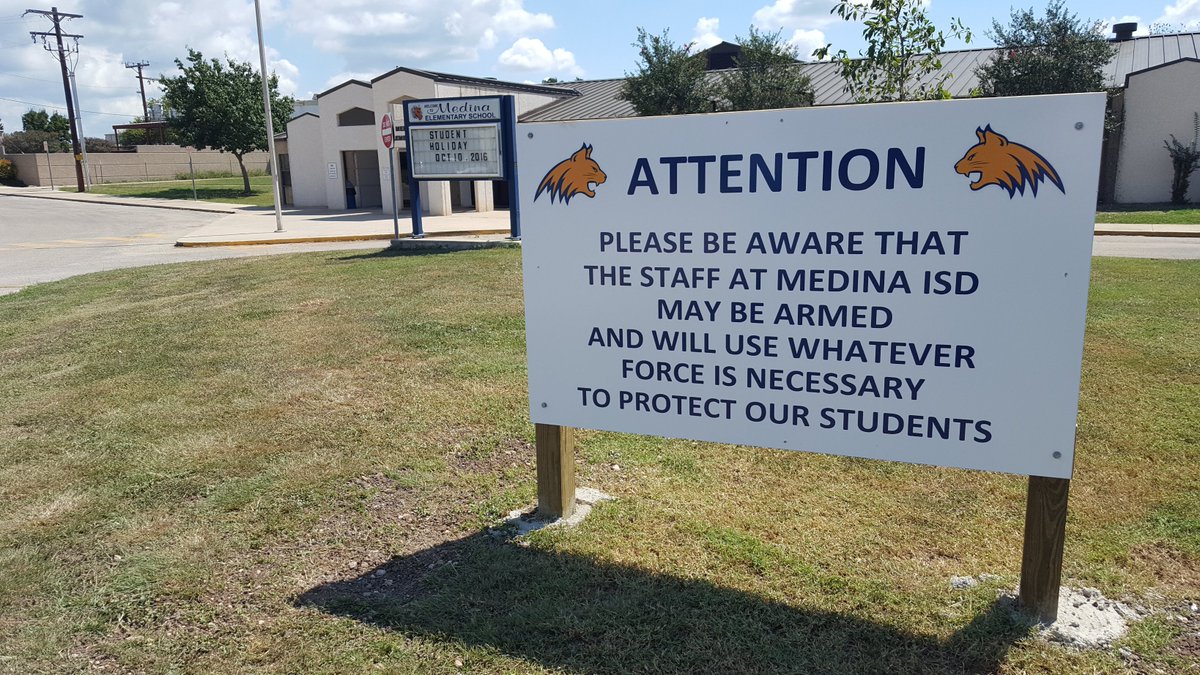
Texas school warns: Our teachers ‘may be armed and will use whatever force is necessary’ to protect students – The Washington Post, September 22, 2016
Firearms on College Campuses: Research Evidence and Policy Implications – Johns Hopkins Bloomberg School of Public Health, October 15, 2016; Table 1 summarizes State Campus Carry laws
What Conservatives Get Right About Guns – GQ, October 28, 2016

2017:
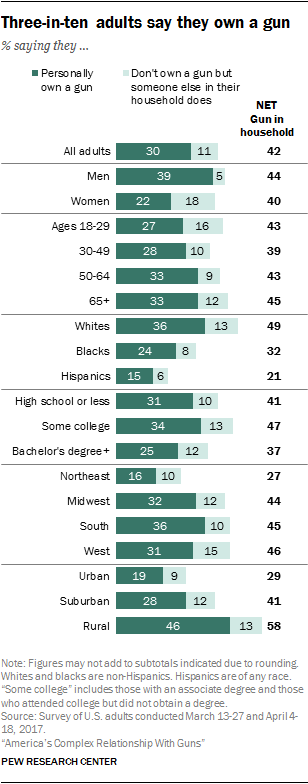
America’s Complex Relationship With Guns – Pew Research Center, June 22, 2017
Illinois school where teacher took down gunman recently trained for active shooters – CBS, September 22, 2017; An unarmed teacher stopped a gunman.
How to Reduce Mass Shooting Deaths? Experts Rank Gun Laws – New York Times, October 5, 2017; Experts ranked assault weapons bans as slightly more effective than a ban on all semiautomatic guns.
6 Reasons Your Right-Wing Friend Isn’t Coming To Your Side On Gun Control – The Federalist, October 6, 2017
Supporters of stricter gun laws are less likely to contact elected officials – Pew Research Center, October 12, 2017

2018:
Background Checks Are Not the Answer to Gun Violence – New York Times, February 12, 2018
US Mass Shootings, 1982-2018: Data From Mother Jones’ Investigation – Mother Jones, February 14, 2018
Why The AR-15 Is America’s Rifle – NPR, February 15, 2018
“Fuck you, I like guns.” – AgingMillennialEngineer.com, February 15, 2018
An ‘Assault Weapon’ Ban Won’t Stop Mass Shootings – Reason, February 15, 2018
How white nationalists fooled the media about Florida shooter – Politico, February 16, 2018
Disarming ‘Individuals With Mental Illness’ Would Affect a Quarter of the Population – Reason, February 16, 2018
Texas Teachers Can Pack Heat; Florida Lawmakers Pushing For Options – WFMY News, February 17, 2018
Gun Rights Expand Even as Mass Shootings Spur Calls for Stricter Laws – Wall Street Journal, February 18, 2018
A Cure for Mass Shootings Doesn’t Exist – Reason, February 18, 2018; The author explains why he doesn’t believe an assault weapons ban, background checks for private sales, and broadening the exclusion for mental health problems would curtail mass shootings.
Real Solutions for Curtailing Gun Violence – The Wall Street Journal, February 20, 2018; The author suggests dramatically increasing penalties for stealing a firearm, enforcing laws against straw purchases of handguns, and finding practical, legal ways of stoppping people with mentall illness from purchasing firearms.
Mass Shooting Survivors Come Out Against Gun Control Too – The Jack News, February 22, 2018
In 2017, Americans narrowly opposed allowing teachers and school officials to carry guns – Pew Research Center, February 23, 2018
Poll: Support for stricter gun laws rises; divisions on arming teachers – CBS, February 23, 2018
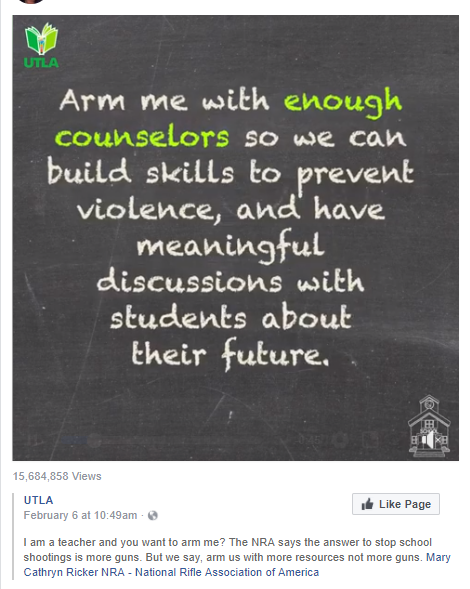
The case against arming teachers – Vox, February 23, 2018
Sources: Coral Springs police upset at some Broward deputies for not entering school – CNN, February 24, 2018
What Critics Don’t Understand About Gun Culture – The Atlantic, February 27, 2018

Click on the image to go to the Pew Research Center’s report.

How difficult would it be to arm teachers?

Recently a friend of mine shared this post in which Jim Wright asks a few “basic questions” about how we would arm teachers. Wright suggests it would be essentially impossible to properly train teachers to respond to school shootings, saying even our soldiers aren’t trained to handle such a situation. He asks who will pay for the training, who the teachers will answer to, which weapons will be allowed, what insurance the school will acquire, and whether a teacher will be held liable for mistakenly shooting an innocent bystander or for failing to stop an active shooter. He claims “the hole is bottomless,” concluding:

I’m asking BASIC questions about this idea of arming up teachers and putting amateurs with guns in schools. Questions that any competent gun operator should ask. You want to put more guns, carried by amateurs, into a building packed full of children. I don’t think I’m being unreasonable here.

Wright is reflecting the skepticism and indignance of many people. In particular some of my friends who are teachers have made posts clearly stating they do not want to carry weapons to school and are dismayed by the thought. More than one of them have shared this video in response.

Click the image to see the public video on Facebook.

Several go beyond saying they personally don’t want to carry weapons to asserting no one else should have firearms on school property either, often making demands along the lines “Don’t bring more guns into my school.”

Two quick notes on that last part:

  1. Assuming any increase in quantity of guns means an increase in danger seems simplistic to me. More guns can increase or decrease danger depending on who is carrying them and why. A gun in the hands of a kid hoping to kill as many people as possible is not equivalent to a gun in the hands of a trained Student Resources Officer or conceal carry permit holder hoping to keep as many people alive as possible.
  2. In this context, the phrase “my school” is off-putting. Schools don’t belong only to the teachers working in them; they also belong to the children attending and the parents of those children, especially when we are discussing the best ways to protect our children. I understand there are many parents who do not want armed school staff. And there are many parents who do, like me.[ref]According to a recent CBS poll, 44% of those polled favored arming teachers, and 50% opposed the idea. With a margin of error of plus or minus 4 points, it’s a statistical tie. Last year Pew Research Center found similar numbers, notably with no difference in views between parents and non-parents.[/ref] My point here is not that the answer is simple, obvious, or unified; my point is teachers don’t have the only say in this debate.[ref]And I would feel the same way if it was primarily teachers who wanted to bring firearms to school and parents who objected. It’s not about the teachers’ specific stances; it’s about the idea that parents get say over how their children are protected.[/ref]

Anyway, the objections to arming teachers seem to make several assumptions:

    1. We don’t have the resources to arm teachers.
    2. The logistics of arming teachers are too difficult to disentangle.
    3. Teachers don’t want to be armed.[ref]Update, 2/26/18: A 2013 poll of 11,000 educators found that 36.3% of educators own a firearm, and 37.1% of that group would be likely to bring the firearm to school if allowed. In other words, a little over 1 in 8 educators both own firearms and would like to be able to carry at school.[/ref]
    4. Armed teachers would make schools less safe, not more safe.

In terms of the law, as of May 2016, there were 17 states that banned conceal carry guns on college campuses; 1 state (Tennessee) banned students and the public from carryng guns on campus but allowed faculty members to do so; 8 states allowed conceal carry guns; and the remaining 24 states left the decision to the school. Of course this information is for only college campuses, not K-12 schools.[ref]I’ve yet to find a source summarizing state-by-state policy on K-12 schools. If you know of one, please share.[/ref]

Given the option, many school districts already allow their teachers to be armed. This fact alone puts the first three assumptions to rest. Apparently resources, logistics, and desire were not dealbreakers in arranging to have armed school employees on campus. Here is an excerpt from a 2016 Washington Post article:

The Kingsburg Joint Union High School District in Kingsburg, Ca., is the latest district to pass such a measure. At a school board meeting on Monday, the Fresno Bee reported, members unanimously approved a policy that allows district employees to carry a concealed firearm within school bounds.

The employees will be selected by the superintendent, and will have to complete a training and evaluation process. The new policy was made effective immediately.

While proposals to arm teachers have been familiar refrains in Texas and Indiana, the passing of such a mandate on the West Coast signals that the strategy is being considered elsewhere in the country.

In fact, the Folsom Cordova Unified School District covering the cities of Folsom, Rancho Cordova and Mather, Calif., has allowed employees to bring guns to school since 2010, but only revealed the policy to parents last month.

Some people against the idea of arming teachers say it will create an intimidating environment for kids, but note Folsom Cordova’s school district allowed it for 5-6 years before anyone even knew about it. Arming teachers had so little impact on the daily school environment people couldn’t even tell it had happened.

In the wake of the most recent shooting, more school boards are following suit, voting unanimously to allow trained employees to carry concealed weapons.

People opposed to arming teachers seem to envision a bureaucratic and expensive process that results in an intimidating environment where teachers nervously walk the hallways with rifles over their shoulders. The reality is that arming teachers has so far consisted of allowing those who want to be armed to first get training and then either carry concealed weapons or keep weapons locked in safes. From what I can tell, the individuals who want to be armed cover the costs of the training, permit, and firearm themselves. Again, the school’s resources, logistics, and the teacher’s desire don’t seem to be issues.

To my mind, the only real issue is the question of whether allowing teachers to carry concealed weapons will overall increase or decrease student and staff safety. Despite how horrifying school shootings are, they are also exceedingly rare. And while I have no specific data on this, I suspect that even if firearms were permitted on all schools across the country, relatively few teachers and other school staff would choose to carry them. The odds seem very low of a school shooting happening in such a way that an armed staff member would even be present to react. Meanwhile, having legal guns on campus opens the door to accidental injuries. Some of my friends against armed school staff have posted stories about teachers forgetting their firearm or having it stolen while on school property.[ref]It looks like both incidents involved teachers bringing firearms to school without permission, and it’s unclear what training either teacher had. Still, it’s also possible for a trained concealed carry holder to make a mistake.[/ref] There’s a cost-benefit question here: if arming teachers increases the chances of accidentally injuring or even killing students but also increases the chances of saving lives during school shootings, how do we quantify those two factors and weigh them against each other?

I know of no hard data here. We do know that in our country, in general, guns are used more often in accidental deaths than in justifiable homicide. However we aren’t just considering accidental deaths but also accidental injuries, and we aren’t just considering justifiable homicide but also self-defense that involves injuring but not killing the shooter or even not firing the gun at all but brandishing it and getting the shooter to stand down. Additionally the overall statistics for the whole country include people who have received no training in the safe use and storage of firearms, whereas conceal and carry permits typically require training, and individual school districts could require further training as needed. Apparently there are quite a few school districts that have allowed armed staff for years, and I have not been able to find any stories of accidental deaths or even injuries from a teacher’s gun on school property.

Meanwhile, it is intuitive to me that if a teacher were to find herself in the position where there is a mass shooter attacking her or her students, both she and her students would have a greater chance of survival if she had a gun than if she did not. When Sandy Hook happened, I cried as I read in absolute horror about Lauren Rousseau and her first graders, completely trapped and defenseless. Even at the time I wondered if it would have been different if she had had a gun.[ref]This is not to suggest Rousseau would have wanted to carry a gun to school even if she could have. I have no idea. I would expect typically the type of people interested in teaching children are probably not the type of people most likely interested in carrying firearms. My argument here is definitely not that anyone who is uncomfortable with firearms should have to carry one. My argument is that if a teacher or other staff specifically want to be able to carry a concealed firearm at school, they should be able to. They should have the right to defend themselves and their students.[/ref]

A note here: I don’t want the world we live in, the society we live in, to require first grade teachers to need guns. I don’t want there to be any guns on any school property at all. I don’t want children to have to do active shooter drills, or teachers to have to be trained to recognize gun shots, or parents to drop their kids off and worry if they will be safe each day. It’s awful. It’s infuriating and heartbreaking, and sometimes I can hardly stand to think about it.

But I also don’t think we have a way to 100% ensure that deranged or evil people will not be able to show up and try to kill as many unarmed teachers and children as possible. In fact, given our country’s unique relationship with guns, and our relatively unique 2nd amendment, I think preventing such shootings is ridiculously difficult. I still think we should try, but I don’t think our efforts to stem the death toll should be limited only to preventing shooters from showing up in the first place. I think we should also have efforts to address what innocent people can do if a shooter does show up.

As I write this post, a news story is breaking suggesting that not only did the School Resources Officer fail to engage Nicholas Cruz, but so did three additional deputies present during the shooting. All four officers remained outside the school while Cruz shot unarmed teachers and students. Some opponents to arming teachers point out that if even trained officers struggle to engage a mass shooter, how can we expect teachers to be able to handle it? But this question presumes that teachers get any choice; the reality is that if the shooter is already in the school and breaking into the classroom, the teacher will have to face the shooter anyway. And I can’t help but wonder: if police won’t engage the shooter, how can we disarm teachers and tell them to wait for the police?


Why Are We Addicted to Panic?

Photo by Charles Knowles.

Four days ago The Independent (an online UK magazine) ran this story: Bulletproof backpacks for children reflect a new reality in America. The article, and plenty like it, are leading to dramatic Facebook posts from or about teachers about how they help their high school students deal with the new reality that they might be gunned down in their schools at any time. Parents are afraid, kids are afraid, teachers are afraid, everyone seems to be afraid.

But why?

And no, I’m being earnest here. Why?

If there’s one topic that’s been prominent in media over the past few years, it’s been human irrationality. For a while there, “cognitive bias” threatened to become almost as much of a buzzword as “machine learning” has become, and it seemed like Wikipedia’s list of cognitive biases was getting a new entry every day. Everyone in any academic discipline even tangentially related to how humans evaluate risk–evolutionary psychology, economics, finance, etc. etc.–had a new book or a new study that showed how bad humans are at evaluating risk.

Some of the most prominent cognitive biases studied in experiments and written about in the popular press include the availability heuristic and the recency effect. So we know–or at least we should know–that in the immediate wake of a horrific school shooting our cognitive biases are going to go into overdrive to exaggerate the threat. This isn’t unique to school shootings. We do the same thing with all kinds of dramatic/traumatic events, especially terrorism. More Americans died because of the shift from flying to driving in the wake of 9/11 than died in the attack themselves. The fear of terrorism was quite literally more deadly than actual terrorism.

This over-reaction to the threat of terrorism has had horrific consequences. Some have been felt here in the United States, including the erosion of civil liberties and a lamentably paranoid tinge to any discussion of immigration, but for the most part we (ordinary Americans) have been free to go about our lives because we have outsourced the cost of our fear-driven policies. We don’t pay the price. The small minority of Americans who volunteer to serve in the armed forces pay the price–including physical and mental trauma that no amount of yellow ribbons at home can compensate for–along with children killed in drone strikes, collateral damage from American interventionism, and desperate refugees who were barred a safe escape.

Now, in the wake of another awful school shooting, we’re witnessing again America’s masochistic addiction to panic and fear.

If you read an article like the one from The Independent or this one from The Cut or any of the thousands[ref]I’m guessing, based on the fact that I’ve seen several in my own feed[/ref] of emotional Facebook posts about how teachers and students shouldn’t have to fear for their lives just because they’re going to school, then you’d think we were suffering some kind of massive tidal wave of school shootings.

But what’s actually going on?

Enter Business Insider with their article: How likely is gun violence to kill the average American? The odds may surprise you. The centerpiece of the article is this chart, which compares lifetime odds (for Americans) of dying from various causes:

Right off the bat, the odds of dying in a school shootings are significantly lower than the kinds of deaths that we Americans don’t fear: car accidents, drowning, choking are all much more likely to end your life than a mass shooting. What’s even more interesting, to me, is that you are apparently more likely to die because a police officer killed you than because a mass shooter killed you.

However, a major problem with the Business Insider numbers is that they aren’t talking about school shootings, they’re talking about “mass shootings” with the definition of “any event where four or more victims were injured (regardless of death)”.

I went to Wikipedia and created two lists of my own. One of all the school shootings for 2015 – 2017 (the same years as the data available from the BI article) and another of all the school shootings that fit the popular perception of a school shooting. I called this narrowest category “mass school shootings” and I counted any shooting perpetrated by a student / former student resulting in at least 2 fatalities (other than the attacker) at a school. This table illustrates what the numbers look like using these three different categories:

From this, I’m able to calculate the lifetime odds of death from the two new categories: school shootings and mass school shootings. Compared to the 1 in 11,125 odds for any mass shooting, the odds of dying in a school shooting are 1 in 280,350 and the odds of dying in a mass school shooting are 1 in 934,500.

First, let me deal with a couple of quick math issues. These numbers are for all people. Obviously a random 70-year old is unlikely to be in a school and so is much, much less likely to die in a school shooting, and a high school student is (relative to some random 70-year old) much, much more likely. But if you want to do a relative comparison, then you should keep this list as-is. The only way to get the risk assessment for high school students (or all K-12 students, or all K – college students) would also be to look at their likelihoods of dying across all the categories. You’d see heart disease drop off the list, but you’d also see car accidents go much higher. So no: this is not scientific. These are what I’d call back-of-the-envelope calculations. And according to them, you’re more likely to die from being struck by lightning than from a school shooting (category #2) and the only things on the BI table less likely to kill you than a mass school shooting (category #3) is a regional asteroid impact or a shark attack.

Asteroids and shark attacks, people.

I know people are going to be mad at me for being insensitive, but maximum sensitivity isn’t always the right course. When you have a child–your own child or a kid that you’re responsible for–and they are afraid of something than your job as an adult is more than empathy. You can’t just share the child’s fear. You have to allay that fear when possible.

When my children were younger, they were really, genuinely afraid of dying in a tornado. We had moved from Virginia to Michigan and they heard the tornado sirens being tested every now and then, and so they were afraid. Part of my job was to empathize. Part of my job was also to allay their fears by explaining realistically that–while dangerous–tornados were not that common.

More recently, one of my children came to me and confided with a quaver of real fear in their voice that they thought they might have tetanus because “my jaw is starting to feel kind of tight.” This is funny to us, but my kid was really, truly scared and on the verge of tears. My job was not to participate in their fear. It also wasn’t to mock their fear. It was to empathize but–again–allay the fear.

Please note that this doesn’t mean I’m trivializing the devastation of an actual tornado. During the tornado outbreak of Dec 2015, 13 people were killed. Nothing about that is funny. Nothing about that is trivial. Tetanus isn’t a joke, either. Because of vaccinations, only a few people die in the US every year from tetanus, but historically it was a real killer and it continues to be a serious health concern in many parts of the world (especially India).

So I’m not trivializing terrorism when I point out that more people died from avoiding planes after 9/11 than died on 9/11. I’m not trivializing tetanus or tornados when I help allay my kids’ fears. And I’m not trivializing school shootings when I point out that our fears of them are vastly overblown.

Far from it. The reason I’m writing this is that it broke my heart to read a post from a friend on Facebook about how his wife (a teacher) could do nothing but share the fear and panic of her high school students. They are afraid, and she wasn’t able to offer anything substantive to combat that fear. I don’t blame her personally for that at all, but–as a society–we should be mature and sober enough to tackle risk and fear responsibly. We need to do better for our kids.

I think I know the answer to my question. I know why we’re addicted to fear. Some of it is human nature, as we mentioned already. Evolutionarily, risks are more important than rewards. But there’s more to it than that.

For one thing, fear is profitable. It drives traffic and donations. That explains most of what human nature alone cannot.

But I have my suspicions that it doesn’t explain everything. I wonder if human beings are calibrated to a certain degree of threat and risk in our lives. And–living in what is without any doubt the safest and most comfortable period of human history–it’s almost as though we are incapable of accepting that realty and intent on manufacturing risks and dangers we keep expecting to be there, but aren’t.

This post is not about gun control or even school shootings in particular.

It’s just about risk, and fear, and how we need to deal better with the fear if we want–individually and as a society–to find ways to batter manage risk.

Should government food assistance programs have nutritional requirements?

Some of the foods you can purchase through WIC.

Probably.

There’s good reason to believe that adding nutritional requirements to government food programs is a better use of money and leads to better health outcomes for the people in said programs.

WIC (Women, Infants, and Children) is a state-run program that helps low-income women and children purchase healthy food. WIC has specific guidelines for the quantities and types of food recipients can purchase, all of which have to meet certain health standards. In this program there is no way to purchase soda, candy, pizza, baked sweets, ice cream, etc. SNAP (Supplemental Nutrition Assistance Program, often referred to as “food stamps”) is a federally-funded program helping low-income people purchase almost any food.

The USDA explains that SNAP is for purchasing any food or food product for home consumption and that this definition includes “soft drinks, candy, cookies, snack crackers, and ice cream” and similar items. Data suggest these types of purchases make up at least 17% of SNAP spending .[ref]To get this number I added the percentages for the following categories: soft drinks, candy – packaged, frozen pizza, ice cream ice milk & sherberts, cookies, cakes, bacon, baked sweet goods, candy – checklane, sweet goods, ramen, frozen desserts, popcorn, dry mix desserts, pies, cookie/cracker multi packs, cocoa mixes, sweet goods & snacks, salty snacks, refrigerated desserts, single serve sweet goods, single serve cookie/cracker, and cake decor. There were many other categories that could arguably be categorized as unhealthy food or “junk food,” but if they were debatable I left them out.[/ref] In 2017, about 42 million people used SNAP at an average of $125.79 per person per month, meaning the government spent about $11.3 billion that year buying junk food for low-income people. What are the arguments for spending so much on junk rather than using those funds to ensure low-income people have high quality food?

Opponents of SNAP nutritional requirements give many reasons for why nutritional requirements are not feasible or effective: we can’t come up with clear standards for what is “healthy,” it would be too complicated and costly to implement such standards, restrictions wouldn’t stop people from buying unhealthy food with their own money, and people in higher income brackets purchase similar amounts of unhealthy food.[ref]Whether this last argument is true or not is a bit tangential. Research shows lower SES people have poorer nutrition and health outcomes than people with higher income. Improving nutrition is one (important) approach to bridging that gap.[/ref]

Yet WIC has managed to define what constitutes healthy food and implement a program based on those boundaries. In fact the USDA describes WIC as “one of the nation’s most successful and cost-effective nutrition intervention programs.” There is evidence to suggest people participating in WIC (especially children) have better nutrition and health outcomes than their peers. Conversely, there is evidence to suggest people who receive SNAP benefits have worse nutrition than income-eligible people who don’t participate in SNAP. For example:

Changing WIC changes what children eat – May 2013

Comparing July to December in 2008 and 2011, increases were observed in breastfeeding initiation (72.2-77.5%); delaying introduction of solid foods until after 4 months of age (90.1-93.8%); daily fruit (87.0-91.6%), vegetable (78.1-80.8%), and whole grain consumption (59.0-64.4%) by children aged 1-4 years; and switches from whole milk to low-/nonfat milk by children aged 2-4 years (66.4-69.4%). In 1-year-old children, the proportion ≥95th percentile weight-for-recumbent length decreased from 15.1 to 14.2%; the proportion of children 2- to 4-year-old with body mass index (BMI) ≥95th percentile decreased from 14.6 to 14.2%.

Trends in Obesity Among Participants Aged 2–4 Years in the Special Supplemental Nutrition Program for Women, Infants, and Children – November 2016

The prevalence of obesity among young children from low-income families participating in WIC in U.S. states and territories was 14.5% in 2014. This estimate was higher than the national estimate (8.9%) among all U.S. children in a slightly different age group (2–5 years) based on data from the 2011–2014 National Health and Nutrition Examination Survey (7). Since 2010, statistically significant downward trends in obesity prevalence among WIC young children have been observed overall, in all five racial/ethnic groups, and in 34 of the 56 WIC state agencies, suggesting that prevention initiatives are making progress, potentially by impacting the estimated excess of calories eaten versus energy expended for this vulnerable group (8).

The Supplemental Nutrition Assistance Program – September 2015

Child SNAP recipients consume more sugary beverages, processed meats, and high-fat dairy products, but fewer nuts, seeds, and legumes than income-eligible nonparticipants. Similarly, adult SNAP recipients consume more fruit juice, potatoes, red meat, and sugary beverages, but fewer whole grains than income-eligible nonparticipants. In another study, SNAP participants had lower dietary quality scores overall, and consumed significantly fewer fruits, vegetables, seafood, and plant proteins, but significantly more added sugar than income-eligible nonparticipants.

The study specifically compares SNAP nutrition to WIC nutrition:

In one study comparing the grocery store purchases of SNAP and WIC households in New England, SNAP households purchased more than double the amount of sugary beverages per month (399 ounces) than WIC households (169 ounces), 72% of which were paid for with SNAP dollars. In a 3-month study, new SNAP participants significantly increased their consumption of refined grains compared with low-income people who did not join. In a study of Hispanic Texan women, SNAP participants consumed 26% more sugary beverages and 38% more sweets and desserts than low-income nonparticipants.

Furthermore, most of the people who use SNAP believe the program should not allow recipients to purchase unhealthy food:

54% of SNAP participants supported removing sugary drinks from SNAP eligibility. In another survey of 522 SNAP stakeholders, 78% of respondents agreed that soda, and 74% agreed that “foods of low nutritional value” such as candy and sugar-sweetened fruit drinks should not be eligible for purchase with benefits. Seventy-seven percent of respondents believed that SNAP benefits should be consistent with the DGAs [Dietary Guidelines for Americans], and 54% thought that SNAP should be reformulated into a defined food package similar to WIC.

I want to live in a society where people are healthy and no one goes hungry. SNAP can and should serve both goals.

Was the China Shock Actually a Boom?

I’ve talked about the China Shock before. The concern is that imports from China reduced the amount of jobs in the United States. However, new research suggests otherwise:

Our empirical results show important job gains due to US export expansion. We find that although imports from China reduce jobs, the global export expansion of US products creates a considerable number of jobs. Based on the industry-level estimation, our results show that on balance over the entire 1991-2007 or 1991-2011 periods, job gains due to changes in US global exports largely offset job losses due to China’s imports, resulting in about 300,000 to 400,000 job losses in net. Estimation at the commuting zone level generate even bigger job creation effects: in net, global export expansion substantially offsets the job losses due to imports from China, resulting in about 200,000 net job losses over the period 1991-2007, and a roughly balanced net effect if we extend the analysis to 1991-2011.

In Feenstra and Sasahara (2017), we quantify the employment effect of US imports and exports using a global input-output analysis. Following the technique of Los et al. (2015), we use the world input-output table from WIOD and examine the employment effects of US total exports and imports from China and from all countries during the period 1995-2011. Admittedly, this approach only indicates the impact of trade on labour demand, without taking into account the (regional) supply of labour in general equilibrium.

We find that the growth in US exports created demand for 2 million manufacturing jobs, 500,000 resource-sector jobs, and a remarkable 4.1 million jobs in services, totalling 6.6 million. The positive job creation effect of exports in the manufacturing sector, 2 million, is quantitatively similar to the result in Feenstra et al. (2017), in which 1.9 million jobs were created by US exports from the instrumental-variable regression approach. On the import side, our analysis shows that manufacturing imports from China reduced demand for US jobs by 1.8-2.0 million, which is similar to the result in Autor et al. (2016), who finds a decline of 2.0 million jobs due to imports from China.

One advantage of the input-output approach is that it is easy to extend the analysis to other sectors such as services and natural resources. Our results show that, when focusing on the manufacturing sector and the natural resource sector, the net effect of overall trade with all countries in all sectors is slightly negative: 80,000 reduction in demand for jobs in manufacturing, and a 250,000 job reduction in the natural resource sector during 1995-2011. However, when looking at the service sector, we find a substantial net job gain, with a 1.03 million increase in the demand for jobs due to overall trade with all countries. This is large enough to compensate for the net job losses in the manufacturing and natural resource sectors. After taking all of these into account, the net effect of overall trade with all countries led to a net increase in labour demand of 700,000 jobs.

They conclude,

Our results fit the textbook story that job opportunities in exports make up for jobs lost in import-competing industries, or nearly so. Once we consider the export side, the negative employment effect of trade is much smaller than is implied in the previous literature. Although our analysis finds net job losses in the manufacturing sector for the US, there are remarkable job gains in services, suggesting that international trade has an impact on the labour market according to comparative advantage. The US has comparative advantages in services, so that overall trade led to higher employment through the increased demand for service jobs.


Economic Freedom of North America 2017

The Fraser Institute–who publishes the oft-cited Economic Freedom of the World report–published their latest Economic Freedom of North America report toward the end of December. This report looks at states within Canada, the United States, and Mexico. Once again, there is a link between economic freedom and economic well-being.

I’m happy to report that Texas is tied with Florida for the 2nd most economically free state in the United States and tied for 3rd (along with 10 other U.S. states, including Florida, South Dakota, Nevada, and Georgia) at the national level. Yet, the Cato Institute’s Freedom in the 50 States report finds that we could do better when it comes to personal freedom:

Personal freedom is relatively low in Texas, but it should rise with the Obergefell decision, setting aside Texas’s super-DOMA…Criminal justice policies are generally aggressive—though Texas has emerged as a leading voice in the national reform movement. Even controlling for crime rates, the incarceration rate is far above the national average and has not improved since 2000. Drug arrest rates have fallen over time but are still above average for the user base. Nondrug victimless crime arrest rates have also fallen over time and are now below the national average. Asset forfeiture is mostly unreformed, and law enforcement frequently participates in equitable sharing. Cannabis laws are harsh. A single offense not involving minors can carry a life sentence. Even cultivating a tiny amount carries a mandatory minimum of six months. In 2013–14, the state banned the mostly harmless psychedelic Salvia divinorum. Travel freedom is low. The state takes a fingerprint for driver’s licenses and does not regulate automated license plate readers at all. It has little legal gambling. Private school choice programs are nonexistent, but at least private schools and homeschools are basically unregulated. Tobacco freedom is moderate, as smoking bans have not gone as far as in other states. Gun rights are moderately above average and should improve a bit in the next edition with the new open-carry law. Alcohol freedom is above average, with taxes low. Texas has virtually no campaign finance regulations.

Both are useful indices.

Public Ignorance on Corporate Profits

Numerous studies over the years have demonstrated how ignorant the general public is regarding political matters.[ref]See Ilya Somin, Democracy and Political Ignorance: Why Smaller Government Is Smarter, 2nd ed. (Stanford, CA: Stanford University Press, 2016); Bryan Caplan, The Myth of the Rational Voter: Why Democracies Choose Bad Policies (Princeton, NJ: Princeton University Press, 2007); Christopher H. Achen, Larry M. Bartels, Democracy for Realists: Why Elections Do Not Produce Responsive Government (Princeton, NJ: Princeton University Press, 2016); Jason Brennan, Against Democracy (Princeton, NJ: Princeton University Press, 2016), Ch. 2: “Ignorant, Irrational, Misinformed Nationalists.”[/ref] This systemic ignorance and misinformation in turn warps the public’s policy preferences. AEI’s Mark Perry points out another example of public ignorance: corporate profits. He writes,

When a random sample of American adults were asked the question “Just a rough guess, what percent profit on each dollar of sales do you think the average company makes after taxes?” for the Reason-Rupe poll in May 2013, the average response was 36%! That response was very close to historical results from the polling organization ORC International polls for a slightly different, but related question: What percent profit on each dollar of sales do you think the average manufacturer makes after taxes? Responses to that question in 9 different polls between 1971 and 1987 ranged from 28% to 37% and averaged 31.6%.

How do the public’s estimates of corporate profit margins compare to reality? Not surprisingly they are off by a huge margin. According to this NYU Stern database for more than 7,000 US companies (updated in January 2018) in many different industries, the average profit margin is 7.9% for all companies and 6.9% for more than 6,000 companies excluding financials…Interestingly, for nearly 100 industries analyzed by NYU Stern, there’s only one industry that had a profit margin as high as 36% – and that was tobacco at 43.3%. The next highest profit margin was 26.4% for financial services, but more than 72% of industry profit margins were single-digits and the median industry profit margin is 6%. 

“Big Oil” companies make a lot of profits, right? Well, that industry (Integrated Oil/Gas) had a below-average profit margin of 5.6% in the most recent period analyzed, and separately, the Production and Exploration Oil/Gas industry is losing money, reflected in a -6.6% profit margin. For the general retail sector, the average profit margin is only 2.3% and for the grocery and food retail industry, it’s even lower at only 1.6%. And evil Walmart only made a 2.1% profit margin in 2017 (first three quarters) which is less than the industry average for general retail, possibly because grocery sales now make up more than half of Walmart’s revenue and profit margins are lower on food than general retail. Interestingly, Walmart’s profit margin of 2.1% is actually less than one-third of the 6.5% the average state/local government takes of each dollar of Walmart’s retail sales for sales taxes. Think about it – for every $100 in sales for Walmart, the state/local governments get an average of $6.50 in sales taxes (and as much as $10.12 in Louisiana and $9.45 in Tennessee, see data here), while Walmart gets only $2.10 in after-tax profits!

Perry concludes, “The public’s complete overestimation of how much companies earn in profits as a share of sales explains a lot…The general public that believes in the fantasy-world of unrealistically, sky-high 36% profit margins would naturally think companies are just being greedy and stingy when they don’t pay higher “living wages” and have to be forced to do so through minimum wage legislation. If the average person could realize that a 36% profit margin isn’t even close to reality and that the typical, median firm has a profit margin of only less than 8% or almost 30 percentage points below what the public thinks is a normal profit margin, then hopefully the average person would become a little more realistic about how the business world operates. Companies aren’t being stingy when they pay competitive wages, they’re just trying to survive on what are sometimes razor-thin profit margins, in a competitive environment where there’s not a large margin of error.”[ref]Perry also has a great post and WSJ article about CEO pay.[/ref]

Do Markets Pave the Way for Anticorruption Reforms?

In a paper I have under review, I cite an article by Jason Brennan that points to “a robust positive correlation between countries’ degree of economic freedom (as measured by the Fraser Institute’s economic freedom ratings) and countries’ lack of corruption (as measured by Transparency International’s Corruption Perceptions Index.”[ref]Jason Brennan, “Do Markets Corrupt?” in Economics and the Virtues: Building a New Moral Foundation, ed. Jennifer A. Baker, Mark D. White (New York: Oxford University Press, 2016), 240.[/ref]

Recent studies offer further support to this correlation:

These twin policies [anticorruption reforms and high-quality market institutions] resonate with economic research revealing a mutually reinforcing feedback loop between corruption and stalled development. Corrupt officials misappropriating government money defund public goods and services, including those that might deter corruption. Bribing corrupt officials for regulatory favours or subsidies diverts corporate spending away from investing in productivity and corporate attention away from market signals. This stalls growth, and stalled growth locks in corruption (Krueger 1974, Fisman and Svensson 2007, Ayyagari et al. 2014).

Unfortunately, corruption is an enticing ‘second best’ optimal policy for key actors in an economy with an interventionist government. Bribes grease squeaky bureaucratic wheels to help businesses get things done where officials, not markets, allocate key resources. Bribes supplement officials’ incomes where stunted economic activity keeps government revenues low (Fisman 2001, Wei 2001, McMillan and Woodruff 2002, Li et al. 2008, Calomiris et al. 2010, Agarwal et al. 2015, Zeume 2016).

But once entered, this second-best thinking can entrap a whole economy in a low-level pit (e.g. Murphy et al. 1993, Morck et al. 2005). Powerful officials rationally focus on maximising bribe income (even erecting artificial regulatory barriers they can take bribes for removing), rather than institution building. Profit-maximising firms rationally invest in bribing officials because bribes, not enhancing productivity or responding to market signals, have higher returns. This explains clear empirical findings (e.g. Mauro 1995) linking worse corruption to slower growth.  

The authors note that almost “half of China’s listed firms are S[tate ]O[wned ]E[nterprise]s, and the anticorruption Policy affected SOEs and non-SOEs differently.” They continue,

In less liberalised provinces, officials still allocate key resources, so bribing them is critical to get anything done. Deprived of the ability to pay bribes, their non-SOEs might be caught in frozen bureaucratic gears (e.g. Wei 2001). Expecting this, shareholders would price non-SOEs in less liberalised provinces lower on news of the anticorruption Policy. 

In more liberalised provinces, where market forces allocate resources, officials still solicit bribes, but as fees for passing artificial ‘toll booths’ they erect in non-SOEs paths. The new Policy was designed to suppress this behaviour, freeing non-SOEs of these tollbooth fees. Expecting this, shareholders would price non-SOEs in more liberalised provinces higher on news of the anticorruption Policy.

Figure 2, based on findings in Lin et al. (2017), shows exactly this pattern across portfolios of mainland traded shares. SOE shares gain on news of the reform. Non-SOEs in economically liberalised provinces also gain, but non-SOEs in less reformed provinces drop sharply. 

With the announcement of anticorruption reforms, investors “expect[ed] curtailed corruption to advantage non-SOEs previously more encumbered by official ‘toll booths’. Their regressions also show more non-SOEs with higher productivity, more external financing needs, and greater growth potential gaining more on news of the Policy if located in more liberalised provinces.” Furthermore, “Li et al. (2017) find evidence of a shift in credit allocation towards non-SOEs and away from SOEs as the anticorruption reforms took hold. Event studies of subsequent news of follow-on provincial anticorruption policies show non-SOEs, but not SOEs, gaining more (e.g. Ding et al. 2017). These findings are readily interpretable as reinforcing Lin et al.’s findings – investors’ initial expectations about the impact of reforms on SOEs remained unchanged, but the provincial buy-ins led investors to further boost the valuations on non-SOEs in more liberalised provinces.” The authors conclude,

Reducing corruption creates more value where market reforms are already more fully implemented. If officials, rather than markets, allocate resources, bribes can be essential to grease bureaucratic gears to get anything done. Thus, non-SOEs stocks actually decline in China’s least liberalised provinces – e.g. Tibet and Tsinghai – on news of reduced expected corruption. These very real costs of reducing corruption can stymie reforms, and may explain why anticorruption reforms often have little traction in low-income countries where markets also work poorly.   

China has shown the world something interesting: prior market reforms clear away the defensible part of opposition to anticorruption reforms. Once market forces are functioning, bribe-soliciting officials become a nuisance rather than tools for getting things done. Eliminating pests is more popular than taking tools away.    

These patterns in Chinese stock price reactions to news of a genuinely unexpected and seemingly real anticorruption reform suggest the existence of a feedback loop that reform-minded leaders might activate. Market reforms clear the way for anticorruption reforms, and create an advantage for more productive market-ready private sector firms. These are the sorts of firms that are more likely to invest shareholders’ money in productivity-enhancing growth opportunities and less willing to pay bribes. As these firms grow stronger and more important, their self-interest in further market liberalisation and anticorruption reforms would lead them to support political leaders advocating further such reforms. A self-reinforcing upward spiral towards increased wealth and better institutions ensues. 

A virtuous cycle ensues – persistent anticorruption efforts encourage market-oriented behaviour, which makes anticorruption reforms more effective, which further encourages market oriented behaviour. President Xi is right to state that anticorruption reforms are the path to developing high-quality market institutions.

Trump’s Approval Ratings Among Religions

Well, this is disappointing:

President Donald Trump received well-above-average job approval ratings in 2017 from Mormons and Protestants, and well-below-average ratings from those who identify with a non-Christian faith, including Muslims and Jews, and from those who have no formal religious identity. Catholics’ approval of Trump roughly matched the national average.

  • Mormon: 61%
  • Protestant/Other Christian: 48%
  • National adults: 39%
  • Catholic: 38%
  • Jewish: 26%
  • None/Atheist/Agnostic: 23%
  • Other non-Christian religion: 22%
  • Muslim: 18%

The hell people?[ref]Obama’s rating among Mormons was equivalent to Muslims under Trump.[/ref]


The problems with the St. Louis “Gun Buyback” program.

[Today’s post is by guest blogger Robert Kirchoff.]

St. Louis Interim Chief O’Toole, photo courtesy of St. Louis Post Dispatch

Last week I posted on Facebook criticizing the City of St. Louis’ most recent iteration of a long tradition of wasteful political theater: their December 2017 “Gun Buyback” scheme. Launched in the face of the City’s startlingly high murder count–shocking in absolute terms but downright third-world in per capita terms–the “buyback” was of course heralded as an immediate success by the city and its faithful cadre of mostly left-of-center and wholly well-meaning local reporters.

An acquaintance responded to my post echoing support and taking exception to the idea that this effort was anything but a win:

“Seems relatively logical no? Most murderers happen by guns in the city, remove some guns, maybe a few less murders?”

On first inspection this is a perfectly reasonable view. It seems obvious, therefore it must be right. Or at least worth the old college try.

Trouble is, gun “buybacks” (is the government selling guns to people in the first place?) are nonsense hiding in the threadbare guise of common sense. This guise shields the concept from all criticism, no matter how often if fails to achieve the desired result. To people who don’t have the time, expertise, or inclination to think further than the first step, such an idea will always sound reasonable. And most of the time in politics, getting past the initial sniff test is half the battle.

For that reason I hold no grudge towards my acquaintance. This mentality is not confined to him or to his portion of the political spectrum. I do hold a grudge towards the St. Louis politicians who pushed this idea, and who garnered public support and resources for it that could have been used elsewhere to good effect. They should know better.

But what should they know? Why aren’t buybacks a good idea? Here are just a few points that I could come up with off the cuff:

1. Sustainability
If you reduce the supply of something while leaving the demand unchecked, prices rise. This means that insofar as this policy “succeeds” it will begin to fail. That is, even if guns are moved “off the streets” and into police custody, insofar as those guns are in demand the remaining ones become more valuable. Meaning that the relatively modest prices offered by the buyback will rapidly look less attractive, diminishing further effectiveness. “Non-sustainable model” comes to mind.

2. Impact
The above assumes a key point: that supply will be affected enough to meaningfully impact prices. But alas, this is not so. St. Louis’ self-declared “massive” success yielded fewer than 1000 weapons. Sounds like they made a splash. But did they really?

St. Louis city has a population of about 300,000. The metro area exceeds 2,000,000. Roughly one third of U.S. households have a firearm in the house. Over two thirds of gun owners have more than one gun. Napkin math tells me that there are, at minimum, 1,500,000 gun in the metro area. Considering Missouri’s conservative bent and Midwestern location, the true number is likely well north of 2,000,000.

So did 1,000 guns make much of a difference? Probably not. Especially when you consider which guns are being turned in and by who.

3. Self-Selection I: The Attic Crowd
The fact that buybacks in the U.S. are voluntary dooms them.

Understand, I am not advocating they be mandatory (which in any case would likely be illegal given SCOTUS jurisprudence on the Second Amendment); I’m pointing out that absent compulsory participation, buybacks do an awful job of actually reducing the pool of guns likely to be used in crime.

When voluntary, these programs are just a place for people to dump the contents of their attics. Scrounge around and find grandad’s rusty old bolt-action and get $150 for it? Sweet deal. But what rational gun owner is going to sell a rifle worth $1000 for $200? Generally, they won’t. This is borne out by the St. Louis’ own statistics: only 6 out of the 1000 or so guns traded in were considered “assault rifles” (probably erroneously, but more on that later).

Thus you tend to get people turning in guns that don’t work, are rarely used, or are owned by someone ignorant about guns (inheritors, generally). These guns are not the problem and removing them does next to nothing.

4. Self-Selection II: Criminal Avoidance
Put simply: what criminal in his right mind is going to turn in his gun knowing full well the police are right there checking guns for past criminal involvement? Maybe a few exceptionally stupid ones.

This presents a really serious problem for the buyback scheme. A large segment of gun crime is gang violence,* which is to say, repeat offenders. If you disarm 90% of the population but the repeat offenders hold on to their guns, not much is going to change in the gun crime numbers.

*Exact percentages are exceedingly hard to pin down because of statistics gathering methodologies among law enforcement groups, but some estimates place it as high as 80% of gun homicides , though the real number is likely lower if still quite high.

5. Fungibility
Money is fungible. People can spend it as they like.

Consider the following scenario: Bob has a break-action shotgun he got from a family member. Bob doesn’t really want it, since it’s rusty and only fires one shot. But Bob is smart, and trades in his long gun for $150 cash to the fine, well-meaning folks at the St. Louis buyback. What’s to keep Bob from taking this cash to the nearest gun store and buying a brand-new pistol?

Nothing.

In this way, buybacks can function like a gun upgrade coupon program. In fact, buybacks are almost identical in concept to the notorious “cash for clunkers” program pushed early in Obama’s presidential tenure, only in the latter case the Fed’s stated goal was to induce owners of old, dirty cars to go buy news, cleaner cars. The buybackers do the same thing but claim they’re getting guns off the streets. Particular guns, sure. But total guns? Less sure. If you have two different policies that function identically but whose stated aims are diametrically opposed, someone isn’t right.

[An anecdotal aside: While attending the gun show in St. Charles on New Year’s Eve, I observed that the show guests as a group were about half black. This is a marked contrast to the usual sea of white seen most places in St. Charles generally and more specifically at gun shows. I can’t help but wonder if there were some savvy St. Louis gun owners who wisely traded up to something nicer on the buyback’s dime. That’s nice for them, but it doesn’t accomplish what the city intended—and used up scarce resources trying to make happen.]

6. Ignorant pricing
Per the RFT, the St. Louis City buyback featured this price list: “$200 for assault rifles and guns with a magazine capacity of more than ten rounds, $150 for shotguns and rifles, and $100 for handguns.”

First, a petty complaint: assault rifles are defined as select-fire intermediate-cartridge rifles; i.e. they can go full auto. These are both extremely rare (being very difficult to own legally) and extremely expensive (regularly auctioning for thousands or even tens of thousands of dollars). Their use here is either ignorant or intentionally misleading. Or, I suppose, the City might really believe that someone will trade in a rifle as valuable as a brand-new car for enough cash for a weekend stay at the Motel 6.

More to the core objection: these prices make no sense! Yes, pistols tend to be the cheapest firearms, so maybe if you didn’t think too hard you’d price them lowest. Except that, per the FBI, pistols account for 90% of all murders involving a gun where the type of gun is known. Rifles of all types accounted for a measly 4%, despite garnering the highest price point in the buyback.

This contradiction, more than anything, signals a lack of seriousness and information on the part of the organizers. A buyback program that was both interested in and informed enough to clear away dangerous weapons specifically rather than disarming the public in general would prioritize pistols above all else. Their presence at the bottom of the list seems to communicate what most gun owners suspect of anti-gun policy-makers: they have no idea what they’re talking about.