What is Recent Research Saying About the Gender Wage Gap?

Image result for gender pay gap
Well, about $0.06 cheaper.

We’ve discussed the gender wage gap here on Difficult Run before. My last post on the subject covered a lot of the research. In the comments, I made mention of a couple more 2016 studies that should be included in the analysis. However, I thought I’d highlight them in a post for educational purposes. In a paper soon to be published in the Journal of Economic Literature, Cornell economists report,

Using PSID microdata over the 1980-2010, we provide new empirical evidence on the extent of and trends in the gender wage gap, which declined considerably over this period. By 2010, conventional human capital variables taken together explained little of the gender wage gap, while gender differences in occupation and industry continued to be important. Moreover, the gender pay gap declined much more slowly at the top of the wage distribution that at the middle or the bottom and by 2010 was noticeably higher at the top. We then survey the literature to identify what has been learned about the explanations for the gap. We conclude that many of the traditional explanations continue to have salience. Although human capital factors are now relatively unimportant in the aggregate, women’s work force interruptions and shorter hours remain significant in high skilled occupations, possibly due to compensating differentials. Gender differences in occupations and industries, as well as differences in gender roles and the gender division of labor remain important, and research based on experimental evidence strongly suggests that discrimination cannot be discounted. Psychological attributes or noncognitive skills comprise one of the newer explanations for gender differences in outcomes. Our effort to assess the quantitative evidence on the importance of these factors suggests that they account for a small to moderate portion of the gender pay gap, considerably smaller than say occupation and industry effects, though they appear to modestly contribute to these differences.

Five interesting facts from the study are:

  1. The gender pay gap shrank the most in the 1980s.
  2. Wage-gap narrowing wasn’t tied to government policies.
  3. Gender differences in occupations and job roles matter the most.
  4. High-income women have seen the smallest wage-gap closing.
  5. Findings are fuzzy about the impact of family-leave policies.

A 2016 study from Glassdoor yields further support for #3. When “comparing [male and female] workers with the same job title, employer and location, the gender pay gap in the U.S. falls to 5.4 percent (94.6 cents per dollar).”[ref]There is a consistent 4-6% adjusted gap across countries.[/ref] But it turns out that “the single biggest cause of the gender pay gap is occupation and industry sorting of men and women into jobs that pay differently throughout the economy. In the U.S., occupation and industry sorting explains 54 percent of the overall pay gap—by far the largest factor.” And “while overt forms of discrimination may be a partial cause of the gender pay gap, they are not likely the main cause. Instead, occupation and industry sorting of men and women into systematically different jobs is the main cause.”

In short, the gender pay gap has shrunk considerably and is far smaller than one typically hears in political discourse.[ref]Women actually out-earn men in numerous college majors right after graduation, though this dissipates by mid-career.[/ref] Nonetheless, a gap remains. The Glassdoor study finds that “employer policies that embrace salary transparency can help eliminate hard-to-justify gender pay gaps, and can play an important role in helping achieve balance in male-female pay in the workplace.” Perhaps this and similar policies going forward can help us eradicate the (adjusted) gender pay gap indefinitely.

Media Fragmentation and Political Polarization

I’ve written about political polarization beforeRecent research suggests that media fragmentation is the culprit behind growing political polarization. A new study[ref]An older version can be found here.[/ref] finds that

  • The growing plurality of news sources as well as the increasing access to cable television made the greatest contribution to political polarization. Two phenomena, or a combination of the two, are responsible: Individuals seek out “self-reinforcing viewpoints rather than be exposed to a common ‘nightly news’ broadcast” — this is sometimes called siloing. Also, individuals are jettisoning news programming for entertainment, “thereby reducing incidental or by-product learning about politics.”
  • The decreasing exposure to alternative views and the increasing buttressing of one’s own views has combined to create less sympathy for others’ views and less of an ability to understand others’ views. “This may be reinforced by a tendency for political differences to be decreasingly addressed through genuine debate and increasingly replaced with media coverage of political vilification or grandstanding.”
  • Inequality — the divide between rich and poor — may have contributed to political polarization, but less than media fragmentation.
  • Duca and Saving test for a number of trends but find no statistically significant associations with generational attitudes, voter partisanship, economic conditions or campaign contributions. But they do find associations with income inequality and media fragmentation.
  • There is some evidence that Congress is more polarized at the beginning of a president’s second term.

Despite these findings, there may be room for caution. According to a new paper by Stanford political scientist Morris Fiorina, the average American has not followed the political class to the fringes. Reason‘s write-up draws five lessons from Fiorina’s work:

  1. The political class is becoming more polarized: “If you limit its scope to elected officials and professional activists, the polarization thesis has some truth to it. Since the early ’70s, the parties have gone through a sorting process, to the point where the most left-wing Republican in either house of Congress is now more conservative than the most right-wing congressional Democrat.”
  2. The general public has not followed suit: “Over the last four decades, there has been little change in how Americans describe themselves ideologically—the most popular category in such surveys is still “moderate,” without a big exodus to the liberal and conservative poles. Opinions have shifted on some specific topics, but not always in the same direction: Americans have gotten more liberal on certain issues, such as health insurance, and more conservative on others, such as aid to minorities.”
  3. The more politically active you are, the less well-informed you are about these trends in grassroots opinion: “Both normal Americans and the political class tend to exaggerate the extent that the general public is polarized. But the politicos do much more of this, projecting their divisions onto the electorate at large. “Ironically,” Fiorina writes, “the great majority of Americans whose lives do not revolve around politics are more accurate in their political perceptions than their more politically involved compatriots.””
  4. The stronger your partisan affiliations, the more likely you are to misconstrue what life is like at the other end of spectrum: For example, “Democrats think that 44 percent of Republicans make more than $250,000 per year, when the actual percentage is 2, and that 44 percent of Republicans are senior citizens, when the actual percentage is 21. For their part, Republicans think that 36 percent of Democrats are atheists or agnostics, when the actual percentage is about 9, and that 38 percent of Democrats are LGBT, when the true percentage is about 6. Once again, the more politically involved the respondent, the greater the misperception.”
  5. We’re not retreating into smaller bubbles: “A paper on Twitter users…found that “Twitter networks tend to be fairly heterogeneous politically, in part because many of those in them are connected by only ‘weak ties.’ Contrary to the fears expressed by those worried about ideological segregation, social media actually may lessen people’s tendency to live in echo chambers.””

All of this reinforces something Georgetown professor Peter Jaworski said: “Partisan politics corrupts your character. Instead of trying to get votes for your favoured tribe, try to make money instead. Engaging in markets makes mean people nicer, makes you more trustworthy, more charitable, and more beneficent.”

Religion and the U.S. Economy

Economist Steve Horwitz once made the point, “Critics of markets sometimes say “you can’t eat GDP.” What they miss is that you can’t eat, or learn to read, or go to school, or leave a bad marriage, or do pretty much any of the basics that we might see as required for a flourishing life without the wealth and time created by the market economy.” This is why I tend to focus on economic growth: it is growth that lifts people out of poverty. This is why I’m happy to report that religion, according to a new study, is good for the economy.[ref]Religious freedom is good for business as well.[/ref] As reported in Christianity Today,

Specifically, religion is a $378 billion to $4.8 trillion boost to the US economy, the Grims found. Even at the lowest estimate, religious organizations make more than the global revenue of Apple and Microsoft combined; at the high end, religion makes the roughly the same amount as a third of the United States GDP.

The researchers’ first estimate only takes into account “the revenues of faith-based organizations falling into several sectors: education, healthcare, local congregational activities, charities, media, and food.” The largest chunk of these–healthcare–raises about $161 billion a year. Congregations raise $84 billion a year, religious schools raise $74 billion, and religious charities bring in $45 billion. Furthermore, the money is increasingly spent on social services like food assistance, parenting classes, and drug and alcohol abuse recovery programs ($9 billion in 2012).

“Their second estimate—that religion has an economic value of $1.2 trillion—adds in the price of social services provided by congregations,” the article continues.

Churches sponsor more than 1.6 million social services programs in America each year, and provide 7.6 million volunteers. More than 9 in 10 congregations actively recruit volunteers for outside projects (93%), half allow their building to be used for non-congregational purposes (50%), and close to half have groups that think about how to meet community needs (48%).

The Grims also added in the halo effect a community receives from the benefits of having a church nearby: it encourages investment in family and children; stimulates the local economy by buying goods and services; provides a place to host weddings, funerals, or large community events; may run schools or day cares; provides outdoor space for leisure activities; and augments the city’s social services.

The result: $418.9 [billion] worth of value.

When religious businesses are considered, the estimate is $1.2 trillion. “The study wasn’t perfect, the Grims admitted. It didn’t add in any of the financial or physical assets of religious groups, or subtract any negative impacts of religious groups, like fraud or abuse of children by clergy…Still, they wrote, “the data are clear.””

Glad to see religion making a big impact in the real world.

Economic Freedom of the World Report: 2016

The Fraser Institute just published its Economic Freedom of the World 2016 Annual Report. The degree of economic freedom is measured using 5 broad areas:

  1. size of government (expenditures, taxes, enterprises)
  2. legal structure and property rights
  3. access to sound money
  4. freedom to trade internationally
  5. regulation of credit, business, and labor

The ten most economically free countries are:

  1. Hong Kong
  2. Singapore
  3. New Zealand
  4. Switzerland
  5. Canada
  6. Georgia
  7. Ireland
  8. Mauritius
  9. United Arab Emirates
  10. Australia (United Kingdom was tied with Australia)[ref]The United States currently resides at #16.[/ref]

One of the most important findings of past reports that is once again confirmed in the latest is the following:

The share of income earned by the poorest 10% of the population is virtually the same from the least (2.45%) to the most (2.75%) free countries. It is unaffected by economic freedom. But, as shown above, the amount of income earned by the poorest 10% of the population is significantly higher in freer countries. In other words, the poorest of the population are better off in countries that are more economically free.

The rest of the report includes articles on gender disparity in legal rights, Venezuela, Ireland’s growth, and economic freedom in the United States.

Check it out.

Economic Perception and Voting LEAVE

Recent research finds that the way people perceived the economic outcomes of immigration influenced whether or not they voted “Leave” in the Brexit referendum:

The pattern of voting in the referendum reflects differences in the share of the over-65 group and the less educated across regions (with these two groups more likely to vote for Brexit).  A high rate of immigration and low levels of GDP per capita also correlated with greater propensities to vote to leave. These variables explain not only the voting patterns but also the attitude towards immigrants as neighbours, the perceived dangers posed by immigrants to society, and feelings of apprehension towards the EU. Figure 2 shows the relationship between the latent economic variable E[ref]This was done by “by assigning coefficients to the rate of unemployment for each region, GDP per capita, the share of the working-age population with low education, the rate of immigration, and the share of the population over 65 in each region.”[/ref] and the leave vote by region.

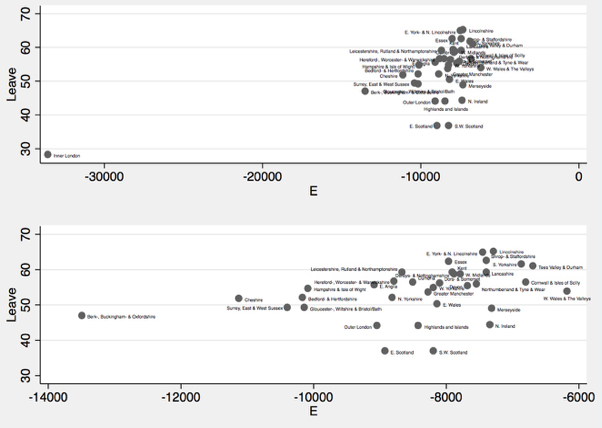
The researchers also found that “an increase in GDP per capita of €5,000…will lower the share of the leave vote by 0.55%. An increase of 5% in the share of the population over the age of 65…will increase the leave vote by 3.3%. A 5% increase in the share of the population with low education…will increase the leave vote by 4.8%.”

The authors summarize,

We have found that old people and those with low education and low income tend to dislike immigration and fear the influence of the EU, and therefore voted for Brexit. A likely reason is that they feel vulnerable to immigration from other European countries. However, the empirical evidence on the adverse effect of immigration on the labour market is weak, although there is some evidence that the lowest-skilled workers in the UK may be adversely affected by immigration…Given the limited effect on wages, an exaggerated fear of immigration in public debate may have influenced voters to want to leave the EU. Thus, voters perceive the numbers and effects of immigrants as being much greater than they actually are.

The Economic Impact of NAFTA

Image result for nafta

Trump wants to “renegotiate” or even withdraw from it. Clinton is up for “adjusting” it. With trade coming under fire (even from previous supporters), it is no wonder that NAFTA has taken some heat. But what do experts says about the economic impact of NAFTA? According to an excellent brief by the Council on Foreign Relations,

Economists largely agree that NAFTA has provided benefits to the North American economies. Regional trade increased sharply (PDF) over the treaty’s first two decades, from roughly $290 billion in 1993 to more than $1.1 trillion in 2016. Cross-border investment has also surged, with U.S. foreign direct investment (FDI) stock in Mexico increasing in that period from $15 billion to more than $100 billion.

Admittedly, “experts also say that it has proven difficult to tease out the deal’s direct effects from other factors, including rapid technological change, expanded trade with other countries such as China, and unrelated domestic developments in each of the countries.” And like any trade deal, there is debate over “NAFTA’s legacy on employment and wages, with some workers and industries facing painful disruptions as they lose market share due to increased competition, and others gaining from the new market opportunities that were created.”

But what has happened to the U.S. economy since NAFTA?:

In the years since NAFTA, U.S. trade with its North American neighbors has more than tripled, growing more rapidly than U.S. trade with the rest of the world. Canada and Mexico are the two largest destinations for U.S. exports, accounting for more than a third of the total. Most estimates conclude that the deal had a modest but positive impact on U.S. GDP of less than 0.5 percent, or a total addition of up to $80 billion dollars to the U.S. economy upon full implementation, or several billion dollars of added growth per year.

Such upsides of trade often escape notice, because while the costs are highly concentrated in specific industries like auto manufacturing, the benefits of a deal like NAFTA are distributed widely across society. Supporters of NAFTA estimate that some fourteen million jobs rely on trade with Canada and Mexico, while the nearly two hundred thousand export-related jobs created annually by the pact pay 15 to 20 percent more on average than the jobs that were lost.

Furthermore, “economists like Gary Clyde Hufbauer and Cathleen Cimino-Isaacs of the Peterson Institute for International Economics (PIIE) emphasize that increased trade produces gains for the overall U.S. economy. Some jobs are lost due to imports, but others are created, and consumers benefit significantly from the falling prices and often improved quality of goods created by import competition. A 2014 PIIE study of NAFTA’s effects found that about 15,000 jobs on net are lost each year due to the pact—but that for each of those jobs lost, the economy gains roughly $450,000 in the form of higher productivity and lower consumer prices.” Interesting enough, NAFTA may have “helped the U.S. auto sector compete with China. By contributing to the development of cross-border supply chains, NAFTA lowered costs, increased productivity, and improved U.S. competitiveness. This meant shedding some jobs in the United States as positions moved to Mexico, he argues, but without the pact, even more would have otherwise been lost.”

Many critics, however, focus less on the U.S. and more on Mexico. How has the country south of the border done since NAFTA?:

NAFTA gave a major boost to Mexican farm exports to the United States, which have tripled since NAFTA’s implementation. Hundreds of thousands of auto manufacturing jobs have also been created in the country, and most studies have found (PDF) that the pact had a positive impact on Mexican productivity and consumer prices.

NAFTA was “the continuation of a decade of economic liberalization that saw [Mexico] transition from one of the world’s most protectionist economies to one of the most open to trade. Mexico had reduced many of its trade barriers upon joining the General Agreement on Tariffs and Trade (GATT), the precursor to the WTO, in 1986, but still had a pre-NAFTA average tariff level (PDF) of 10 percent. Mexican policymakers saw NAFTA as an opportunity to both accelerate and “lock in” these hard won reforms to the Mexican economy.” Unfortunately, “Mexican unemployment also rose, which some economists have blamed on NAFTA for exposing Mexican farmers, especially corn producers, to competition from heavily subsidized U.S. agriculture.” However, many experts argue that

Mexico’s recent economic performance has been affected by many non-NAFTA factors. The 1994 devaluation of the peso drove Mexican exports, while competition with China’s low-cost manufacturing sector (PDF) likely depressed growth. Unrelated public policies, such as land reform, made it easier for farmers to sell their land and emigrate. As UCSD’s Hanson has argued (PDF), Mexico’s struggles have largely domestic causes: poorly developed credit markets, a large and low-productivity informal sector, and dysfunctional regulation.

Overall, as economist Douglas Irwin summarizes,

NAFTA has promoted the growth of a middle class in Mexico that now includes nearly half of all households. And since 2009, more Mexicans have left the United States than have come in. In the two decades since NAFTA went into effect, Mexico has been transformed from a clientelistic one-party state with widespread anti-American sentiment into a functional multiparty democracy with a generally pro-American public. Although it has suffered from drug wars in recent years (a spillover effect from problems that are largely made in America), the overall story is one of rising prosperity thanks in part to NAFTA.

I expect anti-foreign bias from voters. The problem is that smart politicians will say stupid things to appeal to these voters. I just hope the policies don’t match the rhetoric.

The Stock and Flow of Drug Offenders

Last month, Nathaniel penned a critique of criminal justice scholar Barry Latzer’s WSJ piece on the supposed “myth” of mass incarceration. The impact of the war on drugs tends to be minimized by counting the amount of drug offenders vs. violent criminals in the prison population (hint: there are more of the latter). In his critique, Nathaniel wrote, “Drug sentences are generally shorter than violent crime sentences, and so taking a headcount of prisoners artificially increases the appearance of violent incarceration simply because those criminals spent more time in jail.” This, of course, was noted by Michelle Alexander in her book The New Jim Crow. But what do the data say? According to Brooking’s Jonathan Rothwell,

There is no disputing that incarceration for property and violent crimes is of huge importance to America’s prison population, but the standard analysis—including Alexander’s critics—fails to distinguish between the stock and flow of drug crime-related incarceration. In fact, there are two ways of looking at the prison population as it relates to drug crimes:

  1. How many people experience incarceration as a result of a drug-related crime over a certain time period?
  2. What proportion of the prison population at a particular moment in time was imprisoned for a drug-related crime?

The answers will differ because the length of sentences varies by the kind of crime committed. As of 2009, the median incarceration time at state facilities for drug offenses was 14 months, exactly half the time for violent crimes. Those convicted of murder served terms of roughly 10 times greater length.  

The picture is clear: Drug crimes have been the predominant reason for new admissions into state and federal prisons in recent decades.[ref]This is the finding of the National Academy of Sciences as well.[/ref] In every year from 1993 to 2009, more people were admitted for drug crimes than violent crimes. In the 2000s, the flow of incarceration for drug crimes exceeded admissions for property crimes each year. Nearly one-third of total prison admissions over this period were for drug crimes:

Rothwell 1125001

In short, Alexander was right when she saw drug prosecution as “a big part of the mass incarceration story.” It turns out “drug crimes account for more of the total number of admissions in recent years—almost one third (31 percent), while violent crimes account for one quarter:”

Rothwell 1125002

As Nathaniel concluded,

First, you don’t have to go to jail at all to get a felony conviction on your record. Second, that felony conviction is going to stay on your record long after you have “served your debt to society.” If the criminal justice system is unfair, it’s not just about incarceration. It’s about losing the right to vote. It’s about losing access to government programs like student loans or food stamps. It’s about the government banning your friends and family from supporting you (if they live in public housing) when you get out. And–most egregiously of all–it’s about a scarlet-F that will follow you to every job interview and ensure that long after you are outside the prison walls you are still practically barred from building a new life for yourself.

There’s  lot at stake here, folks, and it’s not just about violent crime.

The Economics of Immigration: A Cato Lecture by Benjamin Powell

This is part of the DR Book Collection.

Image result for the economics of immigrationImmigration has been getting quite a bit of attention in the news and here at Difficult Run lately. With political debates shifting from the typical Right/Left to Open/Close, tackling the economic literature on immigration became a priority to me. Hence, my recent completion of the Oxford-published The Economics of Immigration: Market-Based Approaches, Social Science, and Public Policy. And what does the research say?:

  • Eliminating policy barriers to international labor mobility would increase global wealth by between 50-150% of world GDP (pg. 13). “For all its radicalism, open borders’ main effects are fairly well understood. Open borders would dramatically increase global production. It would drastically reduce global poverty and global inequality. At the same time, open borders would make the remaining poverty and inequality much more visible for current residents of the First World” (pg. 185).
  • Immigration has little to no effect on native wages and employment. What effects there are tend to be negative, but small and temporary (pg. 30). In fact, it is mainly those without high-school degrees who lose out in the short run, yet see their wages increase in the long run (pg. 19).
  • Immigration generates an annual efficiency gain for Americans of between $5 and $10 billion (pg. 21).
  • Immigrants boost the demand side of the economy (pg. 42-43).
  • Immigration has little to no impact on the government budget (pg. 63). A typical immigrant may impose a $3,000 net fiscal cost herself, but her descendants have a positive net fiscal contribution of $83,000, producing an $80,000 surplus  (pg. 61).
  • Immigrants today tend to assimilate more than they did a century ago (pg. 90).
  • New research finds “that greater immigration was associated with small improvements in economic institutions or had no effect at all” (pg. 211). In other words, immigrants don’t import negative institutions.

And much more. You can see a Cato Institute lecture on the book below by editor and Texas Tech economist Benjamin Powell.


The Long-Term Outcomes of Divorce

It’s no secret among social scientists that, on average, family breakdown (notably divorce) is associated with multiple negative outcomes for children. But is divorce the causal factor? Recent evidence suggests that it is. Drawing on research that finds “that individuals who have workplaces with a larger fraction of co-workers of the opposite sex are significantly more likely to divorce later,” the authors

Image result for divorceaim to identify the causal effect of divorce for the child whose father left the family because he met a new partner at work. We argue that this research design evaluates a realistic divorce scenario and offers a well-balanced relationship between internal and external validity.

To assess the long-run effect of divorce, we analyse children’s human capital and demographic outcomes. First, we examine college attendance. In Austria, college attendance implies that this person graduated from a higher secondary school. Second, we check the labour market status (employed; unemployed; out-of-labour force) up to the age of 25 years. Third, we examine children’s own family formation behaviour (i.e. fertility and marriage). Finally, we investigate the probability of early mortality (below 25 years of age). Our results show that parental divorce – due to a high level of sexual integration in fathers’ workplaces — has a negative effect on children’s long-term outcomes.

These negative effects include:

  • Lower levels of educational attainment for both sexes.
  • Higher likelihood of early mortality and worse labor market outcomes for boys.
  • Increased likelihood of teenage pregnancy and out-of-wedlock births for girls.

The researchers conclude, “Our results also imply that the negative consequences of parental divorce on children’s long-term outcomes should ideally not only be internalised by parents, but also by policymakers who design policies affecting parents’ incentives to divorce, or programmes which support children from disrupted families.”

Is the Democratic Tradition on the Decline?

A fairly new article in First Things reports on

Image result for democracya fascinating new paper in The Journal of Democracy suggest[ing] that liberal democracy is losing ground even at home, in the West. Political scientists Roberto Stefan Foa and Yascha Mounk review data from recent World Values Surveys and observe some truly remarkable trends, especially among young people. Young people often reject the traditions of their elders; that’s nothing new. What they seem to be rejecting nowadays, though, in increasing numbers, is the tradition of liberalism itself.

For example, the percentage of people in Western Europe and the United States who say it is “essential” for them to live in a democratically-governed country has declined dramatically across generations. In the United States, less than one-third of millennials—defined as people born since 1980—say it is essential for them. Think about that: More than two-thirds of American young people say democratic government is not a crucial factor in where they would want to live.

According to Foa and Mounk, these numbers do not reflect growing indifference to liberal democracy, but growing opposition. In the surveys, young people increasingly express openness to authoritarianism—especially young people who are rich. An astonishing 35 percent of wealthy young Americans say it would be “a ‘good’ thing for the army to take over” the country! This is a profound change from prior generations, in which “affluent citizens were much more likely than people of lower income groups to defend democratic institutions.”

…The surveys reveal that younger Americans value civil liberties, such as free speech, less than their parents did. For example, only 32 percent of millennials say that civil rights are “absolutely essential” in a democracy, a steep drop from previous generations.

There are criticisms of democracy,[ref]For example, I look forward to reading the newly-published Against Democracy by Jason Brennan.[/ref] but the increasing support for authoritarianism and censorship[ref]The latest Freedom in the World report found that global freedom has declined for the 10th consecutive year.[/ref] is rather frightening.