The Gender Wage Gap: Union Edition

Image result for union woman

Similar to previous research, a new working paper shows that the gender wage gap is driven largely by the amount of hours men and women choose to work. The authors draw on data from the Massachusetts Bay Transportation Authority (MBTA), explaining that the “bus and train operators are all represented by the same union, Carmen’s Local 589, and are all covered by the same bargaining agreement. The agreement specifies that seniority in one’s garage is the sole determinant of one’s work opportunities. Conditional on seniority, men and women face the same choice sets of schedules, routes, vacation days, and overtime hours, among other amenities” (pg. 2).

What do they find?

We show that a gender earnings gap can exist even in a controlled environment where work tasks are similar, wages are identical, and tenure dictates promotions. The gap of $0.89 in our setting, which is 60% of the earnings gap across the United States, can be explained entirely by the fact that, while having the same choice sets in the workplace, women and men make different choices. Women use the Family Medical Leave Act (FMLA) to take more unpaid time off than men and they work fewer overtime hours at 1.5 times the wage rate. At the root of these different choices is the fact that women value time and flexibility more than men. Men and women choose to work similar hours of overtime when it is scheduled a quarter in advance, but men work nearly twice as many overtime hours than women when they are scheduled the day before. Using W-4 filings to ascertain marital status and the presence of dependents, we show that women with dependents – especially single women – value time away from work more than men with dependents.

When selecting their work schedule for the following quarter, women try to avoid inconvenient days, like weekends, and shifts, like split-shifts, more than men. Prioritizing schedule related amenities over route quality-related amenities, women select routes with higher probabilities of assaults and collisions in order to avoid unfavorable schedules. When faced with having to work an unfavorable schedule, like a weekend, holiday, or split shift, women take more unpaid time off. Men also take more unpaid time off in those circumstances, but they more than make up for lost earnings with overtime. While constrained schedules lead to lower earnings for women, they result in higher earnings for men. In an effort to reduce absenteeism and overtime expenditures, the MBTA oversaw two policy changes: one that made it harder to take unpaid time off with FMLA and another that made it harder to be paid at the overtime rate. While the policy changes reduced the gender earnings gap from $0.89 to $0.94 and made it harder for operators to trade off regular hours for overtime, they also decreased women’swell-being by further constraining the work environment (pg. 34-35).

Texico: The Texas-Mexico Economy

Michael Cox and Richard Alm of SMU’s O’Neil Center have an essay in D Magazine based on the latest report from the Center. The two

imagine Texas and Mexico as one economy, connected by exports, imports, migration, cross-border business investments, transport infrastructure, tourism, and knowledge transfers. As a combined economy, Texas and Mexico churn out an annual GDP of more than $4 trillion, enough to rank as the world’s sixth-largest economy, just behind Germany and ahead of Russia.

We denote this sprawling and diverse economy by the portmanteau word: Texico. The name captures the reality that over the past quarter-century the Texas and Mexico economies have emerged as highly integrated, making an often-unsung contribution to Texas’ reign as America’s top-performing state economy.

The explain how trade has deeply integrated the two countries: 

An often-cited gauge of integration is trade—exports moving south, imports moving north. They totaled $188 billion last year, or more than 11 percent of gross state product, separating Texas from all other states in doing business with Mexico.

Texas companies are finding business opportunities in Mexico—among them, cosmetics-maker Mary Kay Inc. and telecommunications giant AT&T Inc., both based in Dallas-Fort Worth. At the same time, Mexican companies are heading northward and expanding their businesses, including Mission Foods in Irving and the movie theater chain Cinépolis in Addison.

The Texas and Mexico economies are more formidable combined rather than separate. Binational supply chains, for example, take advantage of low production costs in Mexico and highly skilled professional labor in Texas. The companies emerge more competitive in the global marketplace, able to sell their wares at a better price.

Automobile production comes to mind—for good reason. Plants in the Dallas-Fort Worth area are on the northern edge of the Texas-Mexico Automotive SuperCluster region, which includes close to 30 assembly plants and more than 230 parts suppliers in Texas and Mexico’s northern states.

Texas and Mexico have already profited a great deal from their binational economy, even though work began in earnest only recently. Mexico didn’t open its energy and telecom markets until just a few years ago. During negotiations that led to the North American Free Trade Agreement, Mexico clung to its monopolies in these industries. With its oil output falling, Mexico finally lifted its ban on foreign oil and gas companies three years ago. If all goes well, this should be a bonanza for Texas, with its deep roster of oilfield services and exploration companies. The telecom monopoly expired about the same time—and AT&T rushed in with its wireless service.

The annual report provides a few more interesting insights:

The report explains the slow convergence above: “Other factors like low levels of education shouldn’t be ignored, but the ongoing plague of corruption, cronyism and rising violence go a long way toward explaining why Mexican growth and income haven’t converged with the United States or kept pace with the likes of Chile, South Korea and China” (pg. 13). 

Cox and Alm conclude,

Texans are well aware of Mexico’s shortcomings, including corruption and drug-cartel violence. None of these problems will get any better by enacting policies that build barriers against Mexico and harm the Texas and Mexico economies. Perhaps Trump and Obrador will decide that the best course lies in expedient practicality—recognizing the fact that Texico has been working and building a large constituency. If these two leaders don’t make a mess of things, the businesses of Texas and Mexico can take it from there.

Is Assortative Mating to Blame for Income Inequality?

A brand new job market paper has some interesting data on assortative mating and its impact on income inequality. Drawing on data from the Panel Study of Income Dynamics (PSID), the paper 

investigates the evolution of assortative mating based on permanent wage in the U.S. since the late 1960s; quantifies its impact on rising family-wage inequality; and, finally, tries to understand the factors behind this evolution. It documents a significant increase in assortative mating, as measured by couple’s permanent-wage correlation, between families formed in the late 1960s and in the late 1980s. I then show that changes in the degree of assortative mating accounts for a sizable amount of the increase in family wage inequality across these family cohorts. This finding shows focusing on the time trends in permanent-wage inequality is not enough to understand the mechanics of increasing family wage inequality. Note, this finding does not rule out a feedback mechanism. It might be that increasing family wage inequality incentivized individuals to care more about their spouse’s wages, causing a higher degree of marital sorting along permanent wage, which in turn mechanically increased family wage inequality (pg. 23).

What is “a sizable amount”? The data show that “the trend in assortative mating explains more than one-third of the increase in family wage inequality” (pg. 11; emphasis mine). He explains,

I use the Gini coefficient in the left panel, as the measure of inequality, whereas the variance of logarithm is used in the right panel. Solid lines show the actual evolution of family wage inequality with these measures. In the dashed lines, however, I construct the counterfactual family wage inequality by holding the empirical copula distribution fixed at its initial form while letting the permanent-wage distribution vary. The dashed lines thus show the counterfactual evolution of family wage inequality if no change occurred in assortative mating. The left panel shows the rise in the Gini coefficient would be 40% lower, and the right panel shows that the rise in the variance of (log) family wage would be around 35% lower under the counterfactual scenario. The increase in assortative mating thus accounts for a significant amount of the increase in family wage inequality (pg. 11).

As previous research shows, this shouldn’t come as a shock.

Economic Growth Begins in the Home

Sociologist W. Bradford Wilcox and economist Joseph Price have an important chapter in a recent Cambridge-published book on the link between family structure and economic growth. They write,

A stable marriage matters in part because it allows couples to make decisions over time that maximize the economic prosperity of their family unit. Stably married persons have incentives to invest in their marriage and benefit from specialization and economies of scale; their households also tend to earn and save more than their peers who are unmarried or divorced (Stevenson and Wolfers 2007; Lerman and Wilcox 2014). Marriage also has a transformative effect on individuals, especially men. It seems to increase men’s productivity at and attachment toward work, and reduces men’s willingness to engage in risky behaviors, including criminal activity (Akerlof 1998; Nock 1998; Sampson, Laub, and Wimer 2006). What is more, it looks like married parenthood may be especially influential in encouraging men’s engagement in the labor force (Killewald 2012). In the aggregate, then, higher levels of marriage, and probably two-parent families, should boost men’s labor force participation and reduce criminal violence, both to the benefit of national economies. At the same time, insofar as motherhood tends to reduce women’s participation in the labor force (Budig and England 2001), we also explore the possibility that higher rates of marriage and two-parent families reduce growth. Finally, higher rates of intact marriage foster stable two-parent families, which are more likely than single parents to supply children with the human capital they need to thrive first in school and later in the labor force (Lerman and Wilcox 2014; McLanahan and Sandefur 1994). Accordingly, the more children are born and raised in stable, two-parent families, the more a society should experience economic growth (pg. 179-180).

Wilcox and Price continue to lay out the evidence that married, two-parents households:

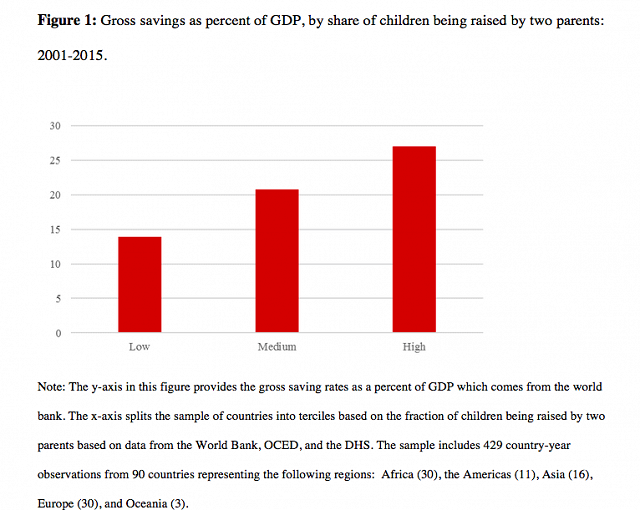
  1. Have more income and savings.
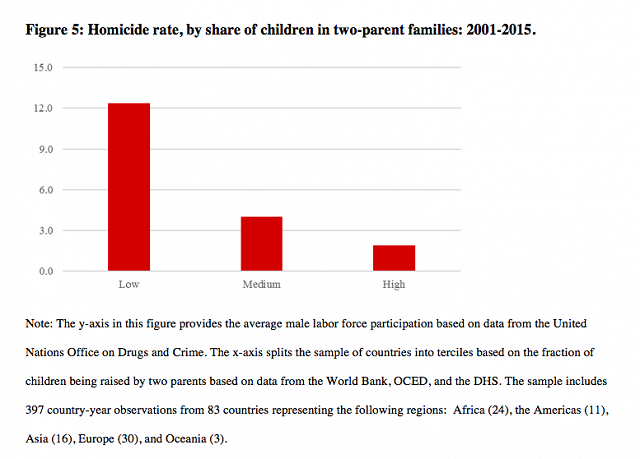
  2. Lower crime rates.
  3. Higher educational achievements for children.

They conclude,

[W]e find that a significant association between family structure and
economic growth. Every 13 percentage point increase in the proportion of adults who are married is associated with an 8 percent increase in per capita GDP, net of controls for a range of sociodemographic factors. Likewise, every 13 percentage point increase in the proportion of children living in two-parent families is associated with a 16 percent increase in per capita GDP, controlling for education, urbanization, age, population size, and other factors. There is clearly a link between family structure and economic growth. 

…[W]e also note that the cross-national relationship between family structure, household savings, and crime are generally consistent with
our expectations about how marriage and two-parent families foster a social environment more conducive to economic growth in countries around the world. It is striking that more two-parent families are linked to less crime and more savings. If nothing else, the patterns documented in this paper suggest that stronger families, higher household savings rates, less crime, and higher economic growth may cluster together in mutually reinforcing ways.

...In conclusion, this chapter indicates that strong and stable families are
linked to higher levels of economic growth in nations across the globe, despite the fact that marriage and two-parent families are in decline across much of the globe. Given the potential economic importance of marriage and family stability to a nation’s economic life, policymakers, business leaders, and civic leaders should pursue a range of public and private policies to encourage and strengthen marriage and stable families. That is because what happens in the family may not affect only the welfare of private families but also the wealth of nations (pg. 194-195).

Economic institutions at the macro-level matter. But so do the ones at the micro-level. Probably more so. 

Alcohol Kills More Than Opioids

From Newsweek:

Alcohol is killing more adults in the U.S. than the opioid epidemic according to the Institute for Health Metrics and Evaluation at the University of Washington. The opioid epidemic kills an average of 72,000 people per year, while alcohol kills 88,000. In those 88,000 deaths are 2.5 million years of potential life lost, according to the Center for Disease Control and Prevention.

The surge of alcohol related deaths is new. In ten years, the number of deaths by alcohol have increased 35 percent according the new report shared by USA Today on Friday. The statistics are based on findings from 2007 to 2017.

Most affected by the rising alcohol epidemic are young women. Among women, deaths rose 67 percent, while for men, the percentage rose only 27 percent.

The article concludes with a quotation from psychologist Benjamin Miller: “Culturally, we’ve made it acceptable to drink but not to go out and shoot up heroin. A lot of people will read this and say ‘What’s the problem?’”

I wonder when we’ll start caring about the mounting evidence.

November 6: The Day You Did Absolutely Nothing

As the elections were coming up, I noticed that many wanted to inflate their single vote with undeserved moral capital. I wasn’t having any of it, especially if they were doing so in order to smugly lecture others. 

So, what do the numbers say regarding your single vote? Georgetown’s Jason Brennan explains,

There is some debate among economists and political scientists over the precise way to calculate the probability that a vote will be decisive. Nevertheless, they generally agree that the probability that the modal individual voter in a typical election will break a tie is small, so small that the expected benefit (i.e., p[V(D)−V(R)]p[V(D)−V(R)]) of the modal vote for a good candidate is worth far less than a millionth of a penny (G. Brennan and Lomasky 1993: 56–7, 119). The most optimistic estimate in the literature claims that in a presidential election, an American voter could have as high as a 1 in 10 million chance of breaking a tie, but only if that voter lives in one of three or four “swing states,” and only if she votes for a major-party candidate (Edlin, Gelman, and Kaplan 2007). Thus, on both of these popular models, for most voters in most elections, voting for the purpose of trying to change the outcome is irrational. The expected costs exceed the expected benefits by many orders of magnitude.

While a 1-in-10 million chance is the most optimistic estimate, the average estimate is 1-in-60 million. Economist Steve Landsburg put it this way: “I have a better chance of winning the Powerball jackpot 7,400 times in a row than of affecting the election’s outcome. Which makes it pretty hard to see why I should vote.”[ref]There’s always the comeback, “If everyone thought that, it’d be a disaster!!” Well, not everyone does, so that’s irrelevant. If everyone decided they didn’t want to be a doctor, that’d be a disaster too. Yet, no one says we all have a moral duty to be a doctor. We’re talking about the meaning of your single vote, not the collective’s.[/ref] 

So maybe the presidential election is a long shot when it comes to making a difference as an individual voter. Surely the midterm elections are different, right? They certainly are, but it’s not something to get excited about. As economist Casey Mulligan explains,

An election of a United States senator, or a governor, has never in the history of the United States been decided by one vote. Charles Hunter, who earned a doctorate at the University of Chicago, and I studied almost 100 years of elections of members of Congress – almost 20,000 of them in which an aggregate two billion votes were cast – and only one election was determined by a single vote of the 40,000 cast (that was in the New York’s 36th Congressional District in 1910). And that election had a recount that determined the election was decided by a margin of six votes, rather than one.

Thus, when it comes to elections to federal office, history suggests that the chances that your vote…will change the winner of the election is less than one in 100,000; more people die in an election year in car crashes than cast a pivotal vote in a federal election.

Dr. Hunter and I also studied 21 years of elections to state legislatures in the 50 states. Our data included more than 50,000 elections with an aggregate of about a billion votes cast. Those elections were markedly smaller than the federal elections and therefore more likely to come down to one vote.

Still, only nine of these came down to one vote (before recounts), and included a grand total of less than 40,000 pivotal votes. So the probability of a pivotal vote in these elections was less than one in 25,000. (The odds are somewhat higher – one in 15,000 for the state elections and one in 89,000 for Congressional elections – if the election actually has more than one candidate; a number of elections do not, such as this year’s election in Florida’s 21st Congressional District).

Let’s check those stats again:

  • Presidential elections: 1-in-60 million on average; 1-in-10 million at best.
  • Federal elections: 1-in-100,000; 1-in-89,000 for Congressional elections.
  • State legislators elections: 1-in-25,000; 1-in-15,000 at best.

As one friend put it, if you’re trying to get into the Good Place, voting likely earns you 10 points total.[ref]I think that’s rather high, but let’s roll with it.[/ref] That’s a blip on the moral scale.

However, these 10 points are probably cancelled out by:

  • The smugness that accompanies your “I Voted” sticker.
  • The terrible way you treat flesh-and-blood people who disagree with your politics.[ref]The social science shows that political participation corrupts us.[/ref]
  • The likelihood that your Facebook status about the importance of voting is nothing more than moral grandstanding.[ref]”And when thou prayest, thou shalt not be as the hypocrites are: for they love to pray standing the synagogues and in the corners of the streets, that they may be seen of men. Verily I say unto you, They have their reward” (Matt. 6:5). Just replace “pray” with “vote” and the synagogues and street corners with Facebook and Twitter.[/ref]

But that’s still working off the assumption that voting is an inherent good. No one seems to care that voting imposes costs on others by means of legalized violence (government). Now, those costs and the accompanying legalized violence may be justified. But if you’re going to force something on to others, you’d better be damned sure it is in fact just and worth the cost. If you’re not sure (and the social science suggests you probably aren’t), stay away from the polls

Also, voters typically want to transmit all the goodness of their political picks to themselves, while ignoring the evil. For example, many Obama supporters probably see themselves as champions of the uninsured; crusaders for healthcare justice. However, they likely do not want his drone strikes or deportations on their conscience. “Turns out I’m really good at killing people” isn’t exactly the moral motto most voters want to trumpet.

Finally, you may be risking more harm than good by simply driving to the polls on election day:

[S]uppose my favored candidate (who is worth $33 billion more to the common good) enjoys a slight lead in the polls. She has a very small anticipated proportional majority. The probability that any random voter will vote for her is 50.5 percent. This is an election we would describe as “too close to call.” Suppose also that the number of voters will be the same as in the 2004 U.S. presidential election: 122,293,332. I vote for my favored candidate. In this case, the expected value (for the common good) of my vote for the better candidate is $4.77 x 10^-2650 , that is, approximately zero. Even if the candidate were worth $33 billion to me personally, the expected value for me of my vote would be, again, a mere $4.77 x 10^-2650 . That is 2,648 orders of magnitude less than a penny. In comparison, the nucleus of an atom, in meters, is about 15 orders of magnitude shorter than I am. In meters, I am about 26 orders of magnitude shorter than the diameter of the visible universe. In pounds, I am about 28 orders of magnitude less heavy than the sun. Even if the value of my favored candidate to me were dramatically higher, say ten thousand million trillion dollars, the expected value of my vote in our example—for a close election—remains thousands of orders of magnitude below a penny. For an election in which the candidate has a sizable lead, the expected utility of an individual vote for a good candidate drops to almost zero.

The Beneficence Argument appeals to the public utility of individual acts of voting. However, suppose all you care about is maximizing your contribution to the common good. If so, voting would not merely fail to be worthwhile— it would be counterproductive. It turns out that the expected disutility of driving to the polling station (in terms of the harm a driver might cause to others) is higher than the expected utility of a good vote. This is not hyperbole.

Aaron Edlin and Pinar Karaca-Mandic have estimated the expected accident externalities per driver per year in the United States—that is, the amount of damage the average driver imposes on others from accidents and reckless driving. The expected accident externalities range from as little as $10 in low-traffic-density North Dakota to more than $1,725 in high-traffic-density California. Suppose a North Dakotan takes five minutes to drive to the polling station. The average expected accident externality of a five-minute drive in North Dakota is $9.5 x 10^-5 , much larger than the expected benefit of a good vote in the previous example. So the voter imposes greater expected harm on her way to the polls than she could compensate for by a good vote.[ref]Jason Brennan, The Ethics of Voting, pg. 19-20.[/ref] 

To review:

  • Mathematically speaking, your individual vote has probably never mattered and likely never will matter. It literally has no consequence on the planet.
  • Whatever goodness your single vote represents is likely cancelled out by a number of negative factors that are the byproduct of political participation.
  • In actuality, voting is a means of wielding legalized violence on others.
  • If you’re going to congratulate yourself on the good your chosen politician does, you have to condemn yourself for the bad as well.
  • The risk of harming others on election day is higher than the potential benefit.

Now, this isn’t an anti-voting post. I’m not saying you should refrain from voting.[ref]Unless you don’t know jack about what or who you’re voting for. In that case, stay home. I actually think you’re a better person for doing so.[/ref] What I am saying is that before you start patting yourself on the back for supposedly righting the wrongs of the world through voting, you ought to realize that you probably did absolutely nothing.

So cool your jets. 

The Rich Aren’t Necessarily Jerks

Image result for i'm rich gif

It’s a common assertion by some people that the rich are obviously awful people. Some psychology research (especially that of Paul Piff) seems to confirm that wealth makes us worse people. However, a new study casts doubt on some of these findings, demonstrating that the field of psychology is still having replication problems. “In contrast [to Piff’s work],” write the authors,

a recent large-scale study indicated positive associations between social ranking and prosocial behaviour (Korndörfer, Egloff, & Schmukle, 2015), and further research has supported that individuals from higher SES are more generous than individuals from lower SES (Smeets, Bauer, & Gneezy, 2015). Other studies have detected a more nuanced link, where general relations between class and ethical behaviour are not evident without the presence of moderators, such as level of social inequality in the community and the social class of the target (Côté, House, & Willer, 2015; Trautmann, van de Kuilen, & Zeckhauser, 2013; Van Doesum, Tybur, & Van Lange, 2017). Finally, other research has found no relation between social class and ethical behaviour (Van Doesum, Tybur, & Van Lange, 2017).

The authors “attempted to directly replicate Piff et al.’s Study 5 (2012),” which tested individuals’ willingness to lie in a negotiation task.

In an effort to increase experimental power, the present studies sought to increase sample size from 108 to 270 (i.e., 2.5 times larger), which is considered the current standard for replication protocols (Simonsohn, 2015). We collected two independent samples in an effort to provide more opportunity to replicate the original results (e.g., larger number of participants across samples helps mitigate issues associated with sampling error).

Their results?

Some of our findings were consistent with those of Piff et al., such as the significant relations between attitudes toward greed and unethical behaviour (i.e., dishonesty) as well as between social class and greed (in sample 2 only), but we did not obtain any evidence of a positive association between social class and unethical behaviour in either sample. Further, we found inconclusive evidence for the mediation model proposed by Piff et al. across the two samples.

Perhaps the crucifixion of the rich isn’t the most empirically-based idea.

Women Asked to Fast from Social Media by The Restored Church of Jesus Christ

Because internet outrage has an attention span of approximately 3.14159 seconds, and there were some submission and response delays, this story is no longer being discussed. However, since the Church of Jesus Christ of Latter-day Saints will probably forever be accused of being anti-woman, we’re still going to publish it here at DR.

This was originally written about 2 weeks ago, in the full swing of the Latter-day Saint Woman Social Media Blackout, when George Takei finally shocked his fans with information about this LDS scheme to control women. When it got to this point, I couldn’t help but respond.

I hope whether you participated or not, and whether you liked the idea or not, that you can get something out of this…


On October 6 of this year, The Church of Jesus Christ of Latter-day Saints had a historic meeting of the women of the Church. Twice a year, in April and October, regular Church services are suspended and 8 hours (yes 8!) of services are broadcast across the world from Salt Lake City in what is known as general conference. The 8 hours are done in 2 hour increments over Saturday and Sunday.

Prior to this October’s general conference, an extra Saturday evening session was held for the men of the Church (the general priesthood session), while women met a week before on Saturday evening (the general women’s session). However, this was the first meeting for women held during general conference weekend, as the men’s session and women’s session will alternate during the April and October sessions. Not the most exciting change (depending on your prospective), but a change nonetheless.

The women’s session is for all females ages 8 and up, and the men’s is for all males ages 8 and up. During this fall’s women’s session, President Nelson, the president and prophet of the Church, made four invitations for the women of the Church: 1. a 10-day social media fast, 2. read the Book of Mormon by the end of the year, 3. attend or learn about the temple, and 4. participate in Relief Society (the last was directed to adult women as it is the women’s organization of the Church for those 18 and older).

Before we get all frothy at the mouth about De Oppression of De Womenz by De Menz (TM), let’s take a moment to think through the largest complaints about the social media invitation and also think of ways to make this request work for a variety of women in a variety of circumstances. Most of the following is directed to members of the Church, but many outside the Church may find it informative. Full disclosure: I am a female member of this Church, and I have not yet participated in the social media fast.

Addressing the Major Complaints

Complaint 1: Right before elections.

I had seen this complaint many times, and eventually I decided to look at the numbers. The invitation was made October 6, and elections are November 6. That’s 31 days. Even if you started the fast on October 7, you still have 3 weeks to get informed on the election, if you’re not already. Plus, there are plenty of news sites that provide better election commentary and information than social media. Please don’t get all of your election information from social media (can mouth-frothers become a thing? because I think that’s what social media produces). Read a variety of reputable national and local news sites, and watch the news on TV, if you still have it. QED, you are informed ladies.

Complaint 2: Women use social media to work.

Keep going to work, y’all. I don’t think there’s any reason to stop working to continue this fast. Just like we don’t stop taking medicine when we fast from food, and some professions have to work on Sundays, we don’t need to kill our livelihood for this request. President Nelson himself said “Pray to know which influences to remove during your fast.” It may also be a great time to set up a business page/account if all of your work is through your personal page/account.

Complaint 3: Only the Women.

I’ve seen this combined more sinisterly with Complaint #1. Keep all the women uninformed before the election! However, the meeting included all females ages 8 and up and was worldwide, for a Church that has more members outside the United States than inside. So the idea that this was supposed to keep women in the USA specifically uninformed before the election is quite silly and really ignoring the reality of the Church.

Could this request have been made to everyone during the general attendance meetings? Of course. Why wasn’t it? I don’t know, I think that’s for every member of the Church to determine for themselves, and hopefully in a way that attempts to be generous to our leaders.

The fact of the matter is, men get requests from the Church’s leadership and sometimes women don’t get those same requests, or don’t get them as often. I’ve never heard anyone complain about that. Are the optics iffy when a male-led (if you only think of priesthood leaders) Church asks women to do something, but not the men? Yes. Does it mean it’s automatically sinister? No. And, let’s be honest, maybe some of us are placing social media on too high of a pedestal when thinking about this invitation.

Ideas to Make the Fast Work for You

When thinking about these complaints, I thought of several ways that women could follow the fast in a way that works for them. We have commandments where the leaders of the Church have said it’s up to you to prayerfully determine how to follow this commandment. And those are commandments, not requests (or invitations, even less of a requirement). So, determine how this can work for you, I’m sure there are lots of other ways than those below. I’ll again refer to President Nelson’s specific words, “Pray to know which influences to remove during your fast.”

Idea 1: Ask your family to join you, yes even the men and boys. Honestly, if my kids were old enough to be on social media (some of their friends are but it’s a while off for mine), this is definitely the direction I would go. Plus, in the same session, President Eyring made it very clear that women are supposed to be the guiding force of spiritual education in the home. USE YOUR POWER LADIES.

Idea 2: Do the fast on Sundays, or another day of the week. Fast every Sunday. Fast every fast Sunday. If you’re already doing this, add an extra day somewhere. Yes, it may provide more of a shock to the system to do it all at once, but maybe family contact or working is not something you can just give up for 10 days straight.

Idea 3: Fast from personal social media, but not business social media. Plenty of women make money by advertising or running their business on social media. See Complaint #2 if you need more convincing.

Idea 4: Do it with a friend and keep each other entertained via text message. I think a social media fast can help us connect with our families more, but it can also help us connect with our friends. Send each other pictures, send each other funny thoughts. If you’re already doing this, start including other people you’d like to have more contact with. If social media is one of the few places you get to communicate with other adults (I’m looking at you new/young moms), don’t lose contact! You need it!

Idea 5: Fast from the worst parts of social media. I’ve already spent a lot of time “unfollowing” many a person and blocking many a group on Facebook so my news feed isn’t full of stuff that stresses me out. But, when thinking about the fast, I’ve realized there is probably a lot more cleaning house I can do. Take the time to filter your feed (and continue to do so as with Facebook more new stuff will start to appear). Or fast from particular social media sites that seem to make you feel the worst after visiting them.

I hope everyone is feeling a little more calm and a little more empowered about this request. You’re awesome ladies, keep doing your thing, and always do what’s best for you and your family. I’ll give you an example of how I am responding to one of the invitations. I had already planned to finish the Book of Mormon by the end of the year. I’m in Alma. I am NOT starting over. And, in fact, I’ve been reading scriptures in a different way recently: for the most part, I listen to the scriptures on the Church’s Library app. I’ve found a lot more enjoyment with this approach, so I’ll continue to “read” the scriptures this way when I can.

PS: I had this thought when reading some media portrayals of the social media fast. If the only sites you are reading about this request are still calling the Church “the Mormon Church,” then it should already viewed as suspect. Either this is not a real journalist, or it is a journalist who is purposefully ignoring the Church’s new style guide (even in just the headline – the editor should follow the style guide). It doesn’t mean everything they have to say is inaccurate or from a particular agenda, but their objectiveness may be in question.

PPS: Since originally writing this, I have finished Alma! #hollah

Keys to Ending Global Poverty: Growth and Migration

Harvard’s Lant Pritchett has an incredible new paper out that looks at the best course for eliminating global poverty:

So think of two ways to help the global poor. One is for rich people (in a global sense) to give a dollar and get roughly a dollar’s worth of benefits for the poor. The other people is for rich people to allow people who would like to work at the prevailing wage of their country to do so and not deploy active coercion to prevent this—which reflects the person’s contribution to product and hence is (or can be made to be) zero net cost to the host country. Of course, a dollar for a poor person could produce vastly more human well-being than had the richer person spent the money as the marginal utility was much, much higher for the poor person, but this redistribution effect is the same for both options. This means, at least in current conditions, the least you can do—just increasing the freedom of people who want to work and people who want those people to work to carry out that mutually beneficially transaction across national borders—is better than the best you can do of trying to directly help people in poverty but without allowing them to move to opportunity (pg. 1-2).

Pritchett looks at the Ultra Poor Graduation program, whose stated claim is “to graduate ultra poor households out of extreme poverty to a more stable state. This 24-month program provides beneficiaries with a holistic set of services including: livelihood trainings, productive asset transfers, consumption support, savings plans, and healthcare” (pg. 9). Pritchett finds that this program led to an average income gain of $344 dollars by the third year for targeted households. “The five country average NPV of costs per household of the 24 month program was $4,545” (pg. 9).

While Pritchett recognizes that redistribution can indeed benefit the poor, its impact is quite small. He concludes,

A large part of the explanation of differences in labor productivity across countries is differences in “A”—total factor productivity. Transmitting A from country to country has proven difficult. This implies that labor with the exact same intrinsic productivity will have much higher productivity (and hence justify a higher wage) in a high A than in a low A country. But, by and large, rich countries have passed extraordinarily strict regulations on the movement of unskilled labor. A relaxation of these restrictions could produce the largest single gains in global poverty of any available policy, program or project action. And since these gains to movers are (mostly) due to higher A which (at the margin) is a “public good” (it is non-rival and non-excludable) in the host country these gains are essentially free to the host country (or could be free to the host country under some technical design conditions).

Comparing the annual gains of the Ultra Poor Graduation program ($344 per household for a cost of $4,545) to those of a low-skill worker simply moving to and working in the United States ($17,115), Pritchett finds that the Ultra Poor Graduation program would have to invest $226,000 per person in order to match the gains of migration. Furthermore,

sustained rapid economic growth in developing countries—that is sustained by improvements in A—can also produce cumulatively enormous gains. And avoiding growth collapses/stagnation can prevent enormous losses. So, even though traditional measures of the country to country transfers of resources via “foreign aid” do not, in and of themselves, appear to be responsible for producing most of the observed differences in economic growth, investments that could bring that about more sustained growth (both more sustained accelerations and fewer sharp and extended decelerations) could also have astronomical returns. 

As Bryan Caplan sums it up, “Virtually all poverty reduction comes from economic growth and migration – not redistribution or philanthropy.”

What Does Economic Mobility in the U.S. Actually Look Like?

Economist Russ Roberts gives us some insights:

Studies that use panel data — data that is generated from following the same people over time — consistently find that the largest gains over time accrue to the poorest workers and that the richest workers get very little of the gains. This is true in survey data. It is true in data gathered from tax returns.[ref]More panel data can be found in a 2007 Treasury Department report, a 1995 Dallas Fed report, and a 1992 Treasury Department report.[/ref] 

Here are some of the studies that find a very different picture of the impact of the American economy on the economic well-being of the poor, middle, and the rich.

This first study, from the Pew Charitable Trusts, conducted by Leonard Lopoo and Thomas DeLeire uses the Panel Study of Income Dynamics (PSID) and compares the family incomes of children to the income of their parents. Parents income is taken from a series of years in the 1960s. Children’s income is taken from a series of years in the early 2000s. As shown in Figure 1, 84% earned more than their parents, corrected for inflation. But 93% of the children in the poorest households, the bottom 20% surpassed their parents. Only 70% of those raised in the top quintile exceeded their parent’s income.

Chetty et al find a similar pattern. In an otherwise gloomy assessment of American progress, they find that 70% of children born in 1980 into the bottom decile exceed their parents’ income in 2014. For those born in the top 10%, only 33% exceed their parents’ income.

The poor may find it easier to do better than their parents. But how much better off do they end up? Julia Isaacs’s study for the Pew Charitable Trusts finds that children raised in the poorest families made the largest gains as adults relative to children born into richer families.

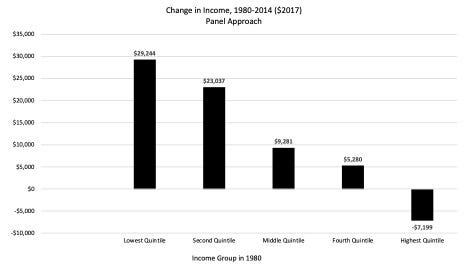
In short, “the children from the poorest families added more to their income than children from the richest families. That reality isn’t consistent with the standard pessimistic story that only the richest Americans have benefited from economic growth over the last 30–40 years.” Another “study looks at people who were 35–40 in 1987 and then looks at how they were doing 20 years later, when they are 55–60. The median income of the people in the top 20% in 1987 ended up 5% lower twenty years later. The people in the middle 20% ended up with median income that was 27% higher. And if you started in the bottom 20%, your income doubled. If you were in the top 1% in 1987, 20 years later, median income was 29% lower.” A recent study found that when you follow quintiles, “[o]nly the people at the top gain much of anything between 1980 and 2014.” However, when you follow people, the same study finds that “the biggest gains go to the poorest people. The richest people in 1980 actually ended up poorer, on average, in 2014. Like the top 20%, the top 1% in 1980 were also poorer on average 34 years later in 2014. The gloomiest picture of the American economy is not accurate. The rich don’t get all the gains. The poor and middle class are not stagnating.”

Roberts concludes,

There’s a lot more to study and understand. But what the studies above show is that the economic growth of the last 30–40 years has been shared much more widely than is generally found in the cross-section studies that compare snapshots at two different times, following quintiles rather than people. No one of these studies is decisive. They each make different assumptions about income…which people to include, how to handle inflation. Together they suggest the glass isn’t as empty as we’ve been led to believe. It’s at least half-full.