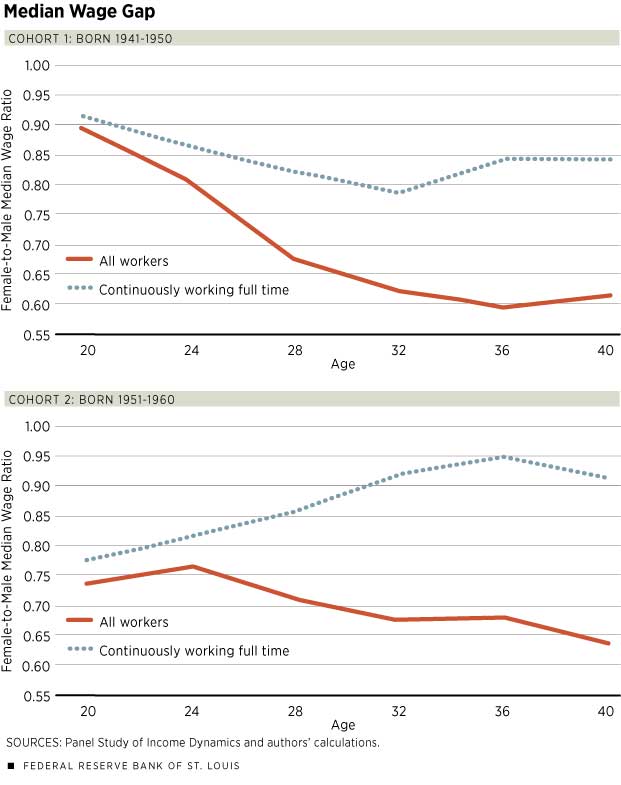
I’ve written about the gender wagegapbefore. An October 2016 article in the St. Louis Fed’s The Regional Economist “examine[s] the evolution of the wage gap by cohorts” as well as “the evolution over the life cycle to gain further insight into the patterns and possible causes of the gender wage gap.” The researchers find that
the gap increases with age, at least after the age of 24, which is the age by which the majority of individuals have completed their education. Thus, the gender gap when workers are 24 is substantially smaller than the gap when workers are in their mid-30s. This fact is well-known, and one of the main reasons for this pattern is that men and women make different choices over the life cycle. As they get older, women are more likely than men to work fewer hours outside the home and have breaks in their labor force participation (yielding less accumulated experience and possibly fewer labor market skills) and are less likely to hold highly compensated jobs with promotion prospects.
But why a gap at all?
Specifically, firms often have costs of hiring and training workers. When they hire people for jobs with good promotion prospects and jobs that require training and long hours, they are likely to seek individuals who are less likely to leave the labor force or to reduce their hours substantially. While some women are more inclined to participate in the labor market and work full time, women in general are still more likely to reduce hours or leave the labor force, especially during childbearing years, relative to what men are likely to do. This can lead to lower wages for equally qualified women. Furthermore, since many factors affecting labor supply are not known to employers at the time of hiring, even women who are likely to work long hours and are attached to the labor market as much as men are may earn lower wages because, on average, women with the same qualifications as men are less attached to the labor force than men are.
This type of discrimination is often called statistical discrimination because group affiliation and group averages adversely affect individuals in the group. Over time, employers can typically observe work experience, whether individuals were working and whether they were working full time or part time. Therefore, employers can increasingly identify workers who are less attached to the labor market and, as a result, discrimination of the type described above goes down with age. Since this type of discrimination is more likely to be directed at women, the wages of women who work full time continuously may grow relative to the wages of men due to a decline in discrimination.
They note,
We investigated the changes in the education composition of men and women who work full time continuously in each cohort. For the group working full time continuously in the first cohort [1941-1950], females were more educated than males up to age 28; however, the wage gap is declining when males are more educated than females. In the second cohort [1951-1960], the education gap among those working full time continuously declines (with females being more educated than males in all age groups). Thus, education composition does not explain the evolution of the gender pay gap differences in that group.
They conclude,
By comparing the differences in the evolution of the gender pay gap not only by age but by full-time/part-time status, we demonstrated the importance of statistical discrimination and its relationship to labor force participation of women. As one would expect, this type of discrimination plays a smaller role for the third cohort (born 1961-1970) because women in this cohort are more attached to the labor force than women in the past.
Open borders, according to economist Nathan Smith writing in Foreign Affairs, is the
complete freedom of migration worldwide, with rare exceptions for preventing terrorism or the spread of contagious disease. Borders would still exist in such a world, but as jurisdictional boundaries rather than as barriers to human movement. Ending migration controls in this way would increase liberty, reduce global poverty, and accelerate economic growth. But more fundamentally, it would challenge the right of governments to regulate migration on the arbitrary grounds of sovereignty.
Smith points out that
Gallup has estimated that 640 million people worldwide want to emigrate from their current country of residence. Yet the true number could be much greater—economists such as John Kennan predict that in the absence of border controls, global labor markets would tend toward equilibrium, which in practice would mean the migration of several billion people to the West. (In the short to medium run, the true number of immigrants would be closer to Gallup’s estimates, but over the long run that figure might reach into the billions, as stocks of immigrants and their descendants accumulate in destination countries.) The more efficient allocation of labor would result in global increases in productivity, leading the world economy to nearly double in size. This increased economic activity would, moreover, disproportionately benefit the world’s poorest people.
Smith acknowledges,
At current levels of benefits, a vast influx of immigrants would bankrupt the welfare state, as newcomers would not be able to pay enough in taxes to finance the benefits to which they would be entitled. (A possible solution might involve curtailing welfare programs, or at least their generosity to the foreign-born.) It follows that open borders would probably lead to a large increase in visible extreme poverty in the West. Yet impoverishment by Western standards looks like affluence to much of the world. And far from creating such poverty, open borders would actually be alleviating it. The new huddled masses, although worse off than the average Western natives, would be better off in their new countries than they were at home. The only difference would be that without borders, Westerners would see the poverty that today is kept comfortably out of sight.
He concludes,
Opening borders would expand the scope of freedom, strengthen respect for rights, and widen the realm of actions that governments, including democratic ones, are not allowed to take. This endeavor is an extension of the liberal project that has animated the West since the Enlightenment. And those who sympathize with abolishing migration restrictions, but fear how popular backlash against immigration has recently affected Western democracy, should ask themselves whether freedom can really be secure if its growth is curtailed; whether respect for rights can be compatible with the exclusion of the foreign-born; and whether, in the United States, immigrants are really a greater threat to freedom and the rule of law than are native-born devotees of the president, Donald Trump.
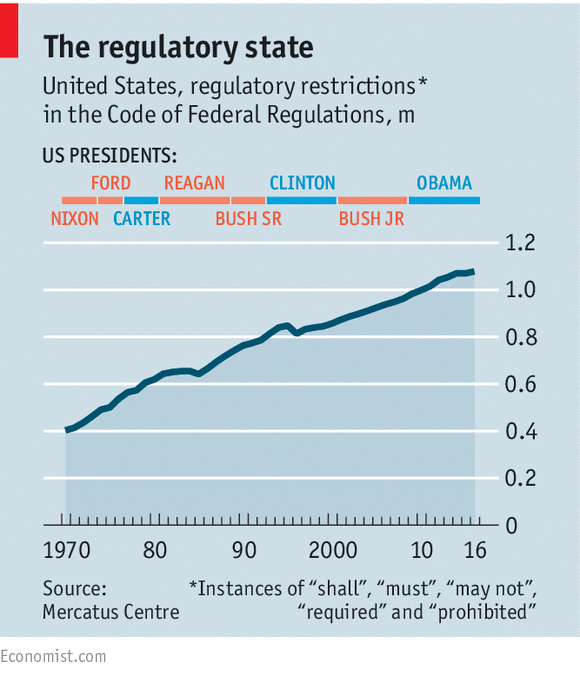
the number of prescriptive words like “shall” or “must” in the code of federal regulations grew from 403,000 to nearly 963,000, or about 15,000 edicts a year, according to data compiled by the Mercatus Centre, a libertarian-leaning think-tank. Between 2008 and 2016, under Mr Obama, about the same number of new rules emerged annually.
The unyielding growth of rules, then, has persisted through Republican and Democratic administrations…Several factors explain it. First, Congress has neither the staff nor the expertise to write complex, technical laws. So lawmakers happily let experts in government agencies fill in the blanks. What Congress does write itself, it writes sloppily. In 2015 the Supreme Court found “more than a few examples of inartful drafting” in the Affordable Care Act. One such error nearly saw the court strike down crucial parts of law; only semantic gymnastics saved it. The “Chevron deference”, a doctrine from a 1984 court ruling, gives agencies wide latitude to interpret laws when they are vaguely written.
Second, America’s division of powers makes it easy for interest groups to defend any one regulation, tax break or policy. That forces administrations to solve problems by taping yet more rules onto whatever exists already, rather than writing something simple from scratch. Over time, this gums up the system, resulting in what Steve Teles of Johns Hopkins University has dubbed a “kludgeocracy”. This explains, for instance, why over half of Americans have to pay a professional to fill out their tax return for them (in Britain, for comparison, most people need not even complete one).
The biggest culprit though? What the article calls “the habits of Washington’s bureaucracy”:
When a government agency writes a significant regulation—mostly defined as one costing more than $100m—it must usually prove that the rule’s benefits justify its costs. Its analysis goes through the Office of Information and Regulatory Affairs (OIRA), a nerdy outpost of the White House. The process is meticulous. The OECD, a club of mostly rich countries, finds that America’s analysis of regulations is among the most rigorous anywhere.
But once a rule has cleared the hurdle, there is little incentive for agencies ever to take a second look at it. So it is scrutinised only in advance, when regulators know the least about its effects, complains Michael Greenstone, of the University of Chicago. The OECD ranks America only 16th for “systematic” review of old red tape. (The leading country, Australia, has an independent body tasked with dredging up old rules for review.)
…The endless pile-up of regulation enrages businessmen. One in five small firms say it is their biggest problem, according to the National Federation of Independent Business, a lobby group. (Many businessmen grumble in private about the Obama administration’s zealous regulatory enforcement). Based on its own survey of businessmen, the World Economic Forum ranks America 29th for the ease of complying with its regulations, sandwiched between Saudi Arabia and Taiwan.
Read the whole piece.[ref]I’ve highlighted a few Mercatus Center studies on regulation here and here.[/ref]
The sustained higher rate of real GDP growth in the United States over a longer period of time has resulted in a substantially higher level of real GDP per capita in the United States than in other major industrial countries. In 2015, real GDP per capita was $56,000 in the United States. On a purchasing power basis, the real GDP per capita in that same year was only $47,000 in Germany, $41,000 in France and the United Kingdom, and just $36,000 in Italy. So the official measures of real GDP clearly point to the cumulative result of higher sustained real growth rates in the United States than in the major industrial countries of Europe and Asia.
How is this rate of real GDP growth achieved? Feldstein lists 10 reason:
(1) An entrepreneurial culture. Individuals in the United States demonstrate a desire to start businesses and grow them and a willingness to take risks. There is no penalty in the U.S. culture for failure and for starting again. Even students who have gone to college or to a business school show this entrepreneurial desire. The successes in silicon valley and with such firms as Facebook inspire entrepreneurial activities.
(2) A financial system that supports entrepreneurial activities. The United States has a more developed system of equity finance than the countries of Europe and a decentralized banking system that helps local entrepreneurs. The equity finance system includes “angel investors” willing to finance start-up firms and a very active venture capital market that helps finance the growth of firms. The national system of small local banks that provide loans to new businesses includes more than 7,000 individual small banks that are important in their local communities.
(3) World class research universities. These produce much of the basic research that drives the high-tech entrepreneurial activities. Faculty members and doctoral graduates often spend time in new businesses that are located near these universities. The culture of the universities and of the businesses welcomes these overlapping activities between academia and the private sector. The great research universities attract talented students from around the world, many of whom end up remaining in the United States. (4) Labor markets that generally link workers and jobs unimpeded by large trade unions, state-owned enterprises, or excessively restrictive labor regulations. In the private sector, less than seven percent of the labor force is unionized. There are virtually no state-owned enterprises. While labor laws and regulations affect working conditions and hiring rules, they are much less onerous than in Europe. State level licensing rules are the probably the most serious barrier to job changing and to interstate mobility. (5) A growing population, reflecting both natural growth and immigration. The growing population means a younger and therefore more flexible and trainable workforce. A high degree of geographic mobility within the United States increases the effectiveness of the labor force. The higher level of real income makes the United States an attractive destination for ambitious and talented young people around the world. Although there are restrictions on immigration to the United States, there are also special rules that provide access to the U.S. economy and a path for citizenship (“green cards”) based on individual talent and industrial sponsorship. A separate special “green card lottery” provides a way for eager people to come to the United States.
(6) A culture and a tax-transfer system that encourages hard work and long hours. The average employee in the United States works 1800 hours per year, substantially longer than the 1500 hours worked in France and the 1400 hours worked in Germany. Of course workers in some Asian countries work much longer hours, with working hours over 2200 per year in Hong Kong, Singapore, and Korea.
(7) A supply of energy that makes North America energy independent. The private ownership of land and mineral rights has facilitated a rapid development of fracking to expand the supply of oil and gas.
(8) A favorable regulatory environment. Although the system of government regulations needs improvement, it is less burdensome on businesses than the regulations imposed by European countries and the European Union.
(9) A smaller size of government than in other industrial countries. According to the OECD, outlays of the U.S. government at the federal, state and local levels totaled 38 percent of GDP while the corresponding figure was 44 percent in Germany, 51 percent in Italy and 57 percent in France. The higher level of government spending in other countries implies that not only is a higher share of income taken in taxes but also that there are higher transfer payments that reduce incentives to work. … So Americans have a higher pre-tax reward to working and can keep a larger share of their earnings.
(10) The U.S. has a decentralized political system in which states compete. The competition among states encourages entrepreneurship and work effort and the legal systems protect the rights of property owners and entrepreneurs. The United States political system assigns many legal rules and taxing power to the fifty individual states. The states then compete for businesses and for individual residents by their legal rules and tax regimes. Some states have no income taxes and have labor laws that limit unionization. States provide high quality universities with low tuition for in-state students. They compete also in their legal liability rules. The legal systems attract both new entrepreneurs and large corporations. The United States is perhaps unique among high-income nations in the degree of decentralization.
The heated debate over school choice was sparked again by the nomination and appointment of Betsy DeVos to Secretary of Education. I’m not so much interested in DeVos as I am the evidence regarding school choice. One professor claims that economists are skeptical of school choice, with only 1/3 of economists supporting it. John Oliver has even taken charter schools to task.[ref]If you need a rundown on what a charter school actually is, this NPR article is helpful.[/ref] As Reason summarizes,
Oliver’s segment…was almost unrelieved in its criticism of charters. Echoing the talking points of major teachers unions and liberal interest group such as People for the American Way and the NAACP, the HBO host attacked charters for being unaccountable to local and state authorities (this is not true, as all state charter laws have various types of oversight rules built into them), “draining” resources from traditional public schools (which presumes tax dollars for education belong to existing power structures), and skimming students (in fact, charters teach a higher percentage of racial and ethnic minorities than traditional public schools; they also serve a higher percentage of economically disadvanataged kids). Which is not to say that Oliver is all wrong in his analysis. For instance, he ran through a series of charters that were criminally mismanaged and deserved to be shut down (even as he glossed over the fact that failing charters, unlike failing traditional schools, are more likely to be closed). And he’s right to argue that, on average, charters perform about the same as regular public schools. However, such comparisons tell us very little about whether charters do help those at-risk students better than traditional schools. On this score, there is very little doubt that charters do more with less money and fewer resources.
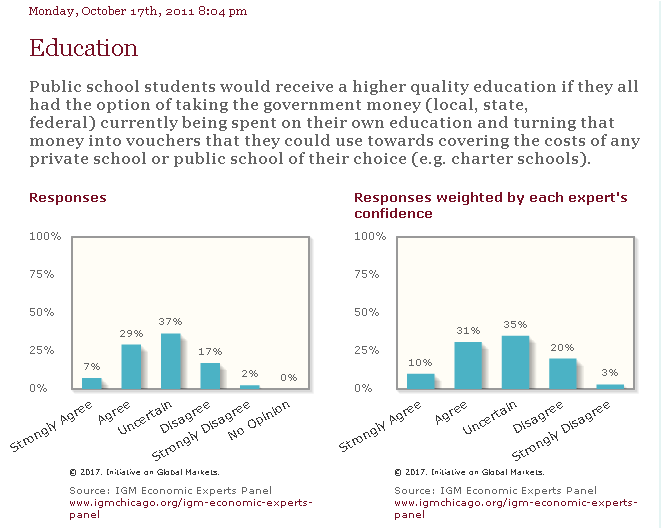
So what is the evidence? First and foremost, the claim “only a third of economists on the Chicago panel agreed that students would be better off if they all had access to vouchers to use at any private (or public) school of their choice” is misleading if not technically incorrect. Here’s the poll:
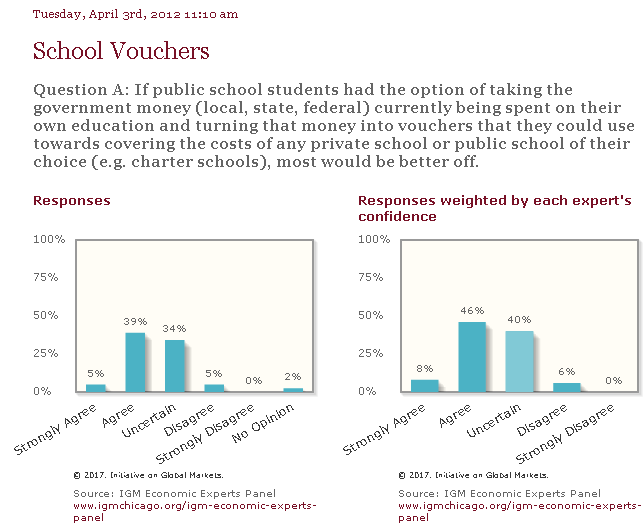
As Slate Star Codex responds, “A more accurate way to summarize this graph is “About twice as many economists believe a voucher system would improve education as believe that it wouldn’t.” By leaving it at “only a third of economists support vouchers”, the article implies that there is an economic consensus against the policy. Heck, it more than implies it – its title is “Free Market For Education: Economists Generally Don’t Buy It”. But its own source suggests that, of economists who have an opinion, a large majority are pro-voucher.” This is especially true when you look at a more recent poll:
But what about empirical evidence? Harvard’s Martin West sums up the evidence for school choice as such:
First, the benefits of attending a private school are greatest for outcomes other than test scores—in particular, the likelihood that a student will graduate from high school and enroll in college. Second, attending a school of choice, whether private or charter, is especially beneficial for minority students living in urban areas. These findings support the case for continued expansion of school choice, especially in our major cities. They also raise important questions about the government’s reliance on standardized test results as a guide for regulating the options available to families.
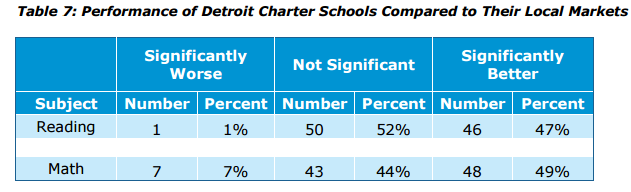
For example, a 2013 study found that private-school vouchers have no significant effects on college enrollment except for African-American and Hispanic students. The impact on the former was substantial, while the latter was small and statistically insignificant. Another study that has been trumpeted as demonstrating that “Detroit’s charter schools performed at about the same dismal level as its traditional public schools” actually supports quite the opposite.
CREDO, 2013, pg. 44.
The study concludes,
Based on the findings presented here, the typical student in Michigan charter schools gains more learning in a year than his TPS counterparts, amounting to about two months of additional gains in reading and math. These positive patterns are even more pronounced in Detroit, where historically student academic performance has been poor. These outcomes are consistent with the result that charter schools have significantly better results than TPS for minority students who are in poverty (pg. 44).
Margaret Raymond, Director of Stanford’s Center for Research on Education Outcomes (CREDO),[ref]The group behind the study mentioned above.[/ref] authored a Huffington Post piece to correct some misperceptions about what the evidence shows regarding charter schools. Referring to a 2013 study, Raymond writes,
The main findings of the report are as follows. Over the course of a school year, charter school students learn more in reading than district public schools — it is as if the charter school students attended about seven more days of school in a typical school year. The learning in math is not statistically different (not worse as she claims).
[But these] results…are the average one-year growth, blending brand new charter school enrollees with students with longer persistence. When the length of time a student attends a charter school is taken into account, the results are striking: In both reading and math, we discovered that students’ annual progress rose strongly the longer they attended charter schools. For students with four or more years in charter schools, their gains equated to an additional 43 days of learning in reading and 50 additional days of learning in math in each year.
Second, the results showed strong improvement for the sector overall — the proportion of charter schools outperforming their local district schools rose and the share that underperformed shrank in both reading and math compared to performance four years earlier. The shift in performance is neither idle drift nor nefarious conduct on the part of charter schools — we found no differences in the demography of students served by charter schools over the period.
…Urban low income and minority students are the ones best advantaged in charter schools. CREDO released “The Urban Charter School Study“ in 2015, a report conveniently overlooked by Weingarten. We found that gains in urban charter schools are dramatic overall (equivalent to 28 days of additional learning in reading and 40 days of additional learning in math every year) but for low income minority students they are nothing short of liberating: as much as 44 extra days of learning in reading and 59 extra days in math.
Jay P. Greene, Distinguished Professor and Head of the Department of Education Reform at the University of Arkansas, notes,
[W]e have four RCTs on the effects of charter schools that allow us to know something about the effects of charter schools with high confidence. Here is what we know: students in urban areas do significantly better in school if they attend a charter schools than if they attend a traditional public school. These academic benefits of urban charter schools are quite large. In Boston, a team of researchers from MIT, Harvard, Duke, and the University of Michigan, conducted a RCT and found: “The charter school effects reported here are therefore large enough to reduce the black-white reading gap in middle school by two-thirds.”
The same Stanford researcher conducted an RCT of charter schools in Chicago and found: “students in charter schools outperformed a comparable group of lotteried-out students who remained in regular Chicago public schools by 5 to 6 percentile points in math and about 5 percentile points in reading…. To put the gains in perspective, it may help to know that 5 to 6 percentile points is just under half of the gap between the average disadvantaged, minority student in Chicago public schools and the average middle-income, nonminority student in a suburban district.”
And the last RCT was a national study conducted by researchers at Mathematica for the US Department of Education. It found significant gains for disadvantaged students in charter schools but the opposite for wealthy suburban students in charter schools. They could not determine why the benefits of charters were found only in urban, disadvantaged settings, but their findings are consistent with the three other RCTs that found significant achievement gains for charter students in Boston, Chicago, and New York City.
When you have four RCTs – studies meeting the gold standard of research design – and all four of them agree that charters are of enormous benefit to urban students, you would think everyone would agree that charters should be expanded and supported, at least in urban areas. If we found the equivalent of halving the black-white test score gap from RCTs from a new cancer drug, everyone would be jumping for joy – even if the benefits were found only for certain types of cancer.
I find that winning a lottery for admission to a preferred school at the high school level reduces the total number of felony arrests and the social cost of crime. Among middle school students, winning a school-choice lottery reduces the social cost of crime and the number of days incarcerated. Importantly, I find that these overall reductions in criminal activity are concentrated among students in the highest-risk group. Indeed, I find little impact either positive or negative of winning a school-choice lottery on criminal activity for the 80 percent of students outside of this group.
Consider first the results for high school students in the high-risk group. Among these students, winning admission to a preferred school reduces the average number of felony arrests over the study period from 0.77 to 0.43, a pattern driven largely by a reduction of 0.23 in the average number of arrests for drug felonies (see Figure 2). The average social cost of the crimes committed by high-risk lottery winners (after adjusting the cost of murders downward) is $3,916 lower than for lottery losers, a decrease of more than 35 percent. (Without adjusting for the cost of murder, I estimate the reduction in the social cost of crimes committed by lottery winners at $14,106.) High-risk lottery winners on average commit crimes with a total expected sentence of 35 months, compared to 59 months among lottery losers.
Among high-risk middle-school students, I find no effect of winning a school-choice lottery on the average number of felony arrests. Although the number arrests for violent felonies falls, this is offset by an increase in the number of property arrests. Because violent crimes carry greater social costs, however, winning a school-choice lottery reduces the average social cost of the crimes committed by middle school students by $7,843, or 63 percent. It also reduces the total expected sentence of crimes committed by each student by 31 months (64 percent).
For the nation’s 17-year-olds, there have been no gains in literacy since the National Assessment of Educational Progress began in 1971. Performance is somewhat better on math, but there has still been no progress since 1990. The long-term stagnation cannot be attributed to racial or ethnic differences in the U.S. population. Literacy scores for white students peaked in 1975; in math, scores peaked in the early 1990s.
International literacy and numeracy data from the OECD’s assessment of adult skills confirms this troubling picture. The numeracy and literacy skills of those born since 1980 are no more developed than for those born between 1968 and 1977. For the average OECD country, by contrast, people born between 1978 and 1987 score significantly better than all previous generations.
Comparing the oldest—those born from 1947 to 1957—to youngest cohorts—those born from 1988 to 1996, the U.S. gains are especially weak. The United States ranks dead last among 26 countries tested on math gains, and second to last on literacy gains across these generations. The countries which have made the largest math gains include South Korea, Slovenia, France, Poland, Finland, and the Netherlands.[ref]This is the difference between cognitive skills and merely going to school.[/ref]
Rothwell in part points to “a decline in bureaucratic efficiency” in primary and secondary education.[ref]He also acknowledges “that teaching itself has become increasingly unattractive.” We could maybe learn from Finland in this regard.[/ref] With declining productivity in schools, it’s worth pointing out that some economic evidence finds that competition in public-school districts boosts school productivity, raises student achievement, and decreases spending. Furthermore, recent evidence shows that “autonomous government schools” (e.g., charters) have higher management quality than regular public or private schools. This higher management quality in turn is strongly linked to better pupil outcomes.
For reading impacts, overall, we find positive effects of about 0.17 standard deviations (null for US programs, 0.24 standard deviations for non-US programs)…For math scores, we report 10 meta-analytic ITT effect sizes (seven in the US and three outside of the US). Overall, vouchers have a positive effect on math of 0.11 standard deviations, 0.07 standard deviations in the US and 0.15 standard deviations outside of the US.
The overall results just described in this section are for the final year of data in each study. It could be that these effects are not representative of the initial effects one might expect from a new program. In fact, our analysis of the effects by year indicates that the effects of private school voucher programs often start out null in the first one or two years and then turn positive. Longer-term achievement effects, of course, are much more salient than immediate achievement effects whenever longer-term effects are available
…Additionally, in terms of policy implications, it is critical to consider the cost-benefit tradeoffs associated with voucher programs. Wolf & McShane (2013) and Muralidharan et al. (2015) found that vouchers are cost effective, since they tend to generate achievement outcomes that are as good as or better than traditional public schools but at a fraction of the cost. The greater efficiency of school choice in general and school vouchers in particular are another fruitful avenue for scholarly inquiry (pgs. 39-41).
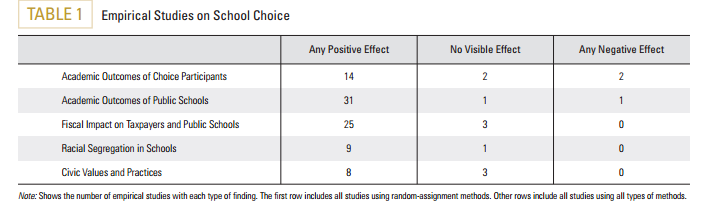
Another 2016 study looked at the various empirical studies that have been conducted on school choice. The following chart lists the key findings:[ref]Some of the negative findings were arguably due to overregulation.[/ref]
Forster, 2016, pg. 2.
Given these positive findings, it’s little wonder that a majority of Americans are dissatisfied with our education system while a large majority support school choice (especially parents). Granted, there are empirically-tested ways to improve regular public schools and I’m all for it. But with the evidence above, maybe school choice isn’t the bogeyman it has been made out to be.[ref]A bogeyman largely created by teachers’ unions, which tend to harm children’s prospects.[/ref]
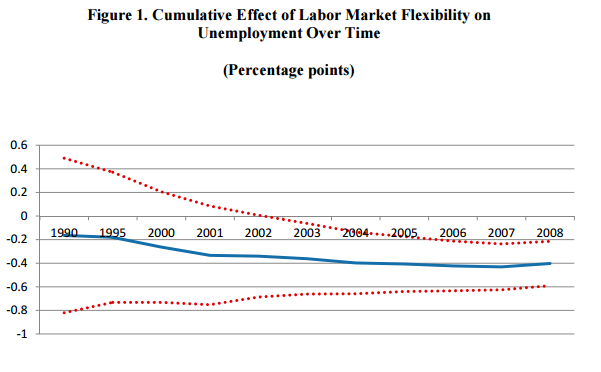
…A well-functioning and efficient labor market is, no doubt, one of the ingredients which account for Denmark’s economic prosperity. It is certainly responsible for the low unemployment rates the country has enjoyed over the last decades. The Danish experience should open the eyes of those European governments that refuse to undertake reforms which liberalize their labor markets. The evidence is clear: labor flexibility results in lower unemployment. Will the Danish example be followed by those countries badly hit by the plague of unemployment?
The papers the author cites are worth highlighting. The first is a 2012 IMF paper analyzing 97 countries from 1985 to 2008. The researchers report,
Our findings indicate that, after controlling for other macroeconomic and demographic variables, increases in the flexibility of labor market regulations and institutions have a statistically significant negative impact both on the level and the change of unemployment outcomes (i.e., total, youth, and long-term unemployment). Among the different labor market flexibility indicators analyzed, hiring and firing regulations and hiring costs are found to have the strongest effect.
Overall the results of the paper suggest that policies that enhance labor market flexibility should reduce unemployment. At the same time, this raises the issue of the design and possible sequence of such reforms, and the adoption of policies aimed also to improve the quality of employment and to minimize possible negative short-term effects, not investigated in this paper, on inequality and job destruction. While data available for our large set of countries lack the necessary level of details to answer this question, micro- and macro-studies on OECD countries over the decade showed that it is important to protect workers, rather than jobs, by coupling of unemployment benefits with pressure on unemployed to take jobs and measures to help them (Blanchard, 2006). Moreover, employment protection should be designed in such a way to internalize social costs and not inhibit job creation and labor reallocation. Artificial restrictions on individual employment contracts should also be avoided (pg. 12).
Bernal-Verdugo et al., 2012, pg. 13.
The next piece is a 2016 working paper that explores labor markets in Italy from 2001-2013. It explains,
Why have unemployment dynamics been so different in European countries? One of the most often cited explanation is the difference in labor market institutions that prevents wages from adjusting downward. If wages cannot decline, negative aggregate demand shocks (such as the Great Recession) result in unemployment growth. On the other hand, if wages can fall, labor markets reach a new equilibrium with unemployment rates returning to normal levels. Downward adjustment of wages in response to macroeconomic shocks is especially important in the euro area where labor markets cannot accommodate shocks through exchange rate depreciation or through internal labor mobility (migration among EU countries is much more limited than, for example, labor mobility across US states).
…We find that the wage differential between formal/regulated and informal/unregulated sectors has increased after 2008. Moreover, while wages in the informal sector decreased by about 20 percent in 2008-13, wages in the formal sector virtually did not fall. This is consistent with the view of a substantial downward stickiness of wages in the regulated labor market. Importantly, before the recession, wages in the formal and informal sectors moved in parallel — confirming the validity of the parallel trends assumption required for a difference-in-differences estimation and showing that both regulated and unregulated labor markets have a similar degree of upward flexibility of wages.
We also analyze the impact of the crisis on formal and informal employment. We find that formal employment decreases substantially while informal employment does not change. Since the aggregate demand shock affects both labor markets, this finding implies that upon losing a job in the formal sector at least some workers move to the informal sector. We calibrate a simple model describing such spillovers between formal and informal labor markets. Using the existing estimates for demand and supply elasticities for the Italian labor market, we estimate the degree of integration of formal and informal sector (i.e. the share of workers who move from the formal to the informal labor market after the crisis). Our model also allows to carry out a counterfactual analysis of the formal sector’s response to crisis in a scenario where formal wages were fully flexible. We find that in this case the crisis would have resulted in a much smaller decline in formal employment between 2008 and 2013 (1.5-4.5 percent rather than the actual 16 percent) (pg. 3-4).
Gallup’s Jonathan Rothwell conducted a study toward the end of last year that found “those who view Trump favorably have not been disproportionately affected by foreign trade or immigration, compared with people with unfavorable views of the Republican presidential nominee. The results suggest that his supporters, on average, do not have lower incomes than other Americans, nor are they more likely to be unemployed.” Now, Rothwell is back with another study suggesting that the supposed “China Shock” is actually overblown. Rothwell writes,
…[O]ne important achievement of [Autor, Dorn, Hanson, 2013] is its innovative methodology and framework, which has allowed scholars to better understand how import competition affects local areas. Nonetheless, my analysis and extension — which greatly benefited from Autor et al.’s coding and data — conclude that their findings about the harm from import competition at the community level are not robust, beyond the manufacturing sector, and, even then, only in the later period. At the individual level, and consistent with results from Autor et al. (2014), I find that workers in import-intensive industries have a strong attachment to the labor force and are as likely to be employed as workers in other industries.
…Though [Autor et al.’s] paper makes an enormous methodological contribution and provides further and robust evidence that Chinese imports—rather than only technological change—reduced U.S. manufacturing employment, the evidence presented here suggests the paper’s most important findings do not withstand further scrutiny.
…If China had remained a communist country and closed to trade, it is quite likely that manufacturing workers around the world would have enjoyed higher wage growth. While manufacturing job loss probably would not have been as significant, the increased competition from China did not create labor market conditions that appear dramatically different than what workers face in other industries such as retail, restaurants and engineering firms. In fact, the evidence is clear that manufacturing work remains a source of relatively high pay, long tenure, and low layoff risk, despite the intensity of import competition (pg. 20).
What is likely surprising to many, Rothwell found that
for the 1990-to-2000 period, there is no evidence that import competition resulted even in manufacturing job loss. Indeed, many of the manufacturing-specific models show that import competition resulted in a large increase in the average wages of manufacturing workers. The positive wage effect is evident outside of the manufacturing sector, particularly for noncollege educated workers and males. Taken literally, these models show that import competition during the 1990s caused a substantial increase in wages for the average worker. These models also show that import competition increased employment growth for college-educated, nonmanufacturing-sector workers and population growth for people aged 35 to 64.
Of the 45 models with significant effects in the stacked regression, only five retain significance in the expected direction during 1990 to 2000, and each of these pertain to transfer payments. These results could be explained by the population growth of pre-retirement-age workers, as health problems and risk of retirement are increasingly sharply with age. Overall, it appears that import competition in the 1990s was, if anything, largely beneficial to the average worker in the local areas most exposed to competition (pg. 18).
A new job market paper deals another blow to the “China Shock” theory. Using microdata from the US Census Bureau, the author
showed that the employment of US manufacturing firms rose in response to increasing Chinese imports in US output markets. More exposed firms expanded employment (i) in manufacturing, as they hired production workers whom they paid higher wages, and (ii) in non-manufacturing, by adding jobs in R&D, design, engineering, and headquarters services. In other words, China caused a relative expansion of US employment in firms operating in industries that experienced the largest growth in Chinese imports. I argued theoretically, and provided reduced-form evidence, that this was possible through firms’ reorganization toward less exposed output industries, in which the US had a comparative advantage relative to China. In these output industries, firms expanded skilled employment by taking advantage of falling production costs due to increased offshoring to China.
The evidence provided in this paper indicate that the employment losses at the establishment level, measured by the previous papers (Acemoglu et al., 2016; Autor et al., 2013), were compensated by the employment gains that resulted from two sources. First, within-firm reorganization allowed US manufacutring firms to escape the negative impact of the China shock; US manufacturing firms reorganized their activities in many dimensions in response to the China shock. On the one hand, they reorganized their US activity from exposed to non-exposed US output markets. On the other hand, they reorganized their input sourcing as they replaced domestic suppliers with foreign suppliers and increased foreign direct investment. Second, employment at US manufacturing firms expanded in response to the combined effect of increased Chinese imports in US output and input markets. This is because increased imports in the input markets put downward pressure on US manufacturing firms’ cost of sourcing material inputs. Thus, the China shock to the firm’s input markets acted as a favorable cost shock that compensated for some or all of the negative impacts of the increased output market competition.
All of these suggest that the China shock impacted US manufacturing employment in a more nuanced way than simply increasing output market competition at the establishment level, which captures only the losses that resulted from the shock. Reorganization at the firm level and the combined effects of input and ouput market shocks can lead to net job creation. However, this may not involve the same workers in the same industries, in the same regions of the US or the same establishments of the firm (pg. 51).
When one considers the other benefits of trade, it becomes increasingly clear that globalization is not the demon it has been made out to be.
I’ve posted before about McKinsey’s findings regarding digital globalization. They reported,
Data flows directly accounted for $2.2 trillion, or nearly one-third, of [globalization’s] effect [in a decade]—more than foreign direct investment. In their indirect role enabling other types of cross-border exchanges, they added $2.8 trillion to the world economy. These combined effects of data flows on GDP exceeded the impact of global trade in goods.
This in turn supported research by economist Andreas Bergh, who found that
the poverty-decreasing effect of globalization is bigger in countries where institutions are worse. The graph below shows how the marginal effect of information flows on poverty varies depending on the level of bureaucratic quality. The slope looks the same for all institutional indicators, suggesting that globalization is especially important for the poor in countries with high corruption levels and inefficient public sectors.
A new Harvard working paper supports these findings, suggesting that communication networks and social interactions are more important than institutions. The authors explain,
Telling institutional versus socio-technological interpretations apart has been challenging. This paper tests these two hypotheses by measuring convergence in income across Colombian municipalities along two distinct geospatial divisions: one institutional, one socio-technological. The institutional explanation would emphasize the role that belonging to a particular departamento, or state, has on the institutional arrangements and the provision of public goods, thus affecting the incentive structure of agents to operate with better technology.
Although Colombia is a unitary republic, not a federation, states have significant autonomy1 . Studies on Colombia, including those that take an institutional perspective such as Acemoglu et al (2015)…utilize state-level data, as do almost all studies of intra-national unconditional convergence worldwide. Under the institutional assumption, a municipality should tend to converge to the income of the state to which it belongs.
The socio-technological explanation would predict that municipal income convergence should occur within the cluster of municipalities that interact intensely with each other, whether or not they belong to the same state. This is due to the need for intensive social interactions for knowhow to diffuse. To form these socio-technological groupings, we utilize a unique dataset of cellphone calls to group municipalities so that most of the phone calls happen within rather than between these clusters. To facilitate comparison with the 32 states of the institutional state aggregation, we group municipalities into 32 communication clusters…Thus, communication clusters are groups of municipalities that are densely connected through phone calls, meaning that they are significantly more likely to call members of the cluster than they are to call other municipalities(pgs. 4-5).
The authors conclude,
To test these two interpretations in a more direct way, we use municipal level data for Colombia, which we aggregate using two different grouping criteria: the departamento or state to capture institutional variation; and the communication cluster to which a municipality belongs, to capture the intensity of social interaction. We use formal wages per capita as our measure of income per capita, as it can be measured at the municipal level. We use cellphone data to group municipalities into communication clusters of intense interaction.
In this setting, we find evidence of absolute convergence in Colombia at the municipal level. We find evidence that the process is accelerated when the municipality belongs to a richer communication cluster. However, we do not find evidence of a positive influence of belonging to a richer state. We interpret these results as evidence in favor of the idea that obstacles to technology diffusion may be related to the fact that the use of technology requires tacit knowledge which tends to move slowly between brains through a protracted process of imitation and repetition as occurs in learning by doing. Within communications clusters, there seems to be accelerated convergence. Obstacles to convergence in developing countries may be related to the paucity of social interactions between citizens of the same country
…From a policy perspective, the findings emphasize the fact that economic convergence requires intense social interaction, not just the presence of institutions of a certain quality. Regions that are formally part of the same nation-state but do not really interact with the more advanced parts of the country cannot expect to share similar development outcomes.(pg. 19).
Everyyear, economist Mark Perry draws on Census Bureau reports to paint of picture of the demographics of inequality. Looking at 2015 data, he constructed the following table:
Household demographics, including the average number of earners per household and the marital status, age, and education of householders are all very highly correlated with household income. Specifically, high-income households have a greater average number of income-earners than households in lower-income quintiles, and individuals in high income households are far more likely than individuals in low-income households to be well-educated, married, working full-time, and in their prime earning years. In contrast, individuals in lower-income households are far more likely than their counterparts in higher-income households to be less-educated, working part-time, either very young (under 35 years) or very old (over 65 years), and living in single-parent households.
The good news is that the key demographic factors that explain differences in household income are not fixed over our lifetimes and are largely under our control (e.g. staying in school and graduating, getting and staying married, etc.), which means that individuals and households are not destined to remain in a single income quintile forever. Fortunately, studies that track people over time indicate that individuals and households move up and down the income quintiles over their lifetimes, as the key demographic variables highlighted above change, see C[arpe] D[iem] posts here, here and here.
Sunday will soon turn into Monday. The sun will set on the Lord’s Day–the Christian Sabbath–and rise again at the beginning of a new work week. This intimate connection reminds me of Jewish theologian and Civil Rights activist Abraham Heschel’s comments on work’s relation to the Sabbath:
Adam was placed in the Garden of Eden “to dress it and to keep it” (Genesis 2:15). Labor is not only the destiny of man; it is endowed with divine dignity. However, after he ate of the tree of knowledge he was condemned to toil, not only to labor “In toil shall thou eat … all the days of thy life” (Genesis 3:17). Labor is a blessing, toil is the misery of man. The Sabbath as a day of abstaining from work is not a depreciation but an affirmation of labor, a divine exaltation of its dignity. Thou shalt abstain from labor on the seventh day is a sequel to the command: Six days shalt thou labor, and do all thy work [Ex. 20:9]…The duty to work for six days is just as much a part of God’s covenant with man as the duty to abstain from work on the seventh day.[ref]The Sabbath: Its Meaning For Modern Man (New York: Farrar, Straus and Giroux, 2005 [1951]), Kindle edition, 15-16.[/ref]
I thought of this while reading this piece on developing a theology of work in the face of growing protectionism. As the author explains (in this admittedly long excerpt),
[T]he failure of modern conservatism to combat trade protectionism is not just a failure to communicate economics; it’s a failure to promote a holistic philosophy of life and a healthy theology of work, one that’s oriented not toward a self-constructed “American dream,” but toward an authentic pursuit of full-scale freedom, good stewardship and human flourishing…Though it will pain many Americans to hear it…work is not ultimately about you. Yes, work provides sustenance and stability. Yes, it puts bread on the table and a roof over our heads. Yes, these are baseline comforts of a stable society, and yes, self-preservation is a good thing.
But we are no longer isolated hunters and gatherers. We live and work within a far-flung economy, and our hands are united with a large community of people. We are part of civilization, a glorious handiwork of human laborers — creatures made in the image of a creative God — working and collaborating together, and that is a good thing.
As Lester DeKoster reminds us, work is ultimately about “service to others and thus to God.” With this theology at our backs, the economic fruits of free trade are simply fruits: byproducts of humans working and serving together as God created us to do.
“Work restores the broken family of humankind,” DeKoster writes. “Through work that serves others, we also serve God, and he in exchange weaves the work of others into a culture that makes our work easier and more rewarding … As seed multiplies into a harvest under the wings of the Holy Spirit, so work multiplies into a civilization under the intricate hand of the same Spirit.”
…If work is about service to others, no longer should Foreigner X or Migrant Worker Y or Unskilled Laborer Z be viewed as “stealing your job,” though the frustration will surely persist. Instead, we should realize that they, like us, are finally able to participate in the global economy, offering their own forms of service and their own unique gifts and talents in new and efficient ways. They are participating in God’s grand design for work.
Through this lens, the prospect of job loss is no longer an occasion to mope about what was or wasn’t an “American job” in years gone by. The pain and nostalgia will likely endure, but we can remain hopeful and confident in knowing our work is not done. In these cases, job loss is simply a signal of how we might best use our time on behalf of others. It’s an opportunity to adapt and retool, to serve the community in new and better ways, as uncomfortable and inconvenient as it may be. That’s going to require an entire shift in the imagination of America, but it’s one that will revive and replenish far more than surface-level economic growth.


 Adam was placed in the Garden of Eden “to dress it and to keep it” (Genesis 2:15). Labor is not only the destiny of man; it is endowed with divine dignity. However, after he ate of the tree of knowledge he was condemned to toil, not only to labor “In toil shall thou eat … all the days of thy life” (Genesis 3:17). Labor is a blessing, toil is the misery of man. The Sabbath as a day of abstaining from work is not a depreciation but an affirmation of labor, a divine exaltation of its dignity. Thou shalt abstain from labor on the seventh day is a sequel to the command: Six days shalt thou labor, and do all thy work [Ex. 20:9]…The duty to work for six days is just as much a part of God’s covenant with man as the duty to abstain from work on the seventh day.[ref]