New NBER Study on Minimum Wage

On the heels of Nathaniel’s latest minimum wage post, I thought I’d point to a brand new NBER working paper titled “More Recent Evidence on the Effects of Minimum Wages in the United States.” As one summary explains,

For years, [David] Neumark has battled claims by other economists, such as University of Massachusetts professor Arindrajit Dube, that minimum wage hikes have no effect on employment. This latest paper offers more evidence that employment prospects for teenagers are diminished most by the minimum wage. 

Even though teenagers are generally not relying on minimum wage income for living expenses, jobs give teenagers their first opportunity for work experience that is crucial for becoming a productive worker later in life. For disadvantaged teenagers, a minimum wage job can develop skills that provide an opportunity to move out of the lower-class.

While state and local minimum wage increases deprive some of jobs, even more young people would be out of work if the federal government increased the minimum wage nationwide. Income levels and cost of living vary widely between states. The hourly median wage varies from a high of $37.59 in Los Alamos County, New Mexico, to a low of $10.81 in Brownsville-Harlingen, Texas. The federal minimum wage is an attempt to impose an oversimplified, cure-all prescription to the complex and diverse causes of poverty.

…Neumark’s new paper shows once again that flashy sound bites such as “Raise the Wage” make for quick political slogans, but raising the minimum wage will continue to price teens out of jobs.

The minimum wage, like other price controls, has unintended consequences.


New Manhattan Institute Report on Inequality

Inequality expert Scott Winship

Scott Winship at the Manhattan Institute has a new study out on inequality and prosperity. His key findings are:

1. Across the developed world, countries with more inequality tend to have, if anything, higher living standards. The exception is that countries with higher income concentration tend to have poorer low-income populations.

2.  However, when changes in income concentration and living standards are considered across countries—a more rigorous approach to assessing causality—larger increases in inequality correspond with sharper rises in living standards for the middle class and the poor alike.

3.  In developed nations, greater inequality tends to accompany stronger economic growth. This stronger growth may explain how it is that when the top gets a bigger share of the economic pie, the amount of pie received by  the middle class and the poor is nevertheless greater than it otherwise would have been. Greater inequality can increase the size of the pie.

4. Below the top 1 percent of households—and prior to government redistribution—developed nations display levels of inequality squarely in the middle ranks of nations globally. American income inequality below the top 1 percent is of the same magnitude as that of our rich-country peers in continental Europe and the Anglosphere.

5. In the English-speaking world, income concentration at the top is higher than in most of continental Europe; in the U.S., income concentration is higher than in the rest of the Anglosphere.

6. Yet—with the exception of small countries that are oil-rich, international financial centers, or vacation destinations for the affluent—America’s middle class enjoys living standards as high as, or higher than, any other nation.

7.  America’s poor have higher living standards than their counterparts across much of Europe and the Anglosphere, while faring worse than poor residents of Scandinavia, Germany, Austria, Switzerland, the Low Countries, and Canada.


Check it out.

Economic Freedom of the World Report 2014

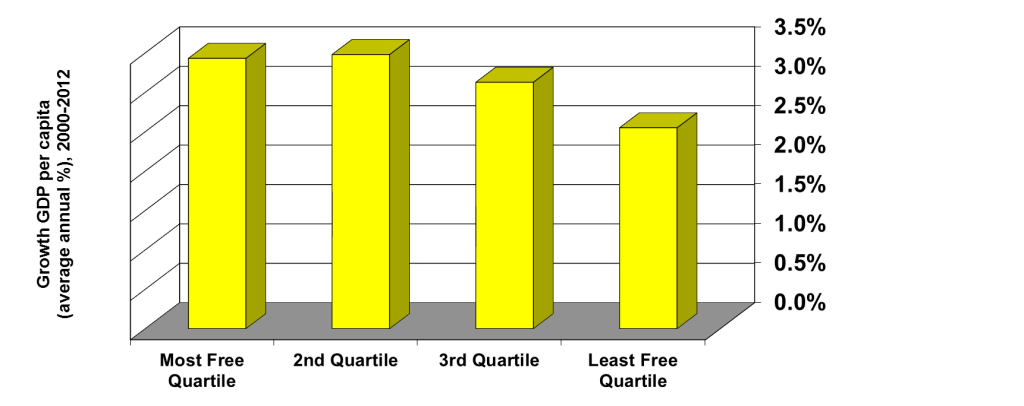
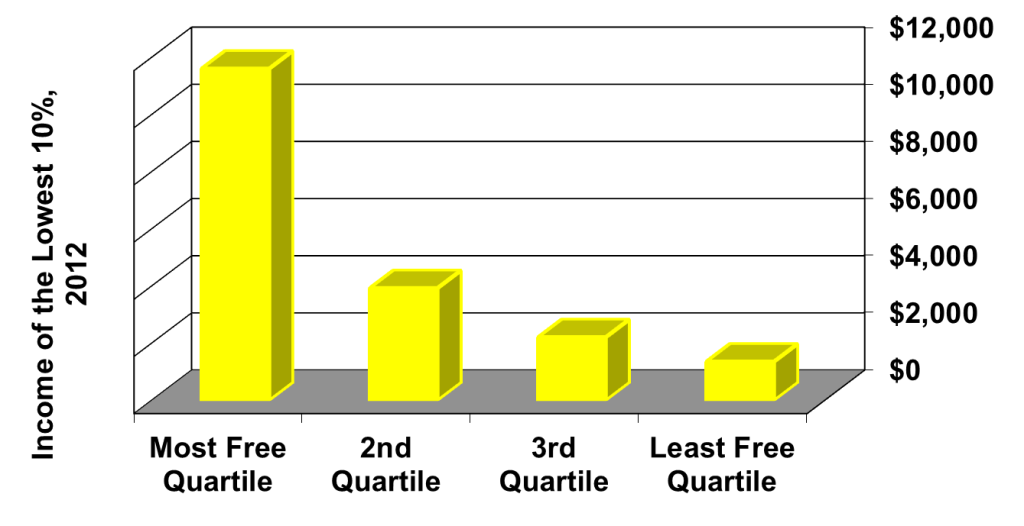
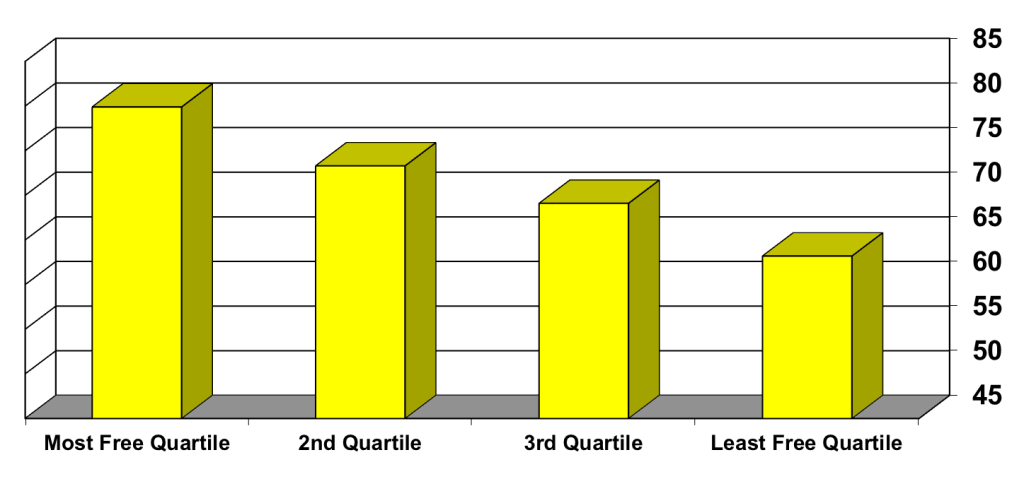
The Economic Freedom of the World: 2014 Annual Report has been published by the Fraser Institute. I blogged about the 2013 report last September and Nathaniel and I made use of its data in our SquareTwo article earlier this year. The following can be considered an update of what I deem to be some of the most important graphs in the whole report (descriptions are at the bottom of the graphs):


Economic Growth


 Per Capita Income

Income of Poorest 10%

Life Expectancy at Birth


TED: Economist on the Global Impact of Remittances

Economist Dilip Ratha gave a fascinating TED talk this month on the global impact of money sent by migrants to their native countries. It is hard to imagine how this subject gets overlooked when Ratha points out that the amount of money sent home by migrants in 2013 was three times that of development aid. Or that remittances make up 42% of Tajikistan’s GDP. Or that monthly remittances to Somalia exceed the average per capita income of $250 per year. What especially struck me was the following line by Ratha in his discussion of Somalia:

Remittances are the lifeblood of Somalia. And yet, this is an example of the right hand giving a lot of aid, while the left hand is cutting the lifeblood to that economy, through regulations.”

Sometimes the most conventional method of helping the poor isn’t the most effective.

Saving Beer

Over at The New Republic, there was a small post praising former President Jimmy Carter for saving the beer industry via deregulation:

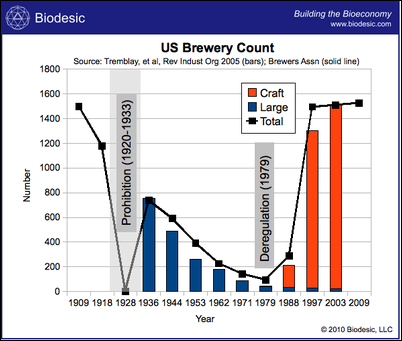
To make a long story short, prohibition led to the dismantling of many small breweries around the nation. When prohibition was lifted, government tightly regulated the market, and small scale producers were essentially shut out of the beer market altogether. Regulations imposed at the time greatly benefited the large beer makers. In 1979, Carter deregulated the beer industry, opening  back up to craft brewers. As the chart below illustrates, this had a really amazing effect on the beer industry:

US_Brewery_Count_Biodesic-thumb-400x339


The increase in breweries over the past few decades is staggering. The industry has reached a milestone with over 2,700 breweries in the U.S. at the end of 2013 with 98% of these being small and independent craft breweries. This is the highest count in close to 140 years. As economist Mark Perry has noted, there has been a 2600% increase in US breweries largely because of craft breweries. Bart Watson, chief economist for the Brewers Association, also finds that “the presence of a strong craft industry has been great for the beer industry.” Between 2009 and 2013, the states with the strongest craft beer industries on average gained volume, while the majority of states lost volume. These craft breweries have also become widely dispersed within the US. While there is still plenty of room for growth, the dispersion is pretty extensive. “Long gone are the days where San Diego and Portland are hogging all the local breweries,” writes Watson. “There are 2,295 [Zip Code Tabulation Areas] that now have a brewery. They range in size from over 100,000 people to 10 (10 ZCTAs with fewer than 100 people have a brewery). Americans, whether they live in urban or rural areas, large towns or small, are increasingly being exposed to beer produced by a local brewer.” Furthermore, this increased competition has led to numerous choices for consumers. As Watson puts it,

Regardless of the optimal number of brands on a shelf, the innovation and entry of so many great new breweries can only be a good thing for the category. Competition breeds innovation, and innovation has bred the incredible diversity of amazing beers available in the US today. The beers that people love will thrive and continue to find shelves and taps and the ones that don’t stand out will fade away. Make a list of your favorite craft beer brands. How many are 10 years old? 5? 1? I know that I’m continuously amazed by the new offerings from America’s 3,000+ breweries, and if it means I have to spend a few extra minutes in the beer aisle sorting out my next selection, it’s worth the wait.

There are a few conclusions I draw from this overview of the beer industry:

1. Regulations often hamper innovation and growth (a major loss for everyone, especially consumers).

2. Perspective is important: information on historical trends is better than snapshot data.

3. There is a difference between pro-business and pro-market.

4. Sometimes I wish Mormons could (still) drink beer.

$2 A Day in the United States

The Brookings Institution has a brand new study on those living on $2 a day in the U.S. One of the most interesting findings is how the estimates depend on the data source. These estimates range from 4% (12 million) to zero:

different estimates of poverty rate 2


In response to questions about their study, the authors explain the range of estimates:

First, a significant portion of $2 poverty appears to be temporary, as evidenced by the lower poverty rates recorded when we extend the duration over which individuals’ welfare is assessed. Such spells may be accounted for by life events such as moving between jobs that are not necessarily indications of diminished welfare. Second, social protection programs play a critical role in the welfare of many of America’s poorest households. Programs such as food stamps (SNAP) and the Earned Income Tax Credit mean the difference between living above the $2 threshold or below it for millions of people according to some estimates. Third, a significant share of consumption for the $2 poor likely occurs out of resources that don’t count as income: savings and assets, borrowing, and in-kind government assistance. Poverty estimates based on income (money earned) and consumption (money spent) differ widely. This discrepancy is in keeping with the higher variability of income from month to month

Furthermore, the authors explain, “If we used the exact same criteria to measure poverty in the U.S. as is used by the World Bank to obtain official poverty estimates for the developing world, we would conclude that no-one in the U.S. falls under the $2 threshold. Part of the reason for this is that even the poorest people surveyed in America appear to find a way to meet their most basic material needs (valued above $2 a day) even if their reported income is zero or close to zero. Furthermore, the poor in America have access to public goods—public education, criminal justice and infrastructure—that would be the envy of the poor in the developing world.”

Finally, the authors point out that “the methodology by which the World Bank compiles official global poverty estimates has recently changed. Whereas in the past the estimate was in practice just a measure of poverty in the developing world, the new method incorporates the populations of rich countries. For now, the entire population of these countries is assumed to not be poor.” 

Understanding data sources is important. Consumption is likely a more accurate way to assess the poor’s material well-being, as I think is demonstrated in the range of estimates above. On top of this, one must take into consideration the intangible assets of one’s country. These assets, according to the World Bank, refer to the nation’s human and social capital (i.e. worker skills and trust) and the quality of its formal and informal institutions (e.g. efficient judicial system, property rights). These make up most of a nation’s total wealth. In 2005 (the latest data from the World Bank), the U.S. had $734,195 total wealth per capita, with $627,246 (over 85%) of that wealth being intangible.

One of those studies that should both remind those in developed countries how lucky they are and how much work there is still left to do.

DailyKos: Eliminate Corporate Taxation

2014-08-27 General Electric

Today will forever be remembered as the day I almost agreed with a DailyKos article. Almost. It will also be remembered as the day kos became a right-wing fiscal conservative, almost.

We start off with something everyone should be able to agree on: Eliminate corporate tax, seriously. Kos cites Robert Reich for a universal, non-partisan reason to ditch corporate taxation:

But in many cases, depending on the structure of the market, a significant share of the actual burden of paying the corporate income tax is often borne instead by employees in the form of lower wages, or consumers in the form of higher prices.

This is true. No matter how good “corporate taxation” sounds, the reality is that all tax burdens are ultimately born by people. The most obvious problem with corporate taxation is that we don’t know who those people are. We do know that some of them are the employees and customers of big corporations, however. For this reason alone, corporate taxation is unconscionable.

Kos then goes on to make another good observation, but unfortunately this one has ideological implications that run directly counter to his belief. US corporate taxcauses multinational companies to stock more than $2.1 trilllion in off-shore accounts. If there were no corporate tax, they would bring most of that $2.1 tillion home. Kos calls this “one hell of a stimulus package for the country.” He’s right, but he’s sounding right-wing, and this triggers an intellectual gag reflex in the next paragraph:

However, this isn’t about free money for the corporatists. Fact is, the big companies are good at avoiding taxes by playing offshore finance games, while small businesses end up paying higher tax rates. Aside from the matter of fairness, it’s poor economics, as those small businesses—the driver of most job creation in our economy—could use that tax money to invest in new employees and equipment.

He’s right that small business drives most job creation, but small businesses are usually not C-corps and so they don’t pay corporate taxation. They are pass through organizations, so f you want to lower their tax rate you have to lower the personal income tax rate. The segue from corporate taxation to small business makes no sense. Worse than making no sense, however, Kos is digging the hole deeper. Whether he admits it or not, kos is now arguing to eliminate corporate income tax (to get that $2.1 trillion stimulus) and to lower personal income tax (to reduce the tax burden on the small companies that provide most new jobs in this country). This triggers a second intellectual gag reflex:

But of course, this isn’t an effort to starve government, it’s to move the tax burden on those who can actually afford it—tax capital gains at the same levels (if not higher!) than regular income.

Lest he sound like an anti-tax right-winger, kos has to get around to sticking to the man some how. So he proposes that we make it all up in capital gains. This plan has two enormous defects. First of all, taxing capital gains lowers economic growth, which counteracts the stimulus and job-creation effects of the previous arguments he just made. Secondly, the numbers he borrows for his tax plan make no sense:

For example, a tax of $1 on every $400 of stocks traded (0.25%; one-quarter of one percent) and $1 on every $800 of currency and debt trading including derivatives (0.125%, one-eighth of one percent). This fee (tax) would have raised between $750 billion and $1.2 trillion during each of the past five years (2005 – 2009).

He’s saying: “Let’s pretend we taxed stock trades for 5 years and nobody reacted to the taxation.” Not very realistic, is it? The reality is that if you skim 0.25% of every trade off the top, there are going to be a lot less trades. And so we’re gong to raise dramatically less revenue then he suspects and we’re going to undermine the economy-expanding effects of the first two tax-cuts. All because of ideology.

The really sad thing, of course, is that it takes me (a conservative) to point that he if kos really wants to “move the tax burdn on those who can actually afford it” then he should try a consumption tax. Then we’d actually be able to offset some of the losses from the other forms of taxation and actually hit rich consumers. Oh well.


Texas and Job Creation

The above comes from a post by economist Mark Perry in which he explains that the chart shows “the percent changes in total civil employment between December 2007 (when the recession started) and July 2014 for: a) Texas (blue line) and b) the US minus Texas. The chart tells a powerful and important story about the strength of the Texas economy, which has experienced an employment increase of more than 1.3 million workers since late 2007. In contrast, civilian employment in the other 49 states is still almost 1.3 million jobs below the December 2007 level!”

He provides another chart below: “The difference between the two charts is that the one below uses monthly nonfarm payroll employment data and I’m using total civilian employment based on the “household survey” that determines the jobless rate. Total civilian employment is a more comprehensive measure of all US workers that includes agricultural workers, the self-employed, and workers in private households. Using the more comprehensive household survey of jobs shows an even wider divide between the number of jobs added to the Texas economy (+1.3 million) and the net loss of jobs in the other 49 states since December 2007 of -1.23 million!”


From all of us down here in Texas: you’re welcome America.

Sweatshops and Prosperity

Texas Tech economist Benjamin Powell has done extensive research on sweatshops, including a recent book on the subject published by Cambridge University. He has a new article in the Summer 2014 issue of The Independent Review titled “Meet the Old Sweatshops: Same as the New Sweatshops.” The article traces the history of sweatshops in 19th-century Great Britain and U.S. as well as post-WWII East Asia. It documents the incredible increase in living standards, to which sweatshop wages contributed. Perhaps more important, it looks at the impact labor laws had on sweatshop conditions and their eventual elimination:


The short answer is that the laws played very little role in ending sweatshop conditions. For the most part, the laws were adopted once the United States had already reached a level of development that had mostly eliminated the conditions the laws made illegal. Great Britain’s first restrictions on child labor applied only to children under nine years old, and Massachusetts’ child labor law, the first in the United States, limited the workday to ten hours only for children under twelve. The United States didn’t pass meaningful national legislation against child labor until 1938, when its per capita annual income was more than $10,200 (in 2010 dollars)…Similarly, the first federal U.S. minimum wage wasn’t introduced until 1938, and it set the minimum at 25 cents per hour when average productivity was already 62.7 cents (Cowen and Tabarrok 2009, chap. 7). The first state minimum-wage law wasn’t passed until 1912 in Massachusetts, and it applied only to women and children. Other national labor legislation didn’t come until the United States was even more developed…The same pattern is true of workplace safety regulation. Fishback finds that “[m]ost [safety] regulations appear to have codified existing practices in the relevant industry” (2007, 310–11)
(pg. 17).

Despite the loud protests, research demonstrates that Third World sweatshops provide an above average standard of living for their workers compared to others within their economies. Also, as economist Alex Tabarrok has noted, “the soft-hearted demand for international labor standards often masks labor union protectionism.” This isn’t to say that we should be content with all examples of sweatshop conditions. But, as Powell concludes, “Poorer countries today would be better served if antisweatshop scholars and activists had a better understanding of how the historical process played out in wealthy countries” (pg. 120).

Check it out in full.

“The Cooperative Advantage” of International Trade

Charles Kenney of the Center for Global Development has an excellent article in the Summer 2014 issue of the Breakthrough Journal (published by the Breakthrough Institute) on how international trade and innovation actually benefit everyone involved. He begins with a little history on the 19th-century Guano Islands Act, by which Americans were authorized to seize unoccupied islands filled with dry bat or bird poop. This was

at a time when guano was the world’s best fertilizer and source of saltpeter, a vital ingredient of gunpowder. Around 100 islands were claimed by the United States under the law, including Midway. And it wasn’t just the United States that scrambled for control of guano deposits: Peru, Spain, Bolivia, and Chile fought wars over them. That might have seemed reasonable at the time: everyone was desperate for the same source of nitrogen fertilizer. But in 1909, Fritz Haber developed a method of producing ammonia from nitrogen in the air, enabling chemists to manufacture fertilizer on an industrial scale. This new technology, the Haber process, provided the world with a less smelly and more widely replicable way to meet our nitrogen needs, slashing the strategic value of poop-covered real estateNonetheless, the Guano Islands Act remains on the books, representing a way of thinking about international relations that is as anachronistic as it is enduring: the idea that countries must compete for a set amount of resources, land, or wealth.

This fear-based approach to international relations fuels much of the isolationism and protectionism we see today. But Kenney argues that “the increasing success of emerging markets, in part the result of their adopting ideas and institutions pioneered by industrial economies, is binding the world’s countries together into ever closer relationships of mutual benefit.”

After reviewing the evidence, he concludes,

All of this suggests that we need to develop a new view of the international economy as a positive-sum game (to borrow from Financial Times columnist Martin Wolf), one that acknowledges that advances in wealth, technology, or wellbeing in one part of the world are likely to enhance rather than hurt prospects for progress elsewhere. Seeing the planet today through the decayed eyes of Malthus and Machiavelli — and framing engagement with developing countries as zero-sum — simply does not make sense in a non-rival, globally integrated world.

In our positive-sum world, cosmopolitanism and compassion increasingly align with self-interest. This is a far nicer situation than one in which the two conflict, and it is surely a leading reason to hope that the world will keep on becoming a better place to live. It’s time to shift our thinking about Asia, Africa, and Latin America, emphasizing cooperation and mutual gain rather than competition and fear. Thinking of the developing world’s growth in the 21st century as primarily a threat makes about as much sense as trying to run a modern empire on bird poop.

Check it out.