President Donald Trump is expected to sign an executive order as early as Monday stating his intention to renegotiate the free trade agreement between the United States, Canada and Mexico, a White House official told NBC News.
Economist Brad Delong commented recently, “The economic case against the two agreements that passed [NAFTA and China into WTO], and the one that did not [TPP], doesn’t hold water. It’s clear, however, that candidates can make an effective political case against trade agreements — and that scares me.” For those of you who may have missed the last year of posts, here’s a few highlights that demonstrate why anti-trade, anti-globalization populism is empirically wrong:
Trump’s proposed policies would likely lead to a trade war.
And what should appear this past week? A new study arguing that the interaction of openness to imports and deregulation can boost economic growth:
Enthusiasm for reducing domestic regulation, or ‘red tape’, has been gaining momentum in some OECD countries, and there are many reasons to think that reducing such red tape – including at local levels – could be beneficial for productivity growth by encouraging firm entry, competition, and efficiency gains. Evidence from an analysis of firms and industries in panels across OECD countries suggests that this is indeed the case (OECD 2017). Easing the strictness of regulation in network industries (e.g. energy, telecommunications, and transport) especially, as well as in retail and professional services, would improve productivity and competitiveness in downstream sectors, not least manufacturing, which use services from these upstream industries as inputs for their own production.
…In a recent paper that examines the productivity growth of firms in a dozen or so OECD countries, we find that the benefits of domestic deregulation depend both on sectoral openness to imports and firms’ technological advancement (Ben Yahmed and Dougherty 2017). The results show that firms in sectors with higher import penetration have higher productivity growth, if these firms are close to their sectoral technology frontier. The most productive firms appear to enjoy a significant increase in productivity when foreign competitors’ pressure is high; in contrast, import penetration does not incentivise firms far away from the technological frontier, or if so only weakly.
In addition, the pro-competitive effect of international trade depends on domestic regulatory stringency. Our results indicate that, among the most productive firms, the positive effect of foreign competition is inhibited for firms operating in a country with stringent regulation such as higher barriers to entry. Domestic and foreign competitive pressures are found to be complementary: firms’ incentives or abilities to improve their productivity to cope with foreign competition are stronger in countries with less stringent regulation.
Trade and deregulation
Apparently, our political leaders need to take a long hard look at all of this.
Here’s a bit of optimism after the train wreck that was 2016:
By conventional wisdom, 2016 has been a horrible year. Only someone living in a cave could have missed the flood of disheartening headlines. However, if 2016 continues the global trends of previous years, it may turn out to have been one of the best years for humanity as a whole.
Those of us who live in the world of poverty research and rigorous measurement have watched many global indicators improve consistently for the past few decades. Between 1990 and 2013 (the last year for which there is good data), the number of people living in extreme poverty dropped by more than half, from 1.85 billion to 770 million. As the University of Oxford’s Max Roser recently put it, the top headline every day for the past two decades should have been: “Number of people in extreme poverty fell by 130,000 since yesterday.” At the same time, child mortality has dropped by nearly half, while literacy, vaccinations and the number of people living in democracy have all increased.[ref]Similar to last year.[/ref]
The authors point to four things that can make 2017 even better for the poor and destitute:
“First, give the poor cash. Studies in Kenya and elsewhere show that the simplest way to help is also quite effective. We also know that if we give cash, the poor won’t smoke or drink it away. In fact, a recent look at 19 studies across three continents shows that when the poor are given money, they are less likely to spend it on “temptation goods” such as alcohol and tobacco. More and more research shows that when the poor come into a windfall, they spend it on productive things — sending their children to school, fixing the roof that’s letting in the harsh weather or investing in a business.”[ref]This is perhaps more evidence in favor of a basic income.[/ref]
“Second, innovative health-care delivery can dramatically improve outcomes…The nongovernmental organizations Living Goods and BRAC Uganda have been training women in Uganda to make a living by going door-to-door selling over-the-counter medications and health products. They function as franchisees in an “Avon lady”-style business. But these small-business owners also perform basic health checks for children to look for symptoms that warrant getting the child to a clinic. One randomized evaluation released this year concluded that taking this health care to people’s homes reduced child mortality (for those younger than 5) by an astounding 27 percent and infant mortality (less than a year old) by 33 percent.”
“Third, access to mobile money may lift people out of poverty in large numbers…In Kenya, the M-Pesa mobile money system, introduced in 2007, allows anybody with a mobile phone to transfer money through a text message. Research from this year shows that as M-Pesa became more available in a local area, households became less poor — particularly households run by women. The study estimates that 185,000 women changed professions from subsistence agriculture to business and retail and that 194,000 households were lifted out of extreme poverty.”
“Finally, mobile phone technologies are leapfrogging the reach of traditional telecom infrastructure, and text message reminders are proving to be effective at helping people follow through on things they want to do. One study found that they helped the poor save money. Another in Ghana aimed at combating drug resistance found that such reminders helped people to finish all of their antimalarial drugs. Researchers in Ghana also found that text message quizzes improved girls’ understanding of reproductive health, resulting in fewer reported pregnancies. In Kenya, another interactive text message system offering support for teachers helped reduce student dropouts by 50 percent.”[ref]The importance of mobile phone technologies is underappreciated.[/ref]
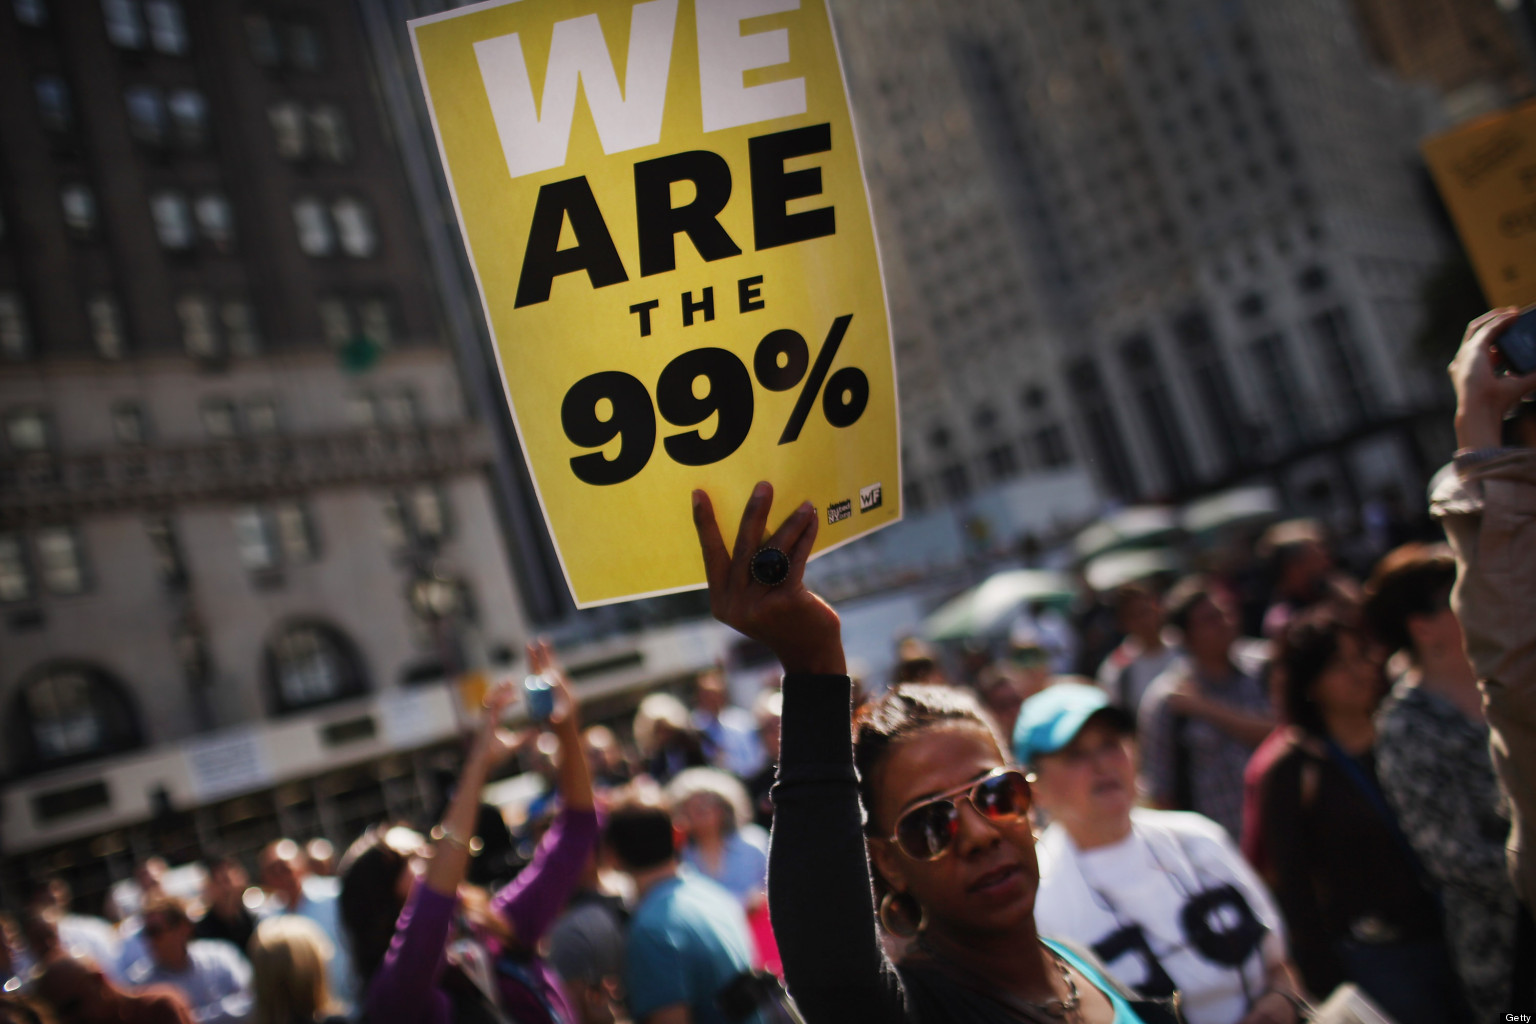
Technically, perhaps, but it’s difficult to feel bad for the top 10-15 percent.
“If you had only $2,220 to your name,” reports The Economist, “(adding together your bank deposits, financial investments and property holdings, and subtracting your debts) you might not think yourself terribly fortunate. But you would be wealthier than half the world’s population, according to this year’s Global Wealth Report by the Crédit Suisse Research Institute. If you had $71,560 or more, you would be in the top tenth. If you were lucky enough to own over $744,400 you could count yourself a member of the global 1% that voters everywhere are rebelling against.”
It turns out that 89% of the world’s assets are owned by the wealthiest top 10 percent:
That lucky tenth now includes over 44m Chinese, about 4.4% of the country’s adult population. A far greater number (almost half of China’s adults) cluster in the next three deciles down. Closer to the bottom of the pyramid, there is a similar bulge of Indians in the second and third deciles (with wealth between $30 and $603). Below them, the bottom tenth is a peculiar mix. It is populated by poor countries, where many people have nothing, and rich ones, where people can own very much less than that. It includes a surprising number of Americans (over 21m), whose debts outweigh their assets. But most Americans are much better off. Over 40% belong to the top tenth of the global wealth distribution (and over 18m belong to the global 1%). Some of those railing against the global elite probably do not know they belong to it.
The following map provided by the Tax Foundation (based on data from the Bureau of Economic Analysis) “shows the real value of $100 in each state. Prices for the same goods are often much cheaper in states like Missouri or Ohio than they are in states like New York or California. As a result, the same amount of cash can buy you comparatively more in a low-price state than in a high-price state…Using [BEA] data, we have adjusted the value of $100 to show how much it buys you in each state.”
The states where $100 is worth the most are Mississippi ($115.34), Arkansas ($114.29), Alabama ($113.90), South Dakota ($113.64), and West Virginia ($112.49). In contrast, $100 is effectively worth the least in the District of Columbia ($84.67), Hawaii ($85.62), New York ($86.43), New Jersey ($87.34), and California ($88.97)…Regional price differences are strikingly large; real purchasing power is 36 percent greater in Mississippi than it is in the District of Columbia. In other words, by this measure, if you have $50,000 in after-tax income in Mississippi, you would have to have after-tax earnings of $68,000 in the District of Columbia just to afford the same overall standard of living.
Case in point, when adjusted for purchasing power, Nebraskan real income exceeds that of Californians:
Cole concludes,
Many policies – like minimum wage, public benefits, and tax brackets – are denominated in dollars. But with different price levels in each state, the amounts aren’t equivalent in purchasing power. This has some unexpected consequences; people in high price-level states like New Jersey will often pay more in federal taxes without feeling particularly rich.
The New York Times has a recent article discussing new research on the minimum wage presented at the annual meeting of the American Economic Association:
John Horton of New York University conducted an experiment on an online platform where employers post discrete jobs — including customer service support, data entry, and graphic design — and workers submit a proposed hourly wage for completing them.
…At first glance, the findings were consistent with the growing body of work on the minimum wage: While the workers saw their wages rise, there was little decline in hiring. But other results suggested that the minimum wage was having large effects. Most important, the hours a given worker spent on a given job fell substantially for jobs that typically pay a low wage — say, answering customer emails.
Mr. Horton concluded that when forced to pay more in wages, many employers were hiring more productive workers, so that the overall amount they spent on each job changed far less than the minimum-wage increase would have suggested…When the minimum wage increased, employers tended to hire workers who had earned higher wages in the past, suggesting that they were looking for a more productive work force.
If the pattern Mr. Horton identified were to apply across the economy, it would raise questions about whether increasing the minimum wage is as helpful to those near the bottom of the income spectrum as some proponents assume. The higher minimum wage could cost low-skilled workers their jobs, as employers rush to replace them with somewhat more skilled workers.
Another study found that when the minimum wage increases, employers may be put out of business. After identifying the ratings of thousands of restaurants in the San Francisco area, the researchers
found that many poorly rated restaurants tend to go out of business after a minimum-wage increase takes effect. By contrast, highly rated restaurants appear to be largely unaffected by minimum-wage increases, and over all, there is no substantial rise in restaurant closings after a minimum-wage increase.
The results are broadly consistent with a 2013 study…showing that a sizable minimum-wage increase in New Jersey resulted in many lost jobs as numerous businesses closed, but an almost offsetting number of new jobs as other businesses opened, which the authors argue were more productive.
Just add this to the growing evidence of adverse effects of the minimum wage.
How much is entrepreneurship predetermined by family background? According to a new study,
Parent Role-Modelling
recent papers have collectively suggested that entrepreneurship might be more predetermined than previously thought – entrepreneurship education has been proven to be effective in primary school (Huber et al 2014) and, to a lesser extent, in secondary school (Elert et al 2015), but not at all when individuals are older, that is, students (Oosterbeek et al 2010) or adults (Fairlie et al 2015). Moreover, strong intergenerational associations in entrepreneurship have attracted considerable attention. While part of this relationship has been shown to be genetic (Nicolaou et al 2008), parental role-modelling appears to be the main driver of the intergenerational association in entrepreneurship (Lindquist et al. 2015). Additionally, exposure to a dense entrepreneurial environment during formative years also increases the likelihood of entry into entrepreneurship (Guiso et al. 2015).
So the policy-relevant questions arise: To what extent is entrepreneurship predetermined? Have we spent (public) funds wisely by implementing policy measures and education aimed at changing the behaviour of adult people?
In a recent paper, we assess the predetermination of entrepreneurship outcomes by calculating and analysing sibling correlations (Lindquist et al 2016). We argue that sibling correlations are more complete and precise measures of predetermination, including the importance of genes, family background, and neighbourhood effects as determinants of entrepreneurship. Sibling correlations have been used before to study outcomes other than entrepreneurship and provide much broader measures of the importance of family background and neighbourhood effects than intergenerational associations (Solon 1999). Their interpretation is also straightforward – the higher the sibling correlation, the larger the importance of family background.
Their results?:
25% of the variance in individuals’ decisions to become self-employed is explained by family background and community influences;
For incorporation, this is close to 35%;
These percentages are slightly higher when we consider measures of successful entrepreneurship such as above median years of self-employment and incorporation;
Brother correlations are always larger than sister correlations;
The largest correlation is for males with above median years of incorporation, which is close to 50%;
Mixed sibling correlations are consistently smaller than same-sex correlations.
Parental entrepreneurship status is quite important;
Parental education and income matter much less; and,
Family structure and immigrant status do not matter.
Parental self-employment is a prime explanatory force in individual self-employment, but not incorporation; and
Parental incorporation explains individual incorporation best, but not self-employment.
Between 56–78% of the sibling correlations in self-employment; and
Between 38–46% of the sibling correlations in incorporation.
The researchers conclude “that parental entrepreneurship and genes are the two most important factors generating sibling similarities in entrepreneurship.” Policy wise, the authors explain that “children appear to be able to learn about entrepreneurship through their family and community environment, which implies that it may be possible to teach entrepreneurship to young people.”
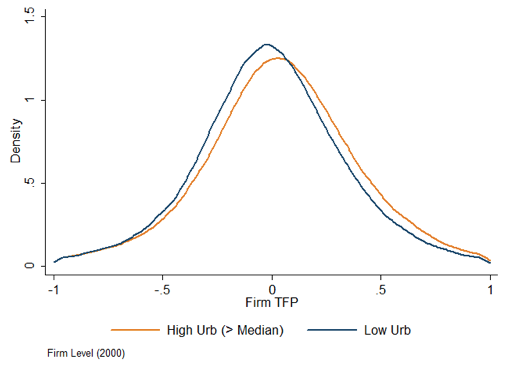
A new study finds evidence that denser populations are more productive:
Is it selection, or the sorting of talents (Behrens et al. 2014) that leads only the most productive firms to locate in denser areas? Or do agglomeration economies explain why firms located in less dense environments are less productive? Empirical evidence suggests that the main driver of differences in productivity is not selection (i.e. tougher competition inducing less productive firms to exit the market) but agglomeration economies (Combes et al. 2012). The usual suspects are the higher availability of services, better infrastructure, sharing of public goods, a denser labour market allowing for better matching, and technology spillovers (Duranton and Puga 2004). Using firm-level data for France, we confirm in a recent study that misallocation has a spatial dimension: resource allocation and the associated effect on productivity are related not only to firms’ characteristics, but also to the environment in which they operate (Fontagné and Santoni 2016). Denser commuting zones seem to offer a better match between employers and employees.
It’s a bit technical, but interesting nonetheless. Check it out.
In their book Nudge, authors Richard Thaler and Cass Sunstein advocate what they call “libertarian paternalism”: a kind of governmental choice architecture that seeks to influence the choices choosers make. This restructuring tends to rely on small tweaks to the system, recognizing that people are often biased and irrational in their decision-making.
What if the choice architects are subject to psychological bias? This could come from biases of regulators, politicians, or even economists. It can also come from the psychological biases of the voters who hire and fire political agents.
Teoh and I argue that important features of financial and accounting rules and regulation are shaped by psychological bias on the part of the architects, rather than as a useful remedy for the biases of the decision makers being acted upon. Typically the resulting regulation is far from libertarian, as well.
We call the approach to understanding regulation as coming from smart and benevolent architects `Good Rules for Bad Users.’ (Libertarian paternalism is slightly different: `Good Suggestions for Bad Users.’) We feel the other side of the coin has been neglected, that the architects themselves may be biased, resulting simply in `Bad Rules.’ (This is not to say that all regulation is bad, but it does say that bad rules will sometimes be approved.) We call this perspective the psychological attraction approach to financial and accounting regulation.
Specifically, we argue that some forms of regulatory ideas are good at ensnaring the attention, emotions, and cognitive biases of regulators and the public. Such regulations do not necessarily help others, on the whole, and indeed may have highly perverse effects. But people are attracted to certain rules because they are superficially appealing. This point applies even to accounting rules, which have evolved over centuries through the interactions of different users. Rules concerning what firms have to expense, what they can capitalize, whether they are required to be conservative in reporting their performance—all, we argue, have been influenced by heuristic intuitions, not just economic efficiency.
The biases of regulators have been addressed before by other researchers. It’s a glaring oversight among “nudge” advocates that needs to be continually studied.
He recently sat down with economist Tyler Cowen for a segment of Conversations with Tyler at GMU’s Mercatus Center. The interview is fascinating as they discuss Henrich’s work on cultural evolution and its implications for both today and the future. What perhaps excited me the most was Henrich’s discussion of his work-in-progress on marriage norms and the development of Western individualism:
In my latest project I’m really looking at the kind of spread of the Western church into Europe and how it transformed the social structure in ways that I think led to individualism, it led to a different kind of cultural psychology that would eventually pave the way for secular institutions and economic growth. The church is the first mover in that account…When the church first began to spread its marriage-and-family program where it would dissolve all these complex kinship groups, it altered marriage. So it ended polygyny, it ended cousin marriage, which…forced people to marry further away, which would build contacts between larger groups. That actually starts in 600 in Kent, Anglo-Saxon Kent. Missionaries then spread out into Holland and northern France and places like that. At least in terms of timing, the marriage-and-family program gets its start in southern England.
This project is in its early stages (according to the email Henrich sent me), but it’s something I’m greatly anticipating. The entire interview is worth watching/listening to. Cowen provides both insightful feedback and even pushback, making the discussion a productive one. Check it out.
Last summer, two consultants at the Minneapolis Fed published a paper entitled “On the Ethics of Redistribution.” They begin by framing the discussion with a global perspective:
A typical American in the lowest 5 percent of income (for America) has a higher income than 95 percent of Indians, 80 percent of Chinese and 50 percent of Brazilians. In the United States, 99 percent of households have indoor plumbing (a toilet with a sewer connection). In India, it’s 12 percent. For Americans below the poverty line, nearly three-quarters have a car (and 31 percent have two or more) and 97 percent have air conditioning. In India, only 5 percent of all households have cars and 2 percent of all households have air conditioning.
This then begs the following question: Are policies that purport to help the comparatively well-off (those at, say, the poverty line in developed countries) at the expense of the superlatively well-off (the rich in developed countries) desirable from the behind-the-veil perspective assuming that that perspective is global?
Increasing world trade is an example of the tension between policies that help those in developing countries versus those that help those lower in the income distribution in developed countries. According to a World Bank Study, in the three decades between 1981 and 2010, the rate of extreme poverty in the developing world (subsisting on less than $1.25 per day) has gone down from more than one out of every two citizens to roughly one out of every five, all while the population of the developing world increased by 59 percent. This reduction in extreme poverty represents the single greatest decrease in material human deprivation in history.
But this decrease in extreme poverty in the developing world has coincided with a marked increase in income inequality in the developed world, and the latter has received much more attention, at least from policy analysts in these richer nations.
The authors then move to the subject of skilled/unskilled labor and the effects of redistribution:
In a world with just two countries, one developed and the other poor, output is produced in each by a combination of skilled workers and unskilled workers. When they’re young, unskilled workers have the opportunity to become skilled by working with older, skilled workers.
…A rich-country policy to tax high incomes will redistribute income (within that country) from those with high innate abilities (and, by assumption, with the ability to become highly skilled) to those with lower innate abilities. In so doing, that policy will reduce inequality within the rich country, but it will also create disincentives there to becoming highly skilled and thereby reduce the global supply of skilled workers. This reduced supply of skilled workers from the developed country then reduces opportunities for young workers in the poor country to become skilled.
Applying the Harsanyi-Rawls behind-the-veil-of-ignorance criterion but considering only people in the developed country would appear to make this a beneficial policy because it helps the poor of that rich country. But, in our example, it hurts the poorest of the poor in the world, those in the developing nation. A proper application of the behind-the-veil-of-ignorance criterion—one that takes all people in all countries into consideration—can thus lead to the implication that such a policy is extremely undesirable. At the very least, a proper application of the criterion says that redistribution within rich countries imposes costs on people in other countries which need to be taken into account.
They conclude, “A giant literature in public finance justifies such social welfare functions by appealing to the veil-of-ignorance. Our point simply is that those who use this criterion should weight the welfare of poor people in Chad, the world’s poorest nation, very heavily. To our knowledge, very little if any of the relevant research does so.”


 Technically, perhaps, but it’s difficult to feel bad for the top 10-15 percent.
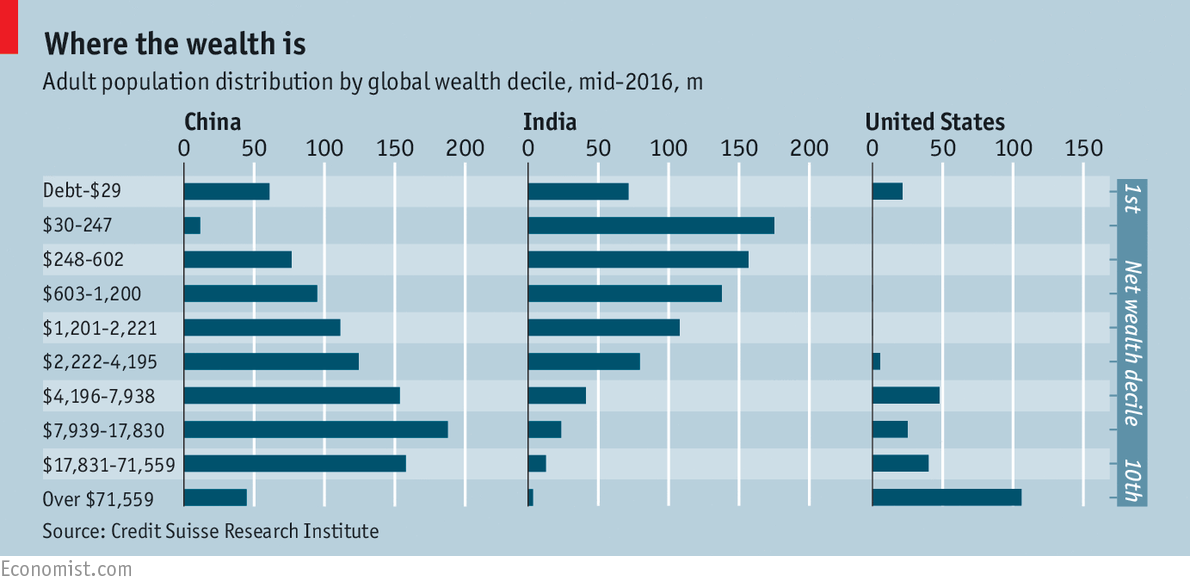


 John Horton of New York University


 In a world with just two countries, one developed and the other poor, output is produced in each by a combination of skilled workers and unskilled workers. When they’re young, unskilled workers have the opportunity to become skilled by working with older, skilled workers.