The Long-Term Effects of Disruptive Peers

Class disruptions are known to worsen educational achievement in the short run, but new research demonstrates that being exposed to disruptive peers can even lead to worse adult outcomes:

Results indicate that there are persistent effects on both test scores and educational attainment. We estimate that exposure to one disruptive peer in a class of 25 throughout elementary school is associated with a 0.02 standard deviation reduction in test scores during high school, and nearly a one percentage point reduction in the likelihood of receiving a college degree. This suggests that the impact of disruptive peers does persist with respect to educational outcomes years afterward.

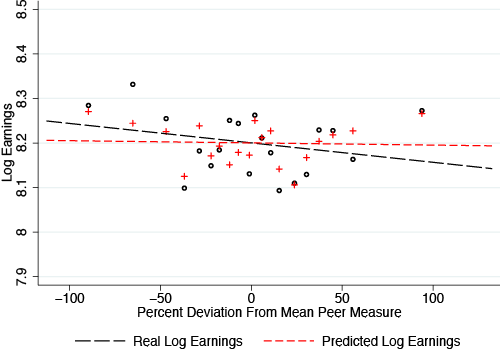
…Figure 1 shows that while individuals who have idiosyncratically low exposure to disruptive peers (those on the left-hand side) tend to earn more than predicted, those with idiosyncratically high exposure tend to earn somewhat less than predicted. Specifically, we estimate that exposure to one disruptive peer in a class of 25 throughout elementary school reduces earnings by 3–4%, with effects being driven by exposure to disruptive boys.

The researchers conclude,

Our findings…speak to the extent to which differential exposure to disruptive students can lead to income inequality later in life. We calculate that the increased exposure to disruptive peers by students from low-income families can explain 5–6% of the earnings gap between adults who grew up in low versus high-income households. This is significant given that we have only one particular measure of disruptive peers in our sample, and it highlights the extent to which sorting into schools can lead to the persistence of long-term income inequality across households.

While the researchers look specifically at children in families exposed to domestic violence, their findings have broader implications about family breakdown, behavioral problems, and income inequality. As Princeton sociologist Sara McLanahan and Harvard’s Christopher Jencks explain, family breakdown can lead to more behavioral problems in children:

[A] father’s absence increases antisocial behavior, such as aggression, rule breaking, delinquency, and illegal drug use. These antisocial behaviors affect high school completion independent of a child’s verbal and math scores. Thus it appears that a father’s absence lowers children’s educational attainment not by altering their scores on cognitive tests but by disrupting their social and emotional adjustment and reducing their ability or willingness to exercise self-control. The effects of growing up without both parents on aggression, rule breaking, and delinquency are also larger for boys than for girls. Since these traits predict both college attendance and graduation, the spread of single-parent families over the past few decades may have contributed to the growing gender gap in college attendance and graduation. The gender gap in college completion is much more pronounced among children raised by single mothers than among children raised in two-parent families.

This new research suggests that the retreat from marriage has a spill-over effect: the behavioral problems of children from broken families not only negatively affect their own educational and financial outcomes, but the outcomes of their peers. When we consider that marriage tends to decrease the chances of children being exposed to both domestic violence (the study’s selection of choice as mentioned above) and violent crimes within neighborhoods, the importance of healthy, stable marriages becomes all the more clear.

Intact families are necessary for the flourishing of children and the adults they will eventually become.

Less Marriage, More Inequality

“In a word,” writes sociologist W. Bradford Wilcox and Anna Sutherland,

the increasingly “separate and unequal” character of family life in the United States is fueling economic, racial, and gender inequality. How is family life “separate and unequal”? First, Americans exhibit a growing class divide in marriage where the college-educated are more likely to enjoy high-quality, stable marriages than the less-educated. For instance, since the divorce revolution of the 1970s, divorce has fallen among college-educated Americans, while remaining comparatively common among Americans without college degrees.

class divide

Furthermore, the timing of these trends provides “strong evidence that family change preceded growing economic inequality. Specifically, the rise of nonmarital childbearing and divorce date back to the 1960s, well before economic inequality began growing in the late 1970s.”

The authors find that “scholarly research demonstrates that America’s growing marriage divide has helped to fuel three forms of economic and social inequality”:

  1. “First and foremost is inequality in Americans’ family income, which has risen since the 1970s.”
  2. “The retreat from marriage also looms large in another form of economic inequality in America: racial inequality.”
  3. “Third, the growing marriage divide is fueling a historically unusual type of gender inequality in low-income communities…”

There’s much more. The research is both compelling and important. Check out the full post.

The Cumulative Cost of Regulation

A recent study out of George Mason University concludes that “[b]y altering investment decisions and disrupting the innovation that comes from investment in knowledge creation, regulations have a cumulative and detrimental effect on economic growth—and, over time, have a real impact on American families and workers.” The key findings:

  • If regulation had been held constant at levels observed in 1980, the US economy would have been about 25 percent larger than it actually was as of 2012.
  • This means that in 2012, the economy was $4 trillion smaller than it would have been in the absence of regulatory growth since 1980.
  • This amounts to a loss of approximately $13,000 per capita, a significant amount of money for most American workers.

Check it out.

Is Globalization Good for the Poor?

World-Poverty-Since-1820

Absolute poverty is declining. This is a fact. “But,” asks Swedish economist Andreas Bergh, “why is poverty falling? Is it happening because of globalization, or perhaps despite globalization?”

His recent blog post on the matter seeks to answer just that. Drawing on some of the latest research, he points out that “more globalization is indeed followed by decreasing poverty, but only a small part is explained by the growth of average income levels.” It seems that globalization via trade liberalization not only brings about income growth, but also increased information. In fact, lower trade restrictions and larger information flows seem to be the major factors behind decreasing poverty.

However, this is arguably the most important finding:

Using various components from the International Country Risk Guide to quantify institutions such as government stability, law and order, bureaucratic quality, corruption and democratic accountability, in combination with the data from Bergh & Nilsson (2014), we showed in a follow-up paper (Bergh, Mirkina and Nilsson 2015) that the poverty-decreasing effect of globalization is bigger in countries where institutions are worse. The graph below shows how the marginal effect of information flows on poverty varies depending on the level of bureaucratic quality. The slope looks the same for all institutional indicators, suggesting that globalization is especially important for the poor in countries with high corruption levels and inefficient public sectors.


Bergh concludes, “[T]he data show rather convincingly that globalization has been good for the poor, but you should still be careful when giving policy advice to countries.”

Gender Wage Gap: Different Choices, Different Pay?

The gender wage gap has been a controversial topic for some time, even though the literature tends show the popular talking points to be exaggerated. For example, the claim that women make 78 cents for every dollar a man makes is misleading because this looks at the average wages of both men and women with no distinction made for careers, education, experience, hours worked, etc.

Nope.

According to the Bureau of Labor Statistics (pg. 80), women work about 5 hours a week less than men. This has been true since 1976. Less hours tend to mean less pay. This has been found to be the case in the medical profession, law, and among MBAs. Men also work more overtime and thus reap its financial rewards. Firms are currently structured to disproportionately favor those who work longer hours (whether this should be changed is worth discussing). Women are also less likely to negotiate for higher salaries, at least when the rules for wage determination are left ambiguous. Noncognitive skills and family preferences also go a long way in explaining the gap. As a 2009 report prepared for the U.S. Department of Labor concluded,

Although additional research in this area is clearly needed, this study leads to the unambiguous conclusion that the differences in the compensation of men and women are the result of a multitude of factors and that the raw wage gap should not be used as the basis to justify corrective action. Indeed, there may be nothing to correct. The differences in raw wages may be almost entirely the result of the individual choices being made by both male and female workers (pg. 2, bold mine).[ref]For a useful rundown of the literature, see economist Diana Furchtgott-Roth’s 2010 testimony before the Joint Economic Committee.[/ref]

A brand new report draws similar conclusions about the choices of men and women when it comes to both careers and college majors (from the abstract):

[W]e find that women, on average, have a higher willingness to pay for jobs with greater work flexibility (lower hours, and part-time option availability) and job stability (lower risk of job loss), while men have a higher willingness to pay for jobs with higher earnings growth. In the second part of the paper, using data on students’ perceptions about the types of jobs that would be offered to them conditional on their college major choices, we relate these job attribute preferences to major choice. We find that students perceive jobs offered to humanities majors to have fewer hours, more worktime flexibility, and higher stability than jobs offered to economics/business majors. These job attributes are found to play a role in major choice, with women exhibiting greater sensitivity to nonpecuniary job attributes in major choice.

Check it out. There is still something like a 6-cents difference in the wages of men and women, which could possibly be due to discrimination.[ref]See pg. 3 of Furchtgott-Roth’s testimony.[/ref] Nonetheless, if we want to get serious about addressing discrimination, we need to be accurate in our assessments. Ninety-four percent and 78% are big differences.

How Much Are You Willing to Pay For Free Stuff?

I think that the word "free" is one of the most misused words. - Milton Friedman
I think that the word “free” is one of the most misused words. – Milton Friedman

A couple weeks ago, I wrote about some polling data on millennials and their (un)willingness to redistribute wealth. A recent poll by Vox and Morning Consult found that while most Sanders supporters (80%) are willing to pay more in taxes,[ref]Compare this to Clinton supporters (70%) or Republicans (40%).[/ref] how much more they are willing to pay paints an interesting picture. “When we polled voters, we found most Sanders supporters aren’t willing to pay more than an additional $1,000 in taxes for his biggest proposals [i.e. nationalized health care and free public college tuition]. That’s well short of how much more the average taxpayer would pay under his tax plan.”

Vox explains,

But Sanders’s plan to pay for universal health care coverage would increase taxes on most voters by more than $1,000. He wants to:

  • Add a 2.2 percentage point surcharge on individual incomes. This means marginal tax rates go up for everyone. (After a standard deduction, about a quarter of households won’t have to pay this surcharge.)
  • Add a new 6.2 percent tax on earnings, which employers pay — but will be passed on to workers over time in the form of lower wages, according to the Tax Policy Center’s Roberton Williams.

The kicker for all of this? Some analysts believe Sanders’s plan will cost twice as much as his campaign estimates.[ref]Other economists have been quite critical of his plan as well.[/ref]

Perhaps even more interesting, “[w]hen you break down the poll results by age, rather than by candidate, it appears older people don’t want to pay as much for universal health care. This is especially interesting because older people have higher premiums, use the health care system more often, and spend a larger portion of their money on health care.” Another finding fits with my previous post: “Older people generally make more money and are more likely to be employed, and our poll shows that people who earn more money would pay less for Sanders’s health care plan — both as a percentage of their income and in dollars.” When it comes to free tuition, 14% of Sanders supporters said they don’t want to pay additional taxes for it with nearly half saying they would only pay up to $1,000 a year.

As the article puts it, “most Sanders supporters don’t want to Feel the Bern in their wallets.” The author concludes,

This isn’t a question of whether Sanders’s ideas are valid. This is a question of how voters are thinking about Sanders’s revolution, which is a radical increase in the scope of what government is responsible for, versus the private sector.

To their credit, some Sanders supporters have done the math and figured out that even with big tax increases, they would end up saving more money from Sanders’s new programs. But many other people were surprised when they used our candidate tax calculator and found out how much additional taxes they would pay under Sanders’s plan.

Yet that’s the revolution — one that promises Medicare for all, public college tuition for all, massive investments in infrastructure, expanded Social Security, etc. Those services require higher taxes, but could also save people money in the long run.

It’s a shift in the way we think about how we pay for social services. But right now, it appears that even Sanders supporters haven’t gotten their heads around what that means for their finances.

Guaranteed Basic Income: A 10+ Year Experiment

The organization GiveDirectly is about to embark on a potentially paradigm-shifting social experiment:

to try to permanently end extreme poverty across dozens of villages and thousands of people in Kenya by guaranteeing them an ongoing income high enough to meet their basic needs—a universal basic income, or basic income guarantee. We’ve spent much of the past decade delivering cash transfers to the extremely poor through GiveDirectly, but have never structured the transfers exactly this way: universal, long-term, and sufficient to meetbasic needs. And that’s the point—nobody has and we think now is the time to try.

The reasons for this are evidence-based:

Across many contexts and continents, experimental tests show that the poor don’t stop trying when they are given money,[ref]There is evidence that government programs and benefits can discourage work (at least in an already rich country like the U.S.), including unemployment benefits, Social Security Disability Insurance and VA’s Disability Compensation, Obamacare, Medicaid, the Negative Income Tax, and other forms of welfare. Charles Murray argued decades ago that the welfare state creates perverse incentives. However, not all forms of welfare are created equal, which is the point of the debate.[/ref] and they don’t get drunk. Instead, they make productive use of the funds, feeding their families, sending their children to school, and investing in businesses and their own futures. Even a short-term infusion of capital has been shown to significantly improve long-term living standards, improve psychological well-being, and even add one year of life.

On the other hand, well-intentioned social programs have often fallen short. A recent World Bank study concludes that “skills training and microfinance have shown little impact on poverty or stability, especially relative to program cost.” Moreover, this paternalistic approach is often for naught: Jesse Cunha, for example, finds no differences in health and nutritional outcomes between providing basic foods and providing an equally sized cash program. Most importantly, though, the poor prefer the freedom, dignity, and flexibility of cash transfers—more than 80 percent of the poor in a study in Bihar, India, were willing to sell their food vouchers for cash, many at a 25 to 75 percent discount.

As the authors note, the “idea of a basic income guarantee is being debated around the globe, with pilots being considered by Finland’s center-right government and Canada’s liberal party, and support from across the political landscape, including libertarians from the Cato Institute[ref]Slight quibble: the essay is for Cato Unbound, but Matt Zwolinski isn’t with the Cato Institute. Nonetheless, Zwolinski has praised GiveDirectly.[/ref] and liberals from the Brookings Institution.”

“But fundamentally,” the authors point out,

the question should be an empirical one: What are the impacts of a universal basic income? And how do they compare with other forms of assistance?

We’re planning to find out. To do so, we’re planning to provide at least 6,000 Kenyans with a basic income for 10 to 15 years. These recipients are some of the most vulnerable people in the world, living on the U.S. equivalent of less than a dollar. And we’re going to work with leading academic researchers, including Abhijit Banerjee of MIT, to rigorously test the impacts.

…To get started, we’re putting in $10 million of our own funds to match the first $10 million donated by others. At worst that money will shift the life trajectories of thousands of low-income households. At best, it will change how the world thinks about ending poverty.

This is really exciting stuff. See more on it here.

The Plight of the Poor in the U.S.

In the comments on my last post, Robert C made an important point based on his own experience that “the poor in the U.S. experience a high degree of social, emotional, and psychological stress in comparison to the lack of such stress among the relatively rich in other countries.” My interest in economics and data is largely about providing proper context and analysis, but sometimes it can make me look like a cold-blooded bastard.

Robert is right though. The working class in America does face major problems. The experiences of those growing up in working-class neighborhoods are often traumatic and these experiences have negative effects on economic outcomes (let alone well-being). David Lapp, a research fellow at the Institute for Family Studies, had a powerful reply to a couple recent articles blasting the American white working class. As Lapp tells it,

No true calamity or awful disaster has befallen the white working class?

Try telling that to [the boy] whose own mother abused him and whose parents left him. Try telling that to the girl molested by her mother’s boyfriend, or the little girl whose mom and boyfriend passed out in the McDonald’s parking lot because of a heroin overdose, or the 10-year-old boy who walked into his parents’ bedroom to find his dad having sex with a stranger. (Those are just some of the typical stories we heard in our interviews with members of the working class in Ohio.) As one young man told me, “Besides killing a small child I would say that divorce is the second-worst thing that can ever happen. Because divorce is the symbol of violently breaking apart. Like in my case, my dad and my mom separating, it tore the family apart, literally. It was the symbol of breaking apart and shards went everywhere.”

I understand the point that Williamson and French are trying to make: when we speak of divorce and abuse and heroin and father absence, we are not talking about the factory that left, but acts perpetrated by adults with moral responsibilities. But that is no solace to the young victims—yes, we must speak of victims—of those traumatic events.

Because the divorce culture is a true calamity for generations of young people growing up in the aftermath. Nor should we imagine that just because a cause is cultural or familial, and not economic, that it involves no victims. As Rod Dreher writes in a response to Williamson’s post, “Children are not empty receptacles into which we can insert knowledge. If they live in homes filled with noise, chaos, violence, and contempt, it doesn’t matter what race they are, they are going to be very lucky to make it.”

Families are in trouble, but people aren’t making bad decisions in isolation. The family is in trouble because marriage is a social institution, and many young people have seen their own parents, grandparents, and great-grandparents divorce (sometimes two, three, and four times). Whatever the reasons for divorce that the pioneers of the divorce revolution had, the young people walking into marriage today—or looking bewilderingly at it from the outside—are left feeling broken. That raises serious questions.

…We can always point to some people who grew up in troubled families and nevertheless succeed. We admire their courage and perseverance. Still, isn’t it self-evident that a child who suffers his parents’ divorce, or the absence of his father, or parental abuse, is much less likely to form good and lasting relationships as an adult? More likely to despair and resort to Oxycontin and heroin? And shouldn’t that fact matter for how we think and talk about the problems that confront the poor and working class, many of whom suffer these traumas?

Lapp recognizes that narratives about the poor often fall into two extreme categories and that he could easily adopt one of these extremes in telling of the story of those he’s interviewed. One extreme highlights external factors and lack of resources (typically the political left), but this largely ignores the poor’s “own words about how things could have been different if they had made different choices.” The other extreme focuses “almost exclusively on these young adults’ own moral responsibilities, and downplay the cultural and economic forces and trauma clearly impinging on their lives” (typically the political right). “The true story,” Lapp says, “…is one that shows how cultural and economic forces and trauma intersect with people’s own free decisions.” To “scold the “downscale” people about their sins and “entitlement” and their communities “that deserve to die”” is to assume that “a person suffering from years of trauma and deprived of good models of family life could just snap out of it with a few good rebukes.” When we do this, we fail “to look squarely at not just “the problem,” but the person in front of us.”

The complexities of poverty demonstrate the need for strong communities, families, churches, charities, and yes, even government programs. I still think economic growth does far more to lift the poor out of poverty than anything else. But when traumatic home life retards your emotional, psychological, educational, and economic development, this is not something that should be shamed. It’s something that should be dealt with through integration into a supportive social network.

And this–to borrow language from one of the recent critiques of the working class–requires us to “get off our asses” and help them out.

Who Are “The Rich”?

In honor of former World Bank economist Branko Milanovic’s[ref]Nathaniel and I used some of Milanovic’s work in our SquareTwo article.[/ref] new book Global Inequality: A New Approach for the Age of Globalization (out this month),[ref]You can find The Economist‘s review of the book here.[/ref] here is a NYT piece on his previous book The Haves and Have-Nots:

The graph shows inequality within a country, in the context of inequality around the world. It can take a few minutes to get your bearings with this chart, but trust me, it’s worth it.

Here the population of each country is divided into 20 equally-sized income groups, ranked by their household per-capita income. These are called “ventiles,” as you can see on the horizontal axis, and each “ventile” translates to a cluster of five percentiles.

The household income numbers are all converted into international dollars adjusted for equal purchasing power, since the cost of goods varies from country to country. In other words, the chart adjusts for the cost of living in different countries, so we are looking at consistent living standards worldwide.

Now on the vertical axis, you can see where any given ventile from any country falls when compared to the entire population of the world.

Now the clincher:

Now take a look at America.

Notice how the entire line for the United States resides in the top portion of the graph? That’s because the entire country is relatively rich. In fact, America’s bottom ventile is still richer than most of the world: That is, the typical person in the bottom 5 percent of the American income distribution is still richer than 68 percent of the world’s inhabitants.

Now check out the line for India. India’s poorest ventile corresponds with the 4th poorest percentile worldwide. And its richest? The 68th percentile. Yes, that’s right: America’s poorest are, as a group, about as rich as India’s richest.

This goes hand-in-hand with yesterday’s post about GDP per capita (PPP). Should provide some much-needed context when we talk about inequality and “the rich.”

GDP Per Capita: United States vs. Everyone Else

Economist Mark Perry has put together an eye-opening chart based on data from the Bureau of Economic Analysis and the World Bank that compares GDP per capita (PPP) in the United States (state-by-state) and other countries, including those of Europe. As Perry explains,

Adjusting for PPP allows us to make a more accurate “apples to apples” comparison of GDP per capita among countries around the world by adjusting for the differences in prices in each country. For example, the UK’s unadjusted GDP per capita was $45,729 in 2014, but because prices there are higher on average than in the US (for food, clothing, energy, transportation, etc.), the PPP adjustment lowers per capita GDP in the UK to below $40,000. On the hand, consumer prices in South Korea are generally lower than in the US, so that increases its GDP per capita from below $28,000 on an unadjusted basis to above $34,000 on a PPP basis.

And what does he find?

states

“As the chart demonstrates,” Perry writes,

most European countries (including Germany, Sweden, Denmark and Belgium) if they joined the US, would rank among the poorest one-third of US states on a per-capita GDP basis, and the UK, France, Japan and New Zealand would all rank among America’s very poorest states, below No. 47 West Virginia, and not too far above No. 50 Mississippi. Countries like Italy, S. Korea, Spain, Portugal and Greece would each rank below Mississippi as the poorest states in the country.

The Cato Institute’s Daniel Mitchell adds a few more points, including the OECD’s Individual Consumption Index:

He concludes,

None of this suggests that policy in America is ideal (it isn’t) or that European nations are failures (they still rank among the wealthiest places on the planet).

I’m simply making the modest — yet important — argument that Europeans would be more prosperous if the fiscal burden of government wasn’t so onerous. And I’m debunking the argument that we should copy nations such as Denmark by allowing a larger government in the United States (though I do want to copy Danish policies in other areas, which generally are more pro-economic liberty than what we have in America).


Good stuff.