This is part of What I’m Watching (sort of).
I’ve fallen behind on my additions to What I’m Watching. Way behind. So, instead of doing longer posts like I’ve done in the past, I’m going to list all the series I’ve watched over the last several months with a brief synopsis and a few quick thoughts. I’ll include the ones I’m still watching at the end without comment.
Completed:
 The Melancholy of Haruhi Suzumiya (2006, 2009): “Kyon is a cynical and incredulous student of North High School in Nishinomiya. He is dragged along by his classmate, the eponymous protagonist Haruhi Suzumiya, an eccentric girl who is seeking supernatural phenomena and figures such as aliens, time travelers, and espers. With Kyon’s reluctant help, Haruhi establishes a club called the “SOS Brigade” (SOS団 Esu-Ō-Esu Dan), short for “Spreading excitement all Over the world with Haruhi Suzumiya Brigade”…to investigate mysterious events. Haruhi later recruits three additional members: the laconic bibliophile Yuki Nagato, the shy and timid Mikuru Asahina, and the extremely friendly transfer student Itsuki Koizumi. These members soon reveal themselves (to Kyon) to be the types of extraordinary characters that Haruhi is seeking. They have been sent by their organizations to observe Haruhi — who is unaware that she possesses destructive reality warping powers — and to prevent these powers from being unleashed. This leaves Kyon the task of maintaining the illusion of a normal life for Haruhi” (Wikipedia).
I absolutely adored season one. The concept is totally bizarre, the comedy is top-notch, and the characters are fantastic (even if Haruhi’s sexualization of Asahina is a bit uncomfortable). Unfortunately, season 2 is bogged down by its infamous 8-episode story arc, which could’ve been well-done in a two-or-three-parter instead of the repetitive eight. While there are a couple highlights, overall the second season is a major letdown after such a memorable first one. Watch the first, skip the second.
 One-Punch Man (2015): “On an unnamed Earth-like super-continent planet, strange monsters and supervillains have been mysteriously appearing and causing disasters. To combat them, the world’s superheroes have risen to fight them. Saitama is one such superhero, hailing from the metropolis of Z-City and easily defeating monsters and villains with a single punch. However, he has become bored with his power and only gets truly excited when fighting strong opponents that can challenge him. Over the course of the series, Saitama encounters various superheroes, supervillains, and monsters. He gains a disciple in the form of the cyborg Genos and eventually joins the Hero Association in order to gain official recognition” (Wikipedia).
The premise combined with Saitama’s often deadpan delivery (as well as his occasional freak-outs) adds up to some incredibly funny moments. The action is also pretty spectacular, even if the story line is fairly thin: battles which are episodic in nature with no major developments plot wise (think Mighty Morphin’ Power Rangers with a new rampaging monster to defeat each episode). Throw in a mix of characters–from the epic to the absurd–and you get nothing but pure fun.
 Attack on Titan (2013, 2017): “Over 100 years ago, a natural predator of humanity appeared: the Titans, giant humanoid but mindless monsters whose sole purpose of existence seemed to be to devour humans. There was an insurmountable gap in power between them and mankind, and as a result, humanity was rapidly exterminated to the brink of extinction. The survivors responded by constructing three concentric walls: Wall Maria, Wall Rose and Wall Sina, which graced them with a century of peace. However, one day a Colossal Titan far larger than any other seen before breached the outer wall, allowing the smaller Titans to invade the human territory and forcing the survivors to retreat to the inner walls. Eren Jaeger, a boy whose mother was eaten during the invasion, vowed to wipe every last Titan off the face of the Earth, and joined the military determined to exact his revenge” (Attack on Titan WIKI).
When my brother-in-law first told me of this show, I thought it sounded a tad ridiculous…until I watched the gruesome first episode. Titan features some of the most epic battle scenes I’ve ever seen; scenes that are made all the more exhilarating thanks to its incredible soundtrack. Furthermore, the narrative is shrouded in mystery, with constant twists, turns, and mind-blowing reveals. Pacing at times is an issue and Eren is a somewhat annoying lead, but it’s difficult to find fault with a show that takes everything that was great about early The Walking Dead and turns it to 11. Can’t wait for Season 3 next year.
 One Week Friends (2014): “Fujimiya Kaori has a strange condition; every Monday she loses all her memories of her friends. She hides herself away, never making any friends to forget, until her classmate Hase Yuki starts eating lunch with her on the roof. Together, the two work to address Fujumiya’s challenges as she learns to open up to people and expand her circle of companions” (Nihon Review).
Think 50 First Dates with Adam Sandler, but actually good. The message that friendship is both necessary *and* difficult (even without a disability) is a powerful one. The resolve Yuki shows at the beginning—pledging to be Kaori’s friend in the face of a challenging disability—is heartfelt and moving, making the ending all the more satisfying. Cute, if sentimental.
 Your Lie in April (2014-2015): “Piano prodigy Kousei Arima dominated the competition and all child musicians knew his name. But after his mother, who was also his instructor, passed away, he had a mental breakdown while performing at a recital that resulted in him no longer being able to hear the sound of his piano even though his hearing was perfectly fine. Even two years later, Kousei hasn’t touched the piano and views the world in monotone, and without any flair or color. He was content at living out his life with his good friends Tsubaki and Watari until, one day, a girl changed everything. Kaori Miyazono is a pretty, free spirited violinist whose playing style reflects her personality. Kaori helps Kousei return to the music world and show that it should be free and mold breaking unlike the structured and rigid style Kousei was used to” (Your Lie in April WIKI).
This one always has high marks among anime reviews, but I was personally a little disappointed. I loved witnessing Arima struggle with and defeat his personal demons, but Kaori’s lack of character development undermines the nature of their relationship. Plus, the sudden tonal shifts–jumping from deadly serious to comical instantaneously–don’t work as well as they do in, say, Fullmetal Alchemist: Brotherhood and are therefore distracting. Finally, I would liked to see more about the technicalities of music similar to the way new techniques are explored in sports animes (e.g., Haikyuu!!). Nonetheless, the music performances are great, the animation is beautiful, and it still tugs enough at the heartstrings to be worthwhile.
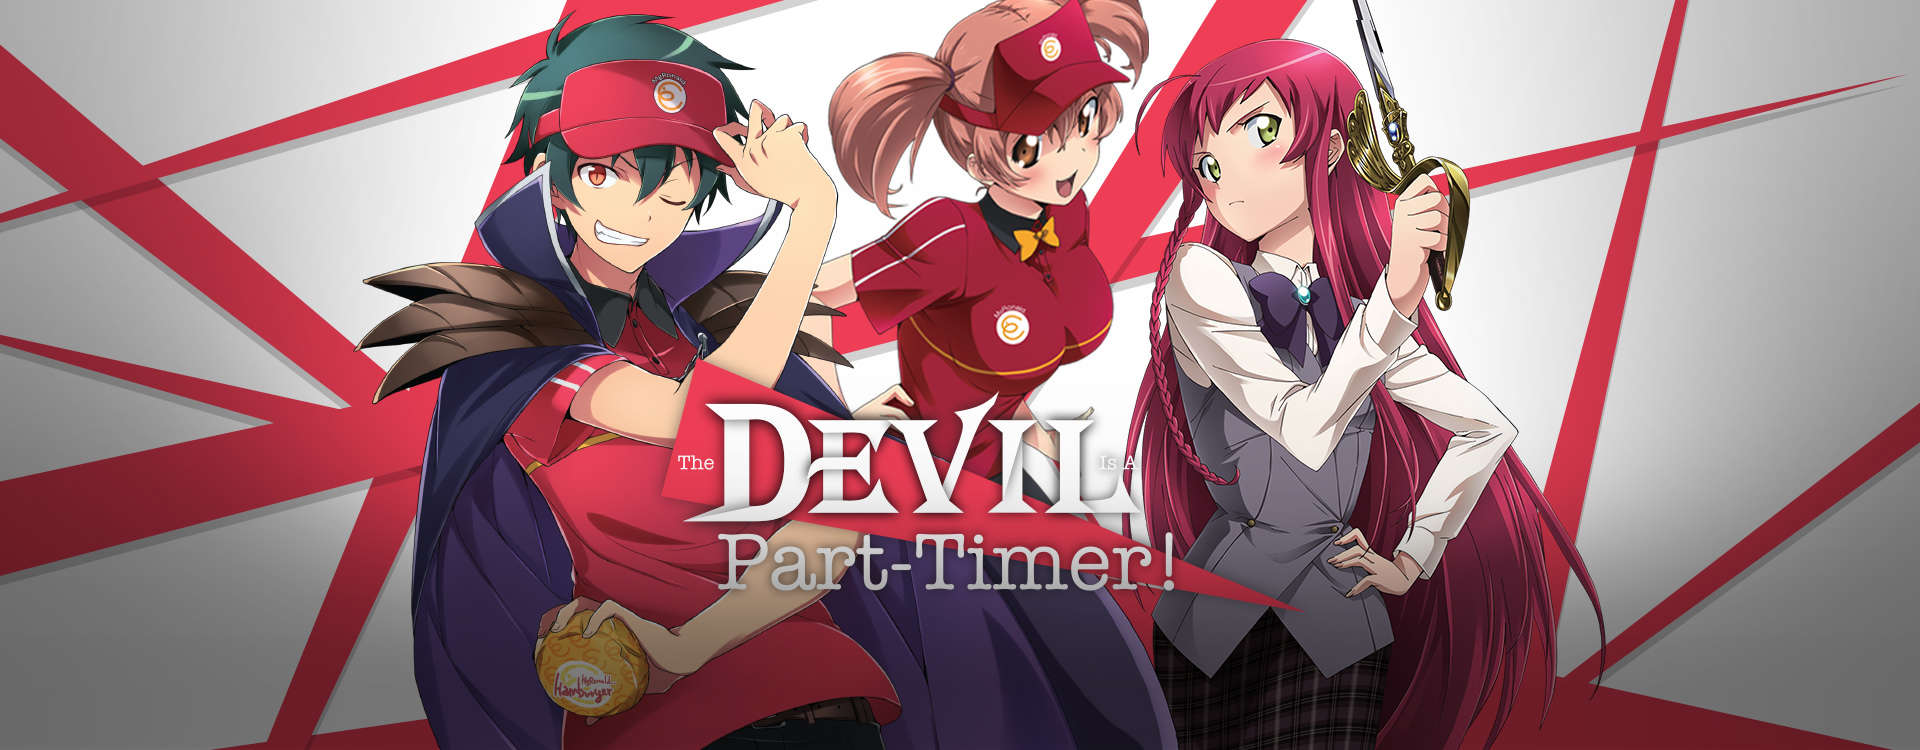 The Devil Is a Part-Timer! (2013): “In another dimension, the Demon Lord Satan and his forces of evil were defeated by the Hero Emilia Justina and her armies. Satan and his Demon General Alsiel were forced to flee through a portal which dropped them off in modern day Japan. With their magic slowly depleting in an unfamiliar world, they are forced to act as normal human beings in order to survive. The Hero Emilia Justina follows them through the portal and is also met with the same circumstances. Although she still harbours negative feelings towards Satan for his past acts of evil, they become unlikely allies in order to survive” (The Devil is a Part-Timer WIKI).
Another fun and quirky series along the lines of Haruhi Suzumiya (though not as brilliant). The protagonist’s ambition of worldwide domination via working up the corporate ladder of a fast-food chain is both hilarious and relatable. Plot development is only fair, but works well enough for the situational comedy. The second half didn’t feel as fresh as the first (which was pure gold), but nonetheless highly enjoyable.
 Fullmetal Alchemist: Brotherhood (2009-2010): “Alchemy is the art of transforming matter. However, in order to create something, the alchemist has to present something of equal value; this is the golden rule of alchemy. After losing their mother to a disease, Edward and Alphonse Elric try to resurrect her, an illegal taboo in the world of alchemy. Through the unsuccessful process Edward loses his arm and his leg and has to transmute Alphonse’s soul (which lost its body,) to a suit of armor. Afterward the two set off on a journey to find the legendary philosopher’s stone and use its magic to reunite with their bodies. In the process Edward joins the army and a much bigger plot unfolds” (Nihon Review).
This series always occupies the top spots in anime lists and for good reason. The characters are fleshed out, the action is impeccable, and the story is complex and gripping. Then there is the almost philosophical way FMAB explores the ins and outs of morality, human nature, family, and friendship. What’s more is the finale is completely satisfying. It took me a few episodes to really get really engaged, but the 60+ episode journey was well worth the effort.
 Scum’s Wish (2016-2017): “High school student Hanabi Yasuraoka has been in love with her older childhood friend who is now her homeroom teacher Narumi Kanai. But from the look in Narumi’s eyes when he sees the new music teacher Akane Minagawa, Hanabi realizes that he is in love with Akane and not her. Hanabi meets Mugi Awaya, another student who is in love with Akane, who was his tutor when he was in middle school. Hanabi and Mugi make a pact and begin a fake relationship to satisfy each other’s loneliness from their respective unrequited loves, both sexually and emotionally. They agree to not fall in love with each other and end the relationship if their love is returned from the people they are in love with” (Wikipedia).
An odd series that portrays teenage awkwardness, loneliness, longing, and sexual frustration rather well. The show was a bit uncomfortable to watch at times (anything regarding teenage sex would be), but I was captivated by how realistic the emotions onscreen seemed. Unfortunately, the story eventually devolves into absurdity, cheapening an otherwise interesting premise.
 My Teen Romantic Comedy SNAFU (2013, 2015): “The story follows two loners: the pragmatic Hachiman Hikigaya and beautiful Yukino Yukinoshita, who, despite their varying personalities and ideals, offer help and advice to others as part of their school’s Service Club, assisted by the cheerful and friendly Yui Yuigahama. It largely depicts various social situations faced by teens in a high school setting and the psychology driving their interactions” (Wikipedia).
A series about highly-intelligent high school loners isn’t all that exciting of a premise and it admittedly took me a little bit to get into show, but by the end of Season 2, I was more than happy that’d I given it a shot. Loneliness is something everyone has experienced. The search for belonging is a universal one and watching these characters–despite the exaggerations of their various traits–on that quest is a moving one.
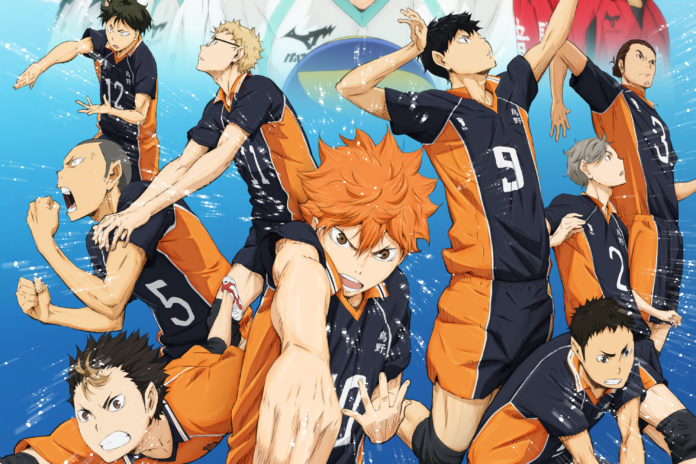 Haikyuu!! (2014-2016): “Hinata Shoyo dreams of playing volleyball, just like his idol the Little Giant. In Junior High, his thrown-together team is thoroughly crushed by another school led by setter, Kageyama Tobio, the “King of the Court”. Hinata swears revenge against the King, only to discover upon joining the Karasuno High School volleyball club that Kageyama is not his adversary, but his new teammate. Together with the other players, they have to battle hard to regain their schools reputation as one of the best in the prefecture” (Nihon Review).
This was my first sports anime and I unequivocally loved it. It embodies everything I love about anime: inner monologues that capture the essence of various emotions and mental states (e.g., insecurity, despair, concentration, joy), the apotheosis of the mundane (e.g., the grind of continual practice, new techniques), and the complete immersion in the story as a viewer. Furthermore, Haikyuu!! never paints the opposing teams as villainous, but as fellow players with the same hopes and dreams as the Karasuno team. I’m very much looking forward to Season 4.
Still Watching:
 The Classroom of the Elite (2017): “In the not too distant future, the Japanese government has established the Tokyo Metropolitan Advanced Nurturing School, dedicated to instruct and foster the generation of people that will support the country in the future. The students there have the freedom to wear any hairstyle and bring any personal effects they desire. Our protagonist is Kiyotaka Ayanokōji, a quiet, unassuming boy who is not good at making friends and would rather keep his distance. He is a student of D-class, which is where the school dumps its inferior students in order to ridicule them. After meeting Suzune Horikita and Kikyō Kushida, two other students in his class, Kiyotaka’s situation begins to change” (Wikipedia).
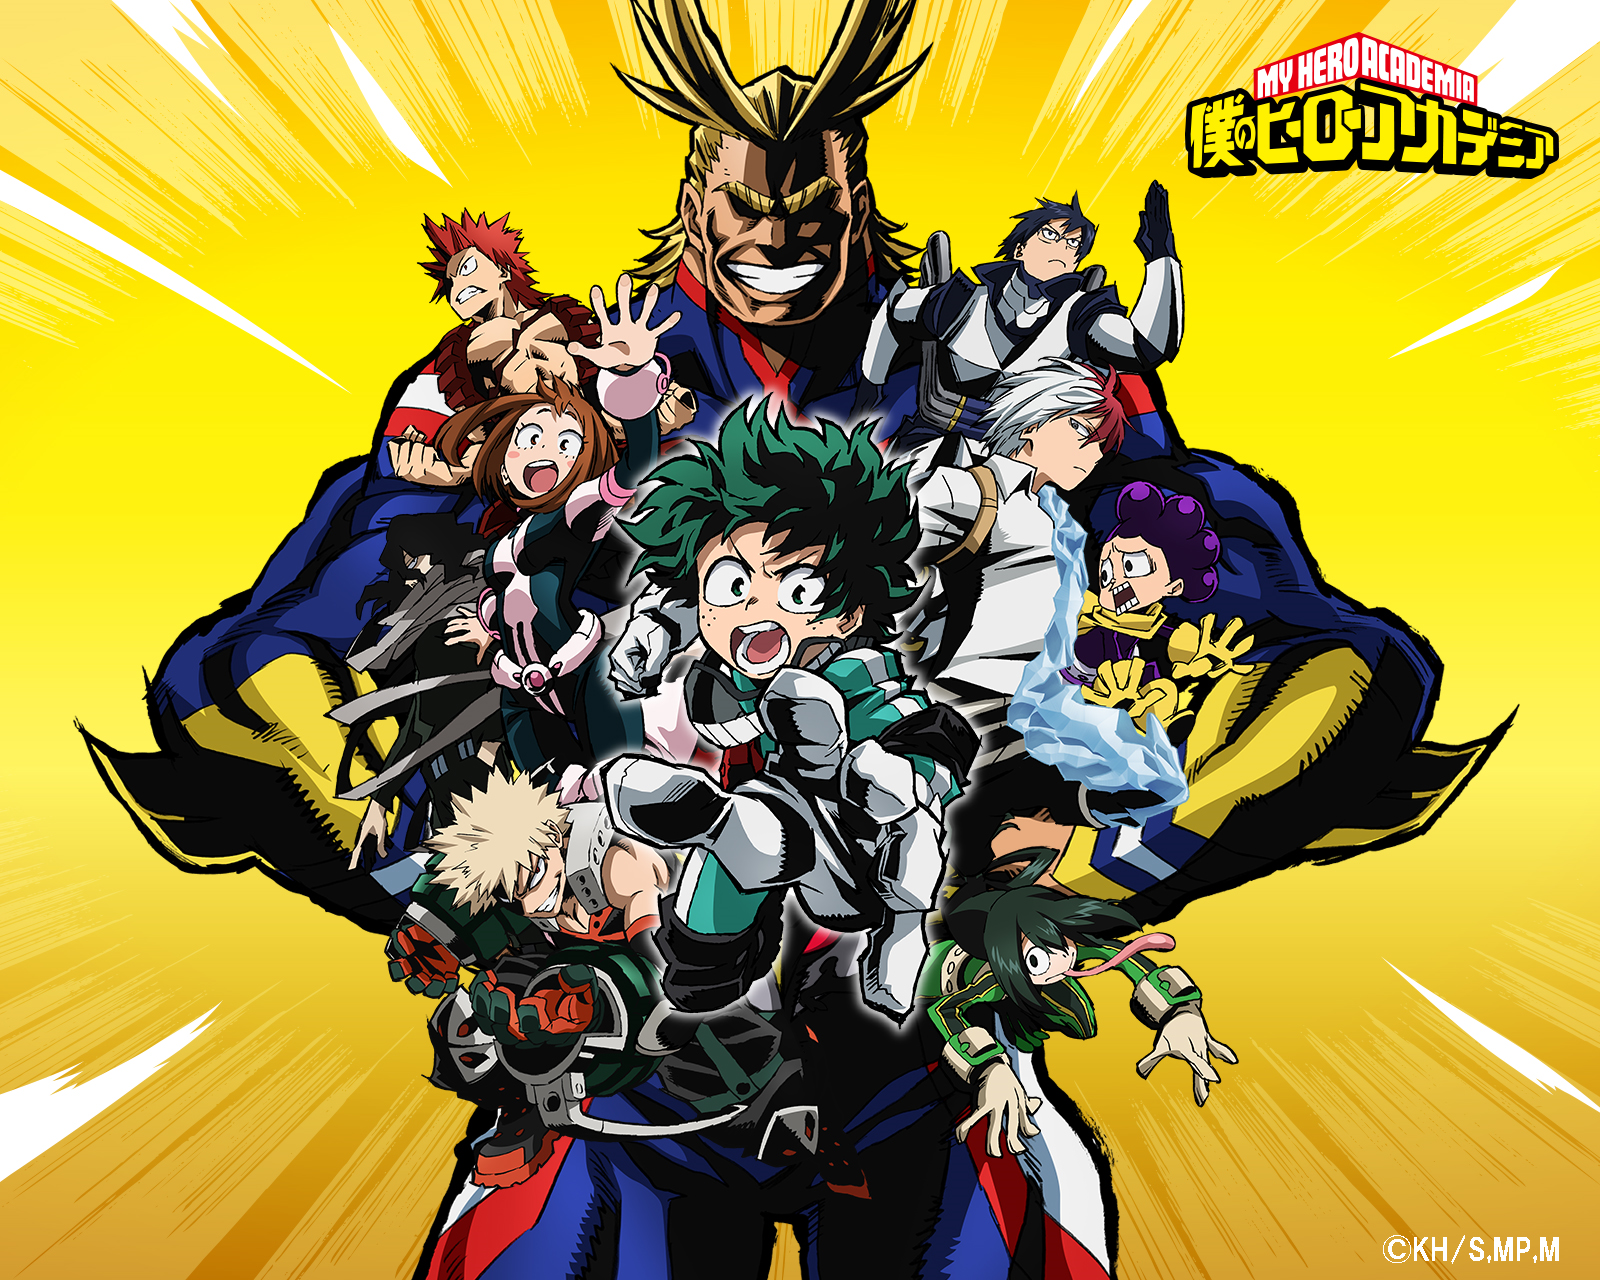 My Hero Academia (2016-2017): “A new phenomenon has appeared among mankind. 80 percent of the population possess superpowers known as “Quirks”, and this gave birth to the rise of heroes and villains. Being a hero has always been high school student Midoriya Izuku’s dream, and All Might, the greatest hero of all, is his all-time inspiration. Unfortunately, Midoriya learns that he possesses no Quirks and is fated never to become a hero at all. One day, he gets rescued by none other than All Might himself after being attacked by a villain. Little did he know that on that fateful day, he learned All Might’s deepest secret, one that would change his life forever and what it means to follow All Might’s footsteps” (Nihon Review).
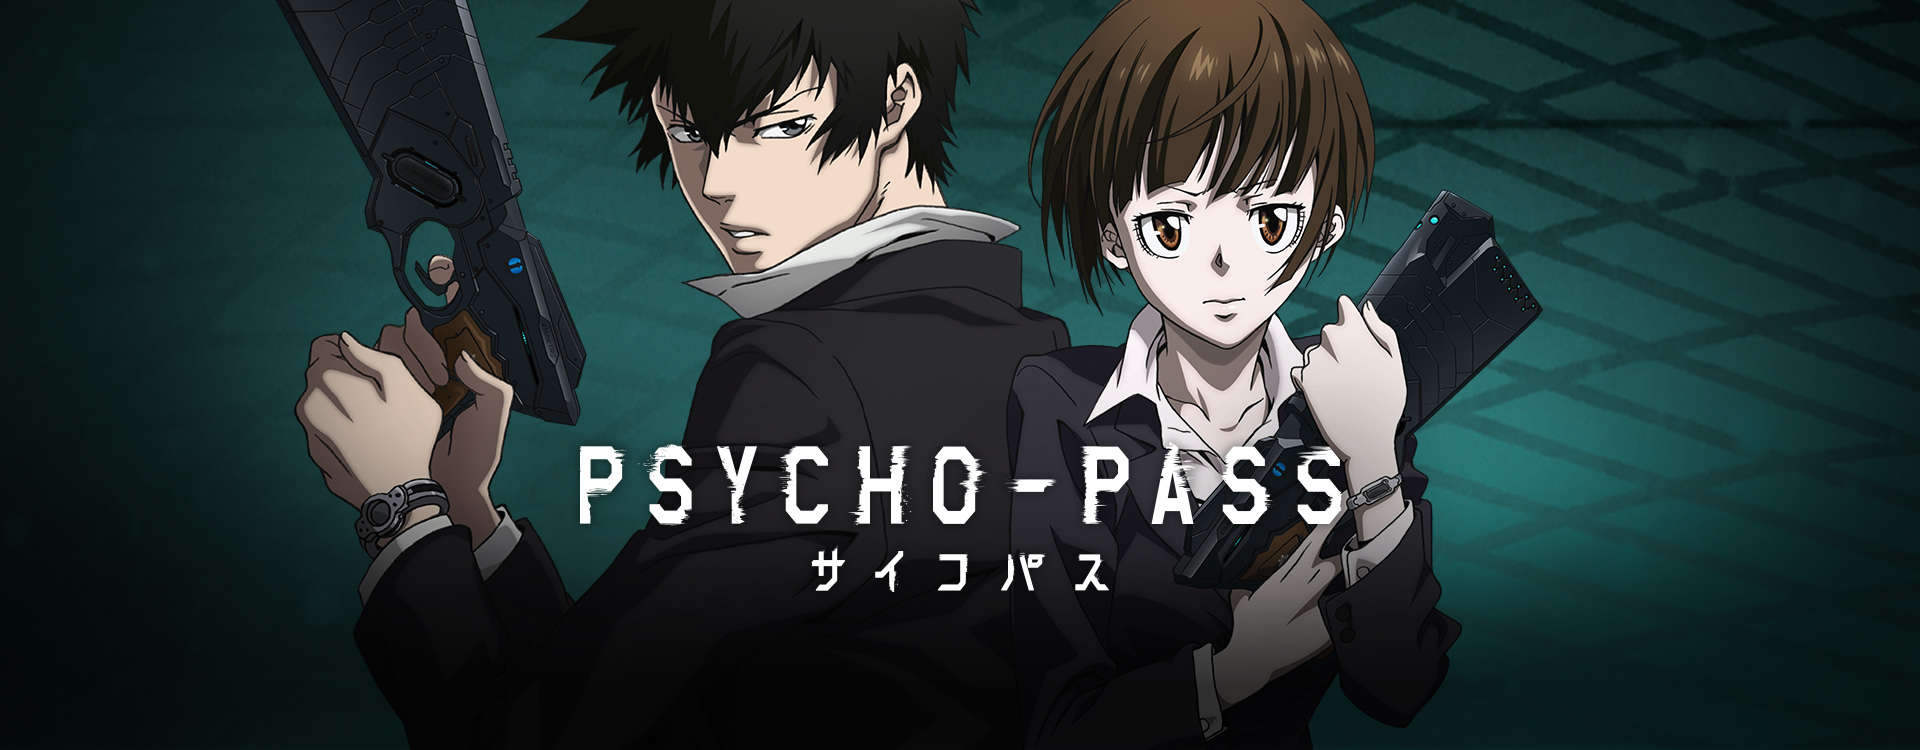 Psycho-Pass (2012-2013): “In the near future, Japan has taken a strong stance for isolationism and has created its own self-sufficient bubble controlled by a series of supercomputers. By implanting a chip into the brains of its citizens, this society has cracked the code to people’s inclinations, aptitudes and psychological well being. As a result, crime has been almost eradicated, and employment is practically pre-determined based on the person’s metrics. The show follows the lives of a series of police officers who investigate the few crimes the system failed to predict, and bring in the perpetrators for rehabilitation. However, should the algorithms decide that the criminals cannot be salvaged, they are exterminated on the spot” (Nihon Review).
 Sword Art Online (2012): “In the year 2022, a game called Sword Art Online is released. It is a virtual reality massive multiplayer online role-playing game that is played with a helmet called the Nerve Gear. One day the players discover that they are unable to log out. The creator of the game, Akihiko Kayaba, informs them that they cannot escape until they beat the game, and if they die in the game, they will die in real life. The swordsman Kirito’s quest to escape this life and death game now begins” (Nihon Review).
 Monster (2004-2005): “Doctor Tenma Kenzou is one of the best brain surgeons in the world. But one day he decides to perform surgery on a 10 year old over the City’s Mayor. After saving the boy, the Director of the Hospital and the Doctors that worked in the Mayor show up dead in the hospital, and the boy who Dr. Tenma saved is missing, along with his twin sister. 9 years later a patient of Dr. Tenma is murdered and the cops place him as the main suspect, but Dr. Tenma knows who did it; the boy he saved 9 years ago, he revived a Monster then and he must kill the Monster now, before more murders occur” (Nihon Review).
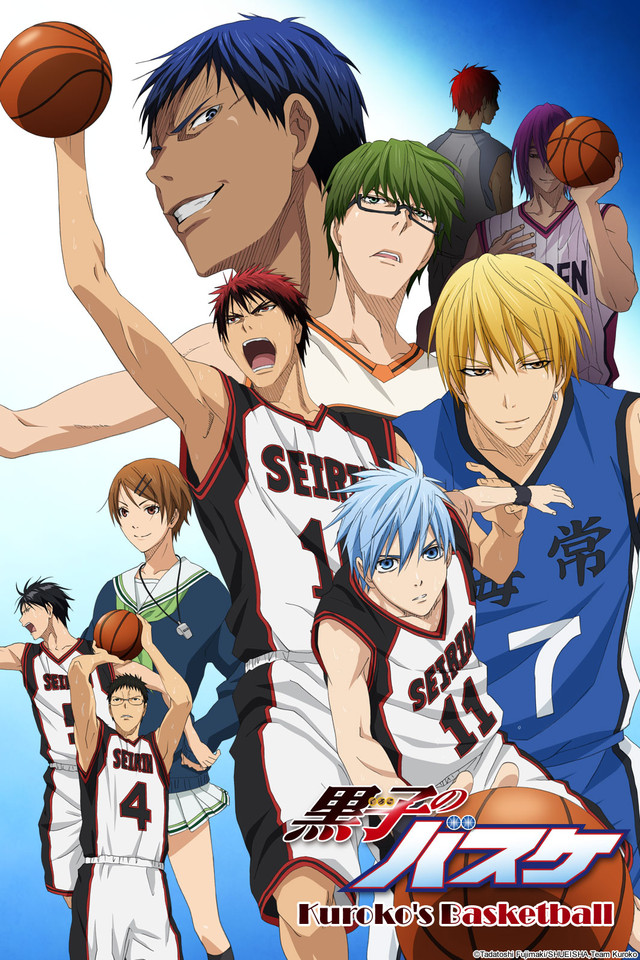 Kuroko’s Basketball (2012-2015): “The Teikō Middle School basketball team had been labelled unrivaled after winning for three consecutive years every championship game they were in. This impressive track record was attributed to the star players, whose exceptional skill and raw talent earned them the moniker ”Generation of Miracles”. Following graduation, each member of the Miracles went on their separate way to join different high school basketball teams. Kuroko Tetsuya, once part of this undefeated team as a sixth member who earned the acknowledgement and respect of the others, decides to enlist in Seirin High School’s basketball club. There he meets Kagami Taiga, a basketball player with promising ability, and they both make a pledge to defeat the Generation of Miracles and become the top players in Japan” (Nihon Review).


 Princeton molecular biologist Daniel Notterman and colleagues published a new article in Pediatric titled “
 refers to family and friends who support you through difficult times, as well as neighbors and coworkers who diversify your network and expose you to new ideas. While social capital originally referred to face-to-face interaction, it now also accounts for virtual interactions online such as email or on social media platforms like Facebook, Instagram, Twitter, and LinkedIn.
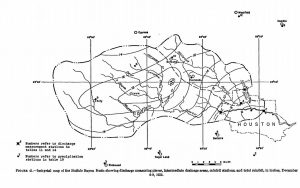 the following map of the Houston storm’s effects, showing unsettling similarities to what we just witnessed (note that this map does not include the areas to the north of town, where rainfall in 1935 was significantly higher. These are the suburbs that flooded along Cypress and Spring Creeks last weekend and the farmland that similarly flooded in 1935)